The following is a summary of global temperature conditions in Berkeley Earth’s analysis of August 2022.
- Globally, August 2022 was the 3rd warmest August since records began in 1850.
- Warm conditions occurred in Europe, parts of Asia, parts of North America, parts of the North Atlantic and several parts of the Pacific Ocean.
- Unusually cool conditions were present in the Equatorial Pacific and parts of Asia.
- June to August 2022, i.e. Northern Summer, was the warmest such period on record.
- Moderate La Niña conditions are present and likely to continue.
- 2022 is likely to the be the 4th or 5th warmest year.
Global Summary
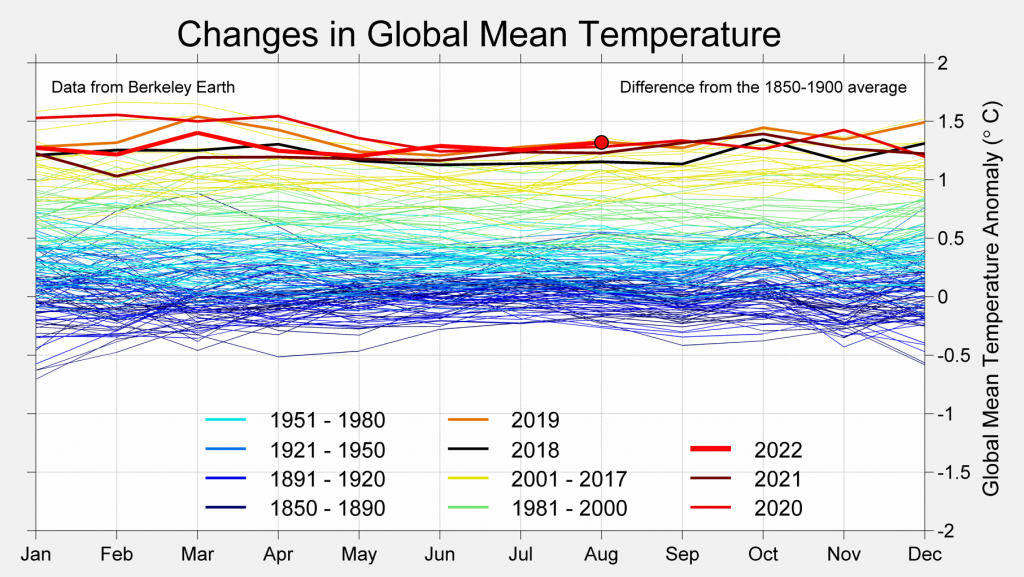
Globally, August 2022 has been the third warmest August since records began in 1850. This August is slightly cooler than the two previous Augusts, in 2016 and 2019, and slightly warmer than August 2020, All other previously observed years had an August significantly cooler than in 2022.
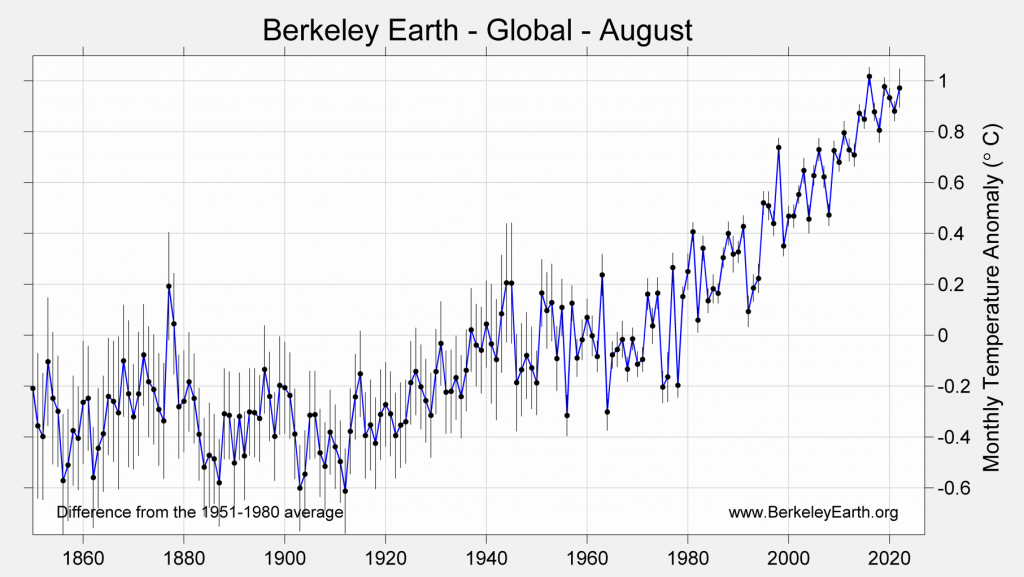
The global mean temperature in August 2022 was 0.97 ± 0.08 °C (1.75 ± 0.14 °F) above the 1951 to 1980 average, which is a modest from July.
This is equivalent to being 1.32 ± 0.10 °C (2.37 ± 0.17 °F) above the 1850 to 1900 average, which is frequently used as a benchmark for the preindustrial period.
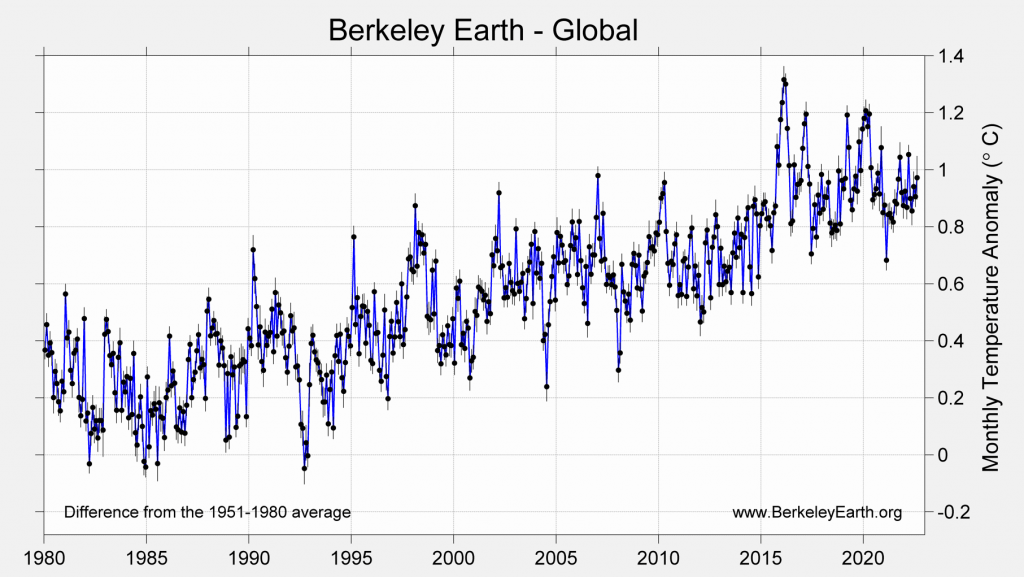
The global mean temperature anomaly in August 2022 was a slight decrease from July 2022 and similar to several other recent months. Temperatures in August were close to the long-term trend line despite the cooling effect of the ongoing La Niña conditions.
Spatial Variation
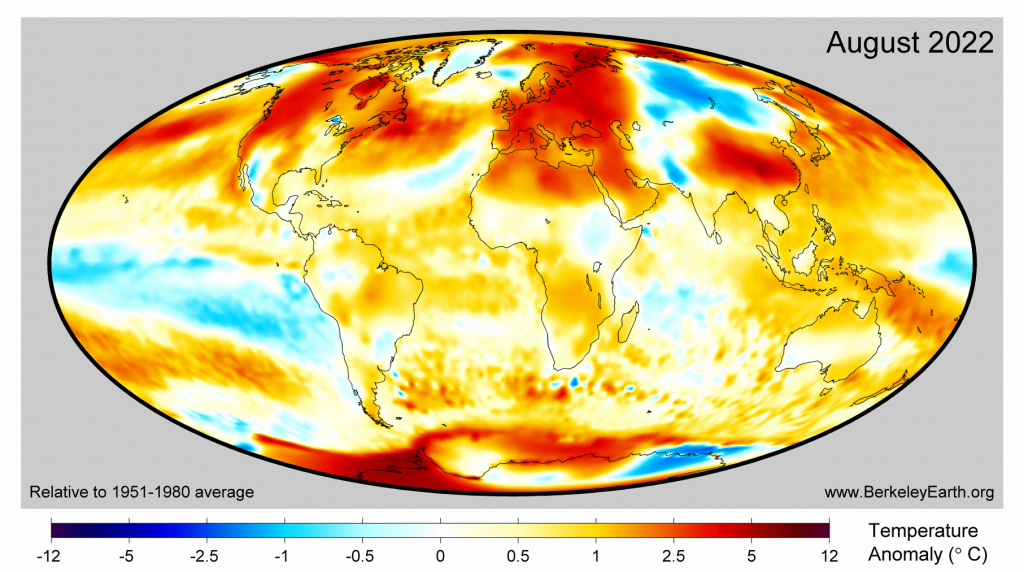
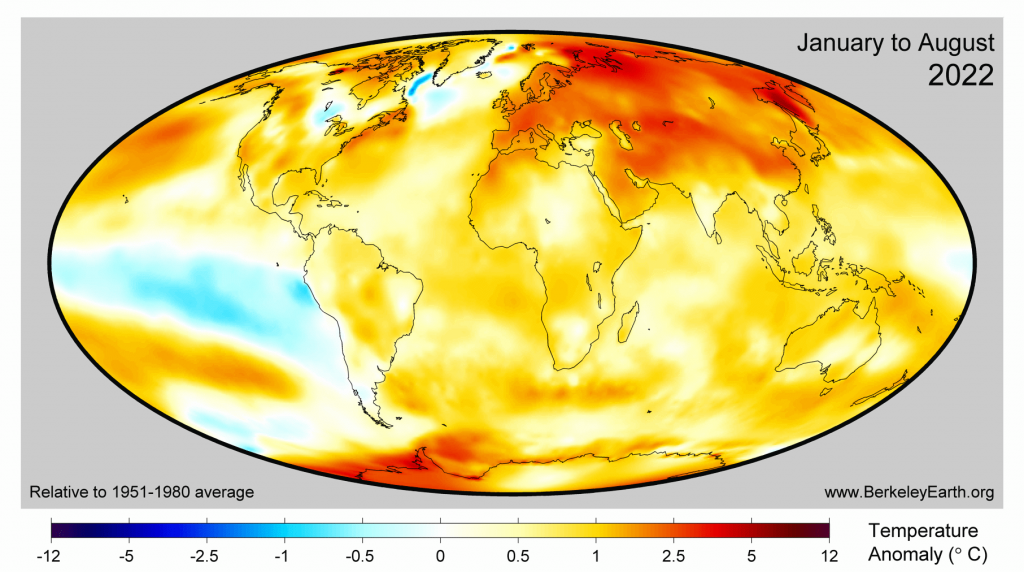
August 2022 continues the ongoing pattern of widespread warmth, though with some notable exceptions. Particularly warm conditions were present in much of Europe, in parts of Asia and North America. Record setting warmth was also present in significant portions of the North Atlantic and the North and South Pacific Ocean. Particularly cool conditions were present in the Eastern equatorial Pacific Ocean as well as portions of Asia.
We estimate that 6.5% of the Earth’s surface experienced their locally warmest August average, and 74% of the Earth’s surface was significantly warm when compared to their local average during the period 1951 to 1980. In addition, 0.01% of the Earth’s surface had their locally coldest August.
The cool area in the Eastern Pacific is consistent with the ongoing La Niña conditions.
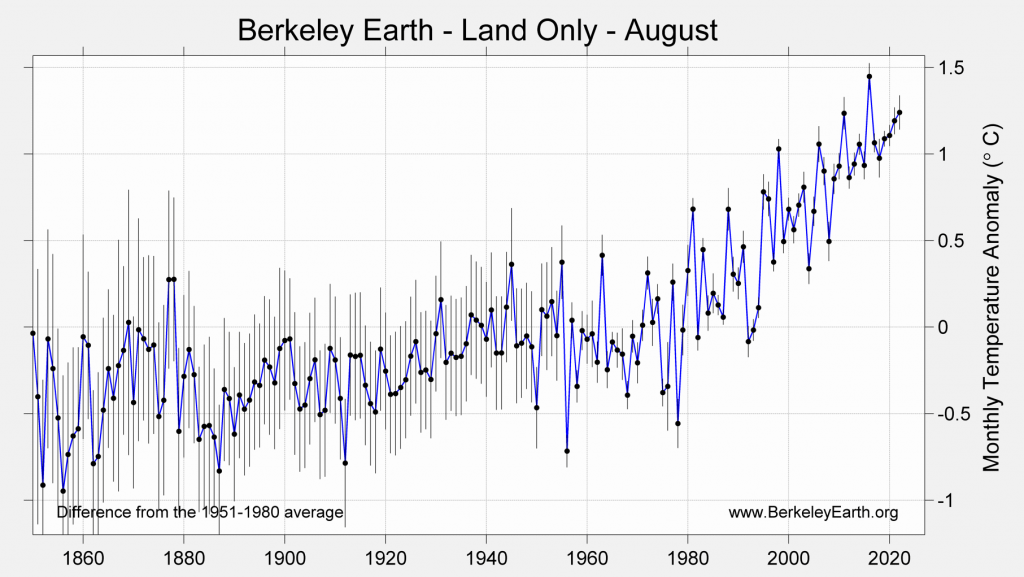
Over land regions, 2022 was the 2nd warmest August, falling markedly below August 2016, but similar to 2011 and 2021. The land average was 1.24 ± 0.10 °C (2.23 ± 0.18 °F) above the 1951 to 1980 average.
August 2022 was the 6th warmest August in the oceans, recorded as 0.70 ± 0.09 °C (1.26 ± 0.16 °F) above the 1951 to 1980 average. This relatively low rank is influenced by the cooling effects of the ongoing La Niña event.
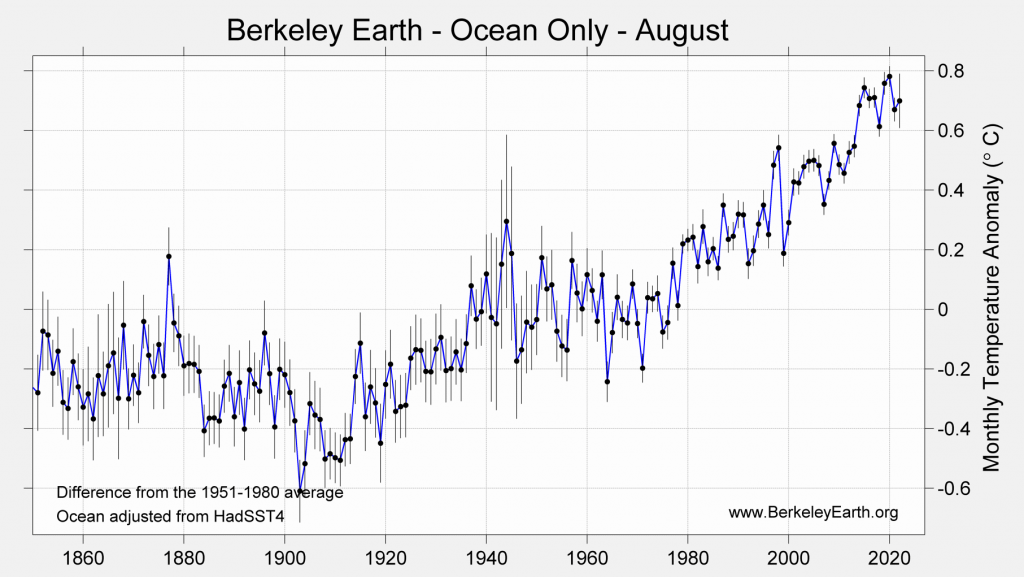
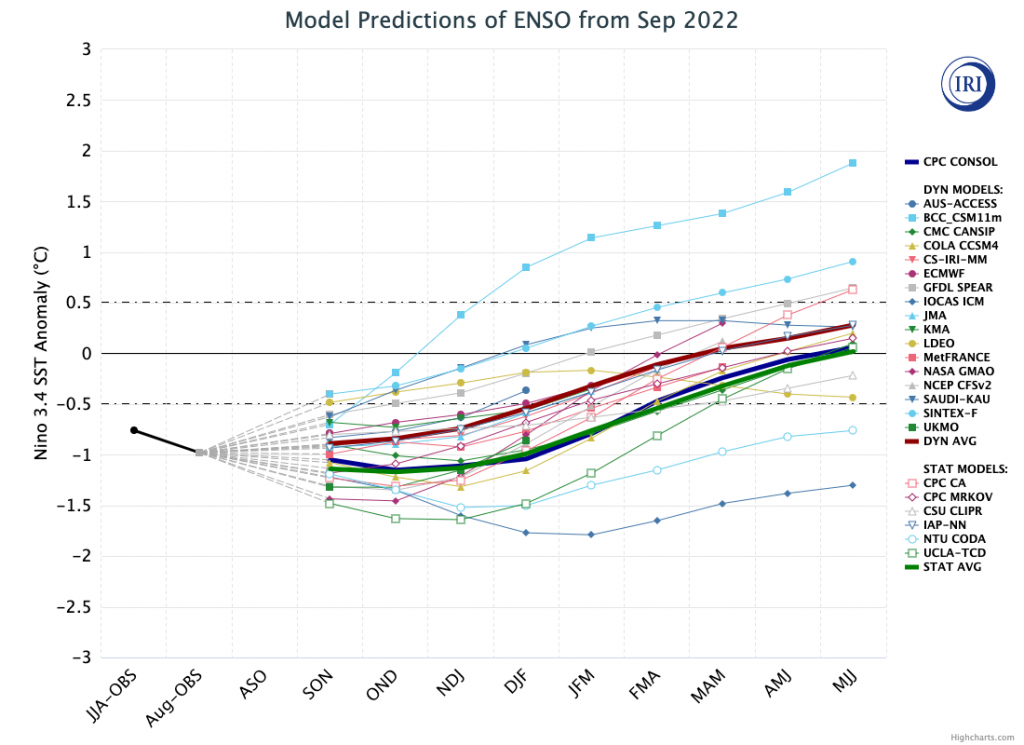
La Niña
August 2022 had well-defined moderate La Niña conditions in the Pacific Ocean. The La Niña phenomenon, associated with relatively cool water in the Eastern equatorial Pacific, is a form of seasonal weather variability that is generally associated with cooler global average temperatures. The current La Niña event began in 2020 and has exhibited surprising longevity. This La Niña is likely to continue into the next year. The CPC/IRI analysis suggests that either La Niña or neutral conditions are likely over the rest of the year, with only a < 10% chance of a shift to El Niño conditions before the middle of next year.
June to August 2022
The 3 month period from June to August corresponds to Northern Hemisphere summer. This year the global average for June to August was the warmest such period ever observed, slightly beating out 2019 and 2020.
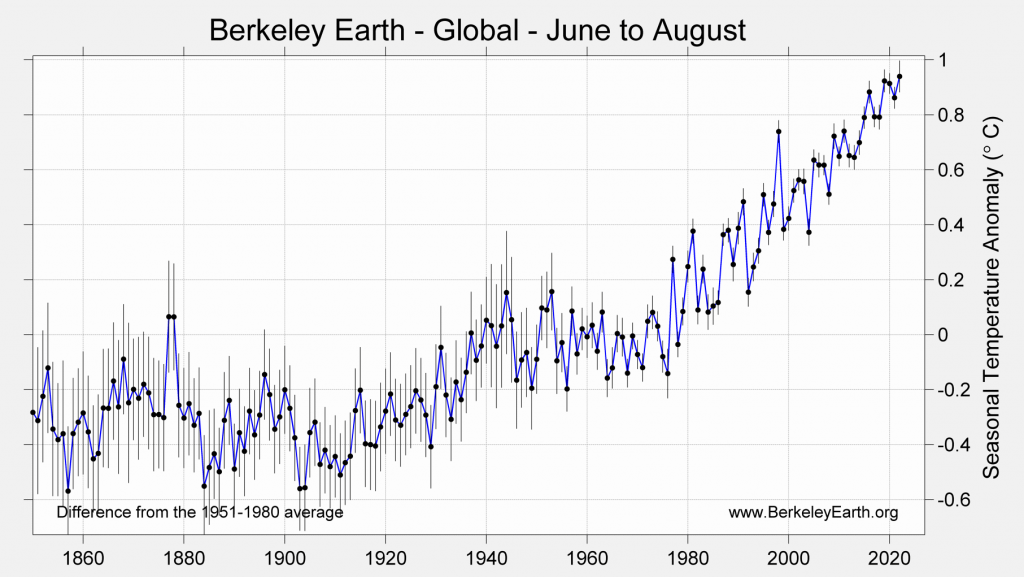
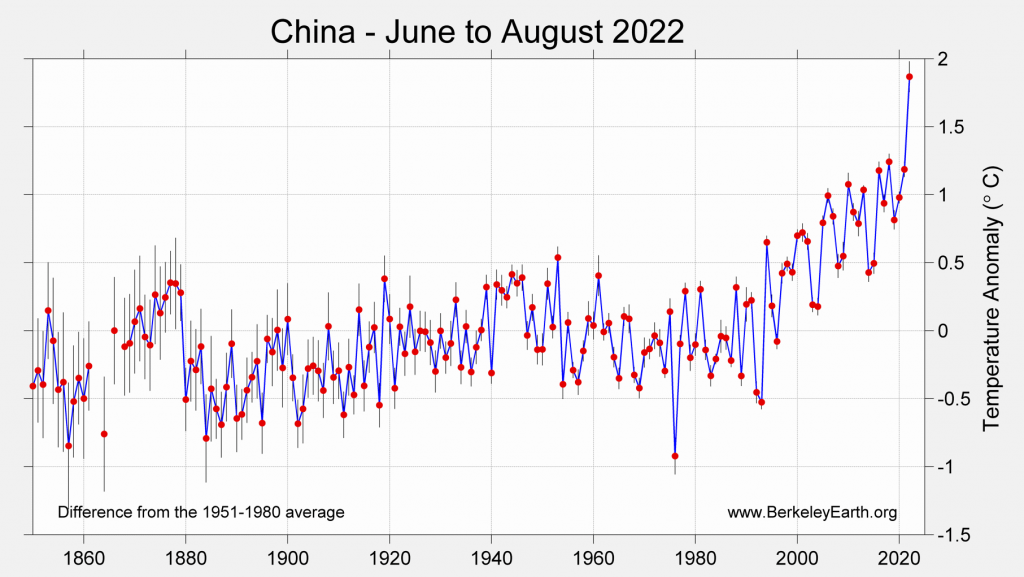
This period set numerous records in the Northern Hemisphere, with the heatwaves in Europe and China being especially notable. This July, UK had its first ever >40 °C (104 °F) high temperature, and the associated heatwave has been blamed for >3,000 excess deaths in the UK alone. At the same time, China has been setting record high temperatures, experienced record low water levels on major rivers, and experienced its warmest summer on record by a margin of more than 0.5 °C (1 °F) above the previous record.
The warmest year on record for China was 2021, and they are on pace to set a new annual record in 2022.
Year to Date
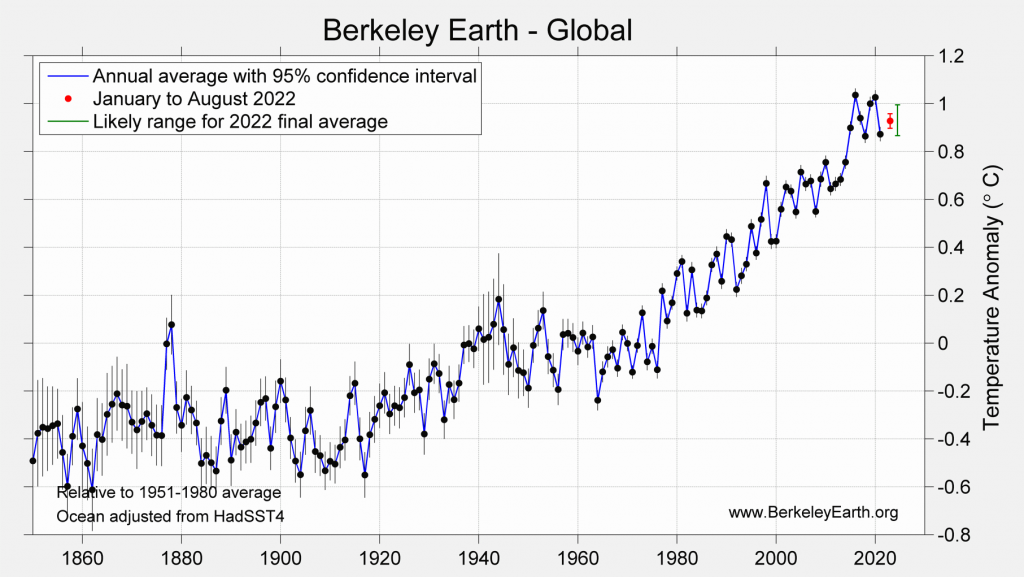
The first 5 months of 2022 were significantly cooler than their corresponding monthly records; however, June, July, and August, have each been only very slightly below their corresponding records. Nonetheless, every month has been at least 1.1 °C warmer than the 1850-1900 average. As a result, 2022 is currently positioned as the 5th warmest year.
The most prominent spatial features of year to date temperatures are the cool La Niña pattern, warmth over Asia, and record warmth in the North and South Pacific. Parts of Western Europe, including the UK, have also seen record or near-record temperatures when averaging January through August.
Rest of 2022
The ongoing La Niña event makes it likely that 2022 will be cooler than recent record warm years; however, 2022 is nearly certain to remain within the top eight warmest years overall.
The statistical approach that we use, looking at conditions in recent months, believes that 2022 is most likely to be the 4th or 5th warmest year in the instrumental record, with about a 85% chance of one of these outcomes. It is very unlikely (< 1%) that the remainder of 2022 warms enough for 2022 to be within the top 3 warmest years. It is also very unlikely that 2022 will be any cooler than the 8th warmest, which means that this year is very likely to still surpass all years prior to 2015.
Likelihood of final 2022 ranking:
- 1st place (< 1 %)
- Top 3 overall (< 1 %)
- 4th place (37 %)
- 5th place (48 %)
- 6th, 7th, or 8th place (15 %)
- Top 8 overall (> 99 %)
Methodology
The Berkeley Earth global temperature data set is ordinarily a combination of Berkeley Earth land surface temperature data and an interpolated ocean sea surface temperature field derived from the HadSST4 data set. The HadSST data set is built upon multiple third-party data collections of direct ocean temperature measurements from ships, buoys, and other platforms. During most of 2021, HadSST updates were frequently subject to delays of weeks or months due to delays in the third-party data sources that it relied on. Due to these delays, Berkeley Earth updates were also frequently delayed.
Due to the ongoing pattern of delays, we have taken the unusual step of preparing this monthly temperature report using an alternative set of sea surface temperature data. The data set adopted for this purpose is the sea surface temperature data from the Copernicus ERA5 reanalysis. This alternative data is only used for August 2022 during which HadSST4 is not yet available. The ERA5 data has been reprocessed to make it more similar to the resolution of our previous analysis and local anomaly baselines have adjusted to match the 1980 to 2021 period in HadSST4.
We believe that this substitute data should provide a good indication of current global ocean conditions.
However, due to difference between ERA5 and HadSST4, we do observe more small-scale variation in the data processed this way and estimates of temperature ranks for assessing local records may sometimes be unreliable in the ocean. In addition, we have increased the reported uncertainty on the ocean averages to include an estimate of the systematic differences between HadSST4 and ERA5.
Though we have adopted ERA5 ocean data for these reports in order to provide timely temperature updates, the gridded data sets appearing on the Berkeley Earth website will continue to use only HadSST as described in the associated documentation. As a result, updates to some of the gridded data sets are likely to continue to be delayed.