
| Land | |||
| Temperature Anomaly | 1.258C | 0.066 (+-) | Relative to 1951-1980 |
| Temperature Anomaly | 1.810C | 0.119 (+-) | Relative to 1850-1900 |
| Anomaly Rank since 1850 | 36 out of 2002 | range: 30 – 50 | Any 1 month period |
| Anomaly Rank since 1850 | 3 out of 167 | range: 2 – 5 | Same 1 month period |
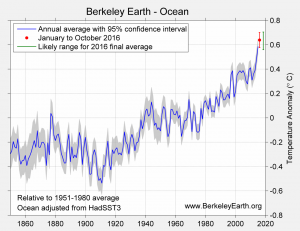
| Ocean | |||
| Temperature Anomaly | 0.584C | 0.067(+-) | Relative to 1951-1980 |
| Temperature Anomaly | 0.830 C | 0.095 (+-) | Relative to 1850-1900 |
| Anomaly Rank since 1850 | 16 out of 2002 | range: 8 – 29 | Any 1 month period |
| Anomaly Rank since 1850 | 2 out of 167 | range: 1 – 3 | Same 1 month period |
| Land & Ocean | |||
| Temperature Anomaly | 0.904C | 0.050C (+-) | Relative to 1951-1980 |
| Temperature Anomaly | 1.266C | 0.075C(+-) | Relative to 1850-1900 |
| Anomaly Rank since 1850 | 10 out of 2002 | range: 7-12 | Any 1 month period |
| Anomaly Rank since 1850 | 2 out of 167 | range: 2 – 2 | Same 1 month period |
Oct Extremes

| Record Low: | 0.04% |
| Extreme Low: | 0.01% |
| Very Low: | 0.40% |
| Below Average: | 7.64% |
| Near Average: | 19.99% |
| Above Average: | 44.18% |
| Very High: | 13.65% |
| Extreme High: | 6.17% |
| Record High: | 7.91% |
Time Series
Land

Ocean
Land & Ocean

Trend Maps


| Period | Trend C/decade |
| 1850-Present | 0.06 C/decade |
| 1900-Present | 0.087 C/decade |
| 1950-Present | 0.123 C/decade |
| 1970-Present | 0.179 C/decade |
| 1990-Present | .192 C/decade |