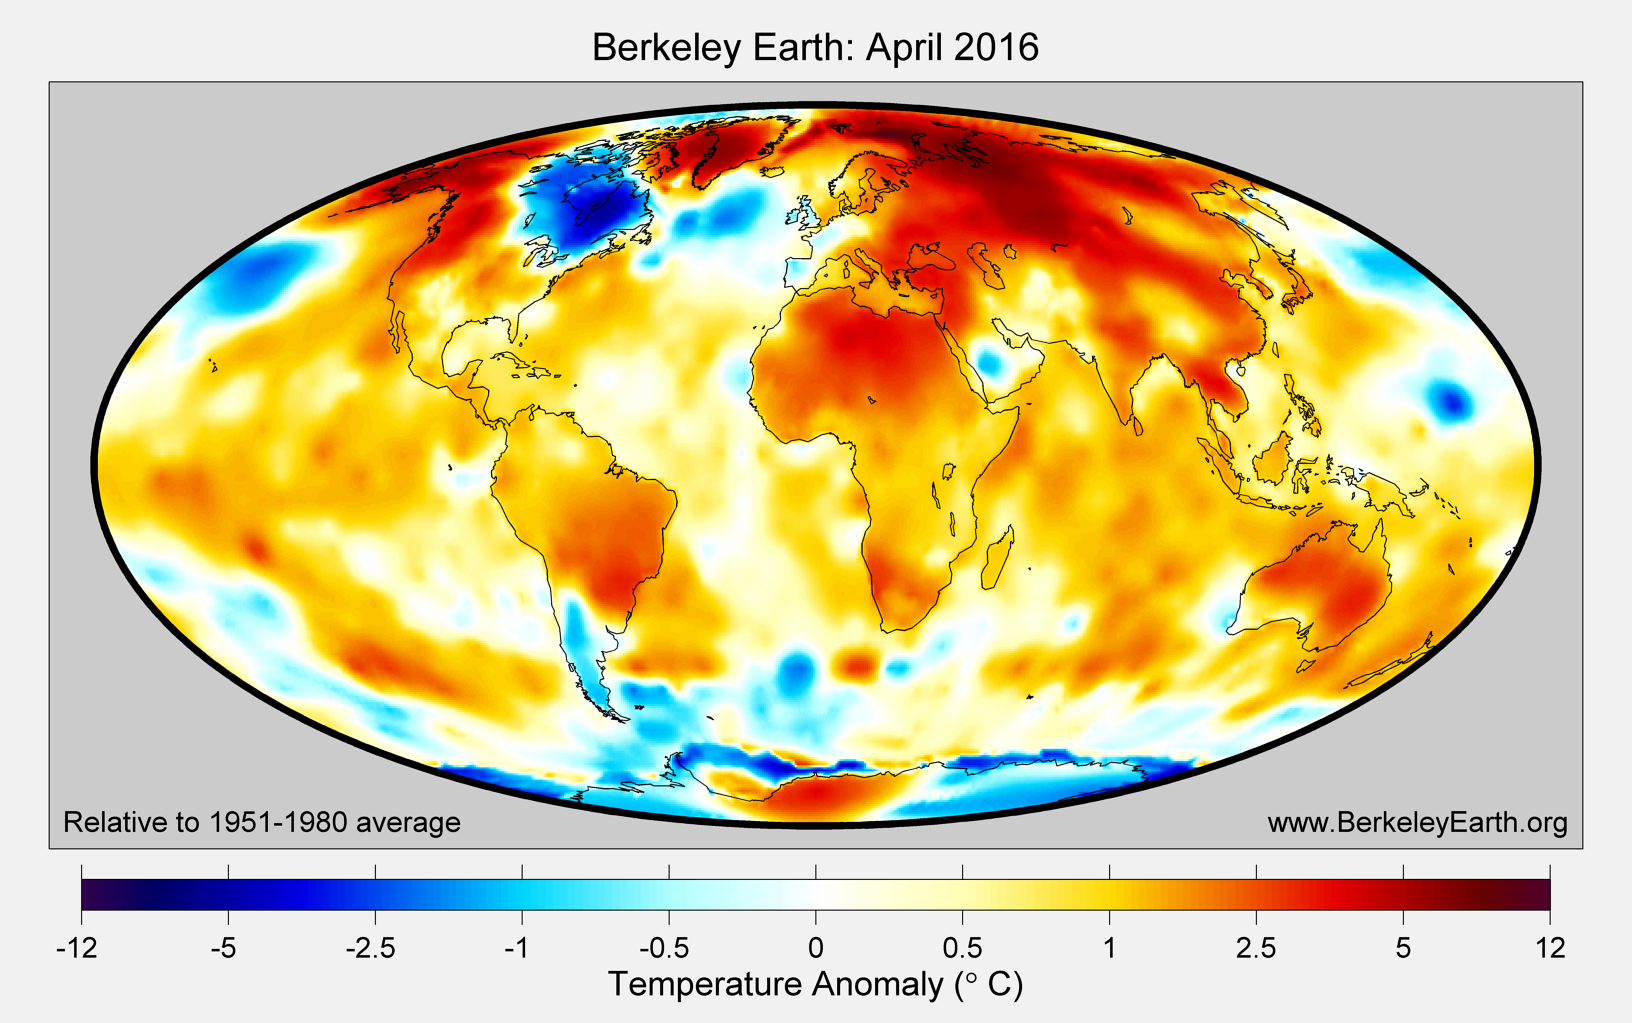
| Land | |||
| Temperature Anomaly | 1.780C | 0.100C (+-) | Relative to 1951-1980 |
| Temperature Anomaly | 2.333C | 0.166 (+-) | Relative to 1850-1900 |
| Anomaly Rank since 1850 | 5 out of 1996 | range: 4 – 6 | Any 1 month period |
| Anomaly Rank since 1850 | 1 out of 167 | range: 1 – 1 | Same 1 month period |
| Ocean | |||
| Temperature Anomaly | 0.632C | 0.077 (+-) | Relative to 1951-1980 |
| Temperature Anomaly | 0.879C | 0.107 (+-) | Relative to 1850-1900 |
| Anomaly Rank since 1850 | 10 out of 1996 | range: 2 – 17 | Any 1 month period |
| Anomaly Rank since 1850 | 1 out of 167 | range: 1 – 3 | Same 1 month period |
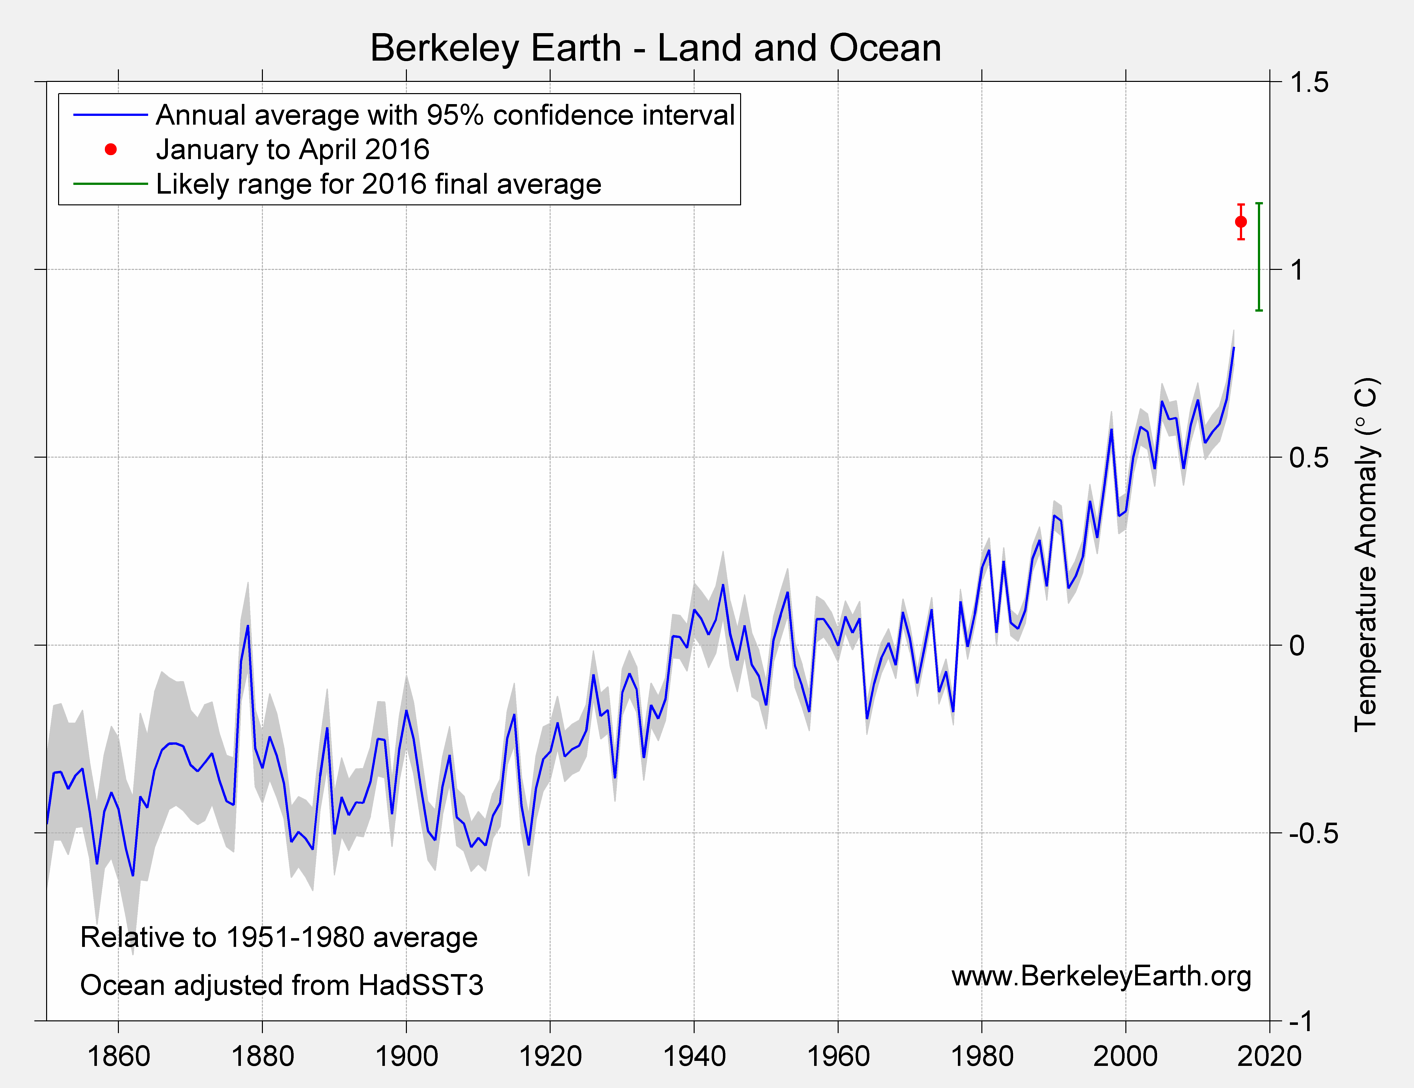
| Land & Ocean | |||
| Temperature Anomaly | 1.010C | 0.061 C (+-) | Relative to 1951-1980 |
| Temperature Anomaly | 1.372C | 0.090 (+-) | Relative to 1850-1900 |
| Anomaly Rank since 1850 | 5 out of 1996 | range: 4 – 7 | Any 1 month period |
| Anomaly Rank since 1850 | 1 out of 167 | range: 1 – 1 | Same 1 month period |
April Extremes
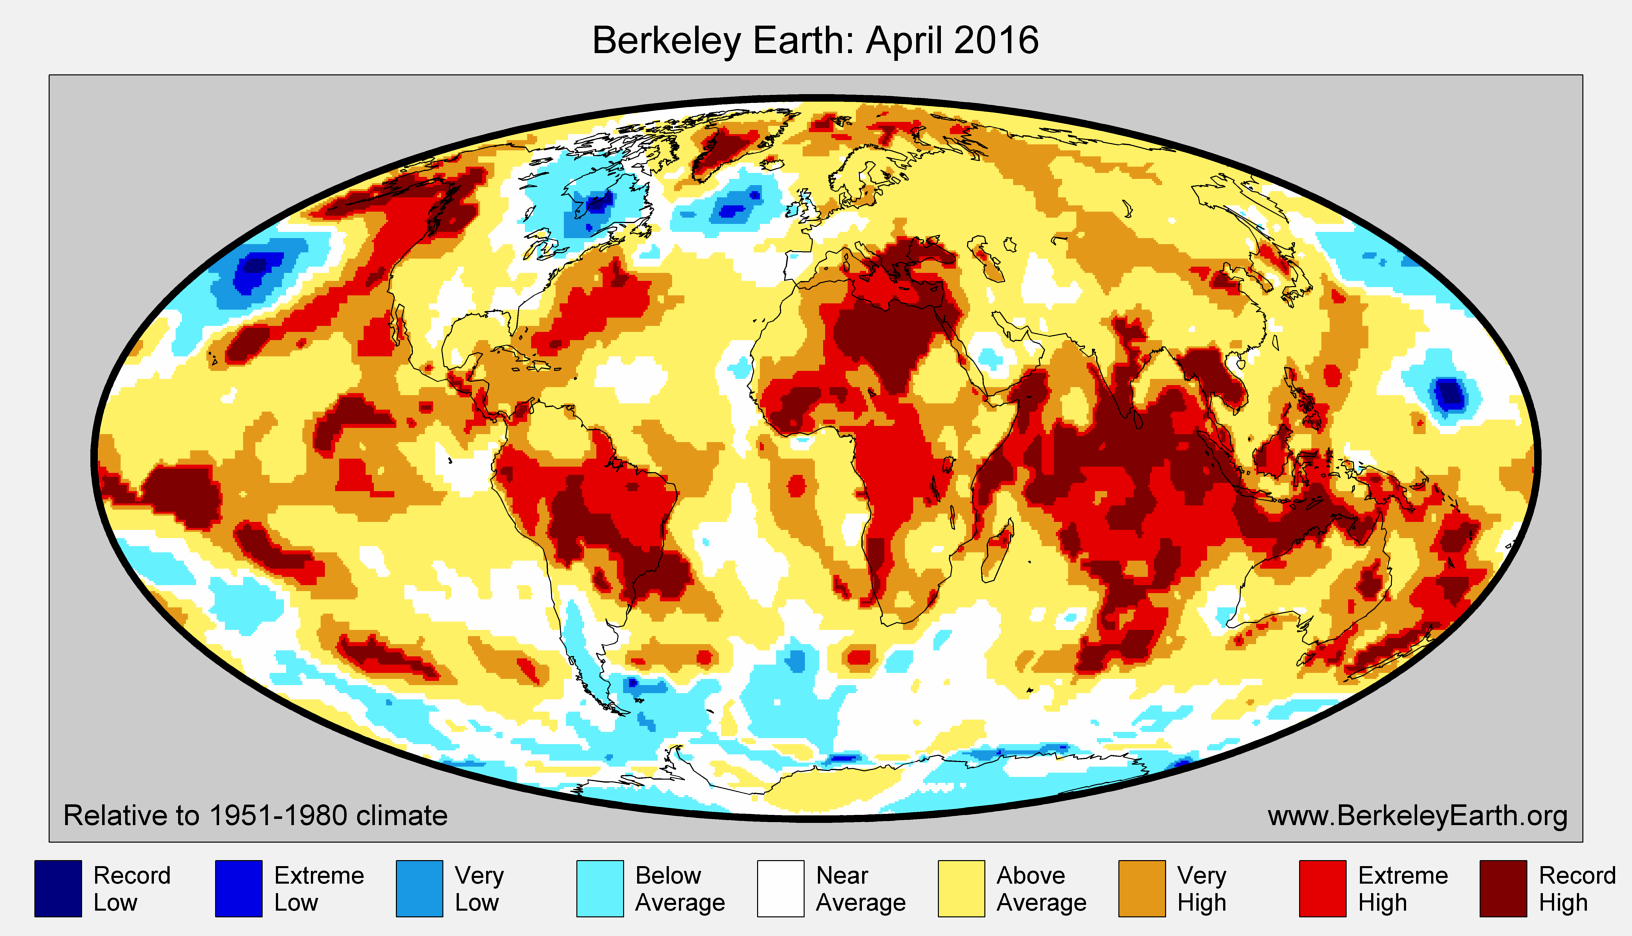
| Record Low: | 0.14% |
| Extreme Low: | 0.25% |
| Very Low: | 1.13% |
| Below Average: | 8.66% |
| Near Average: | 17.02% |
| Above Average: | 36.66% |
| Very High: | 17.92% |
| Extreme High: | 8.89% |
| Record High: | 9.33% |
Time Series
Land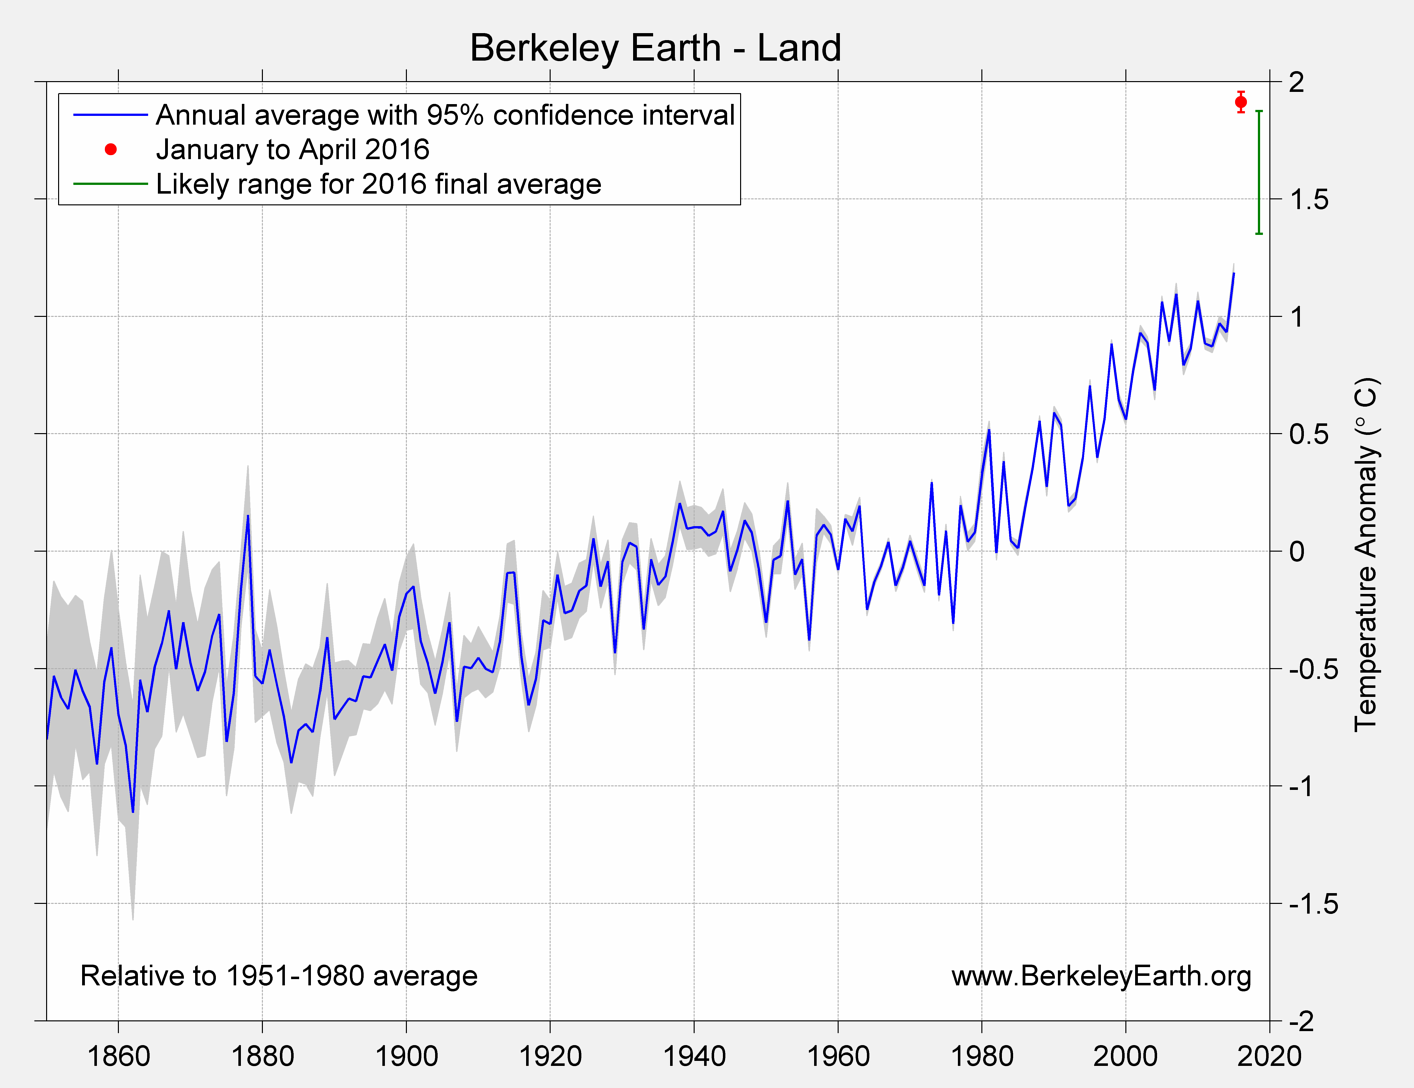
Ocean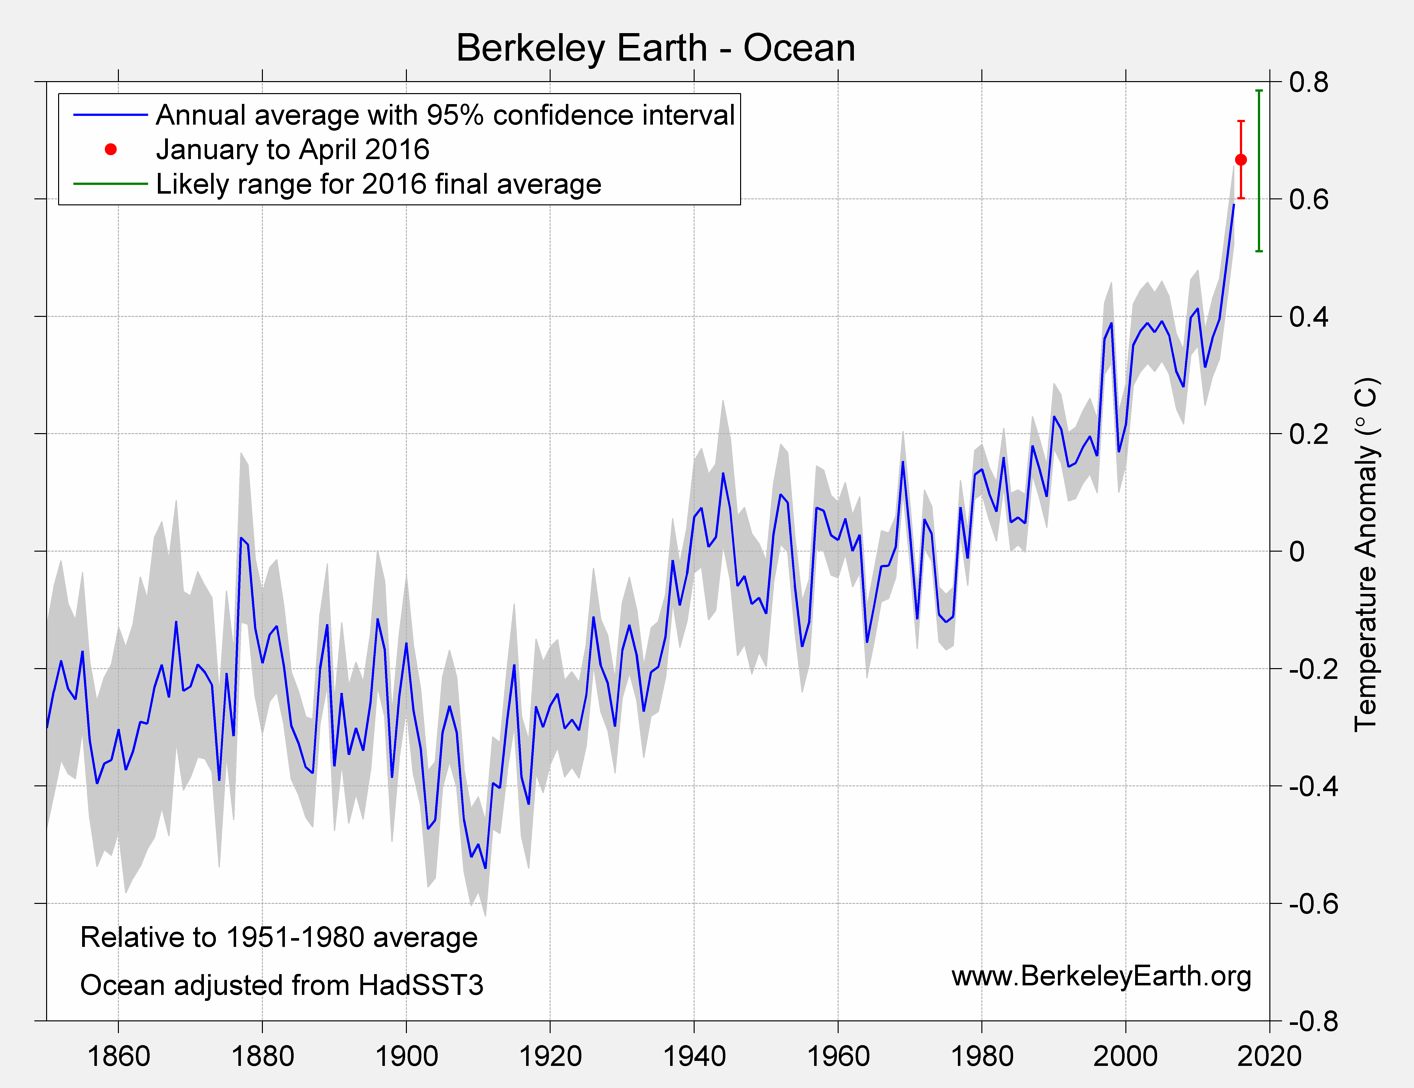
Land & Ocean
Trend Maps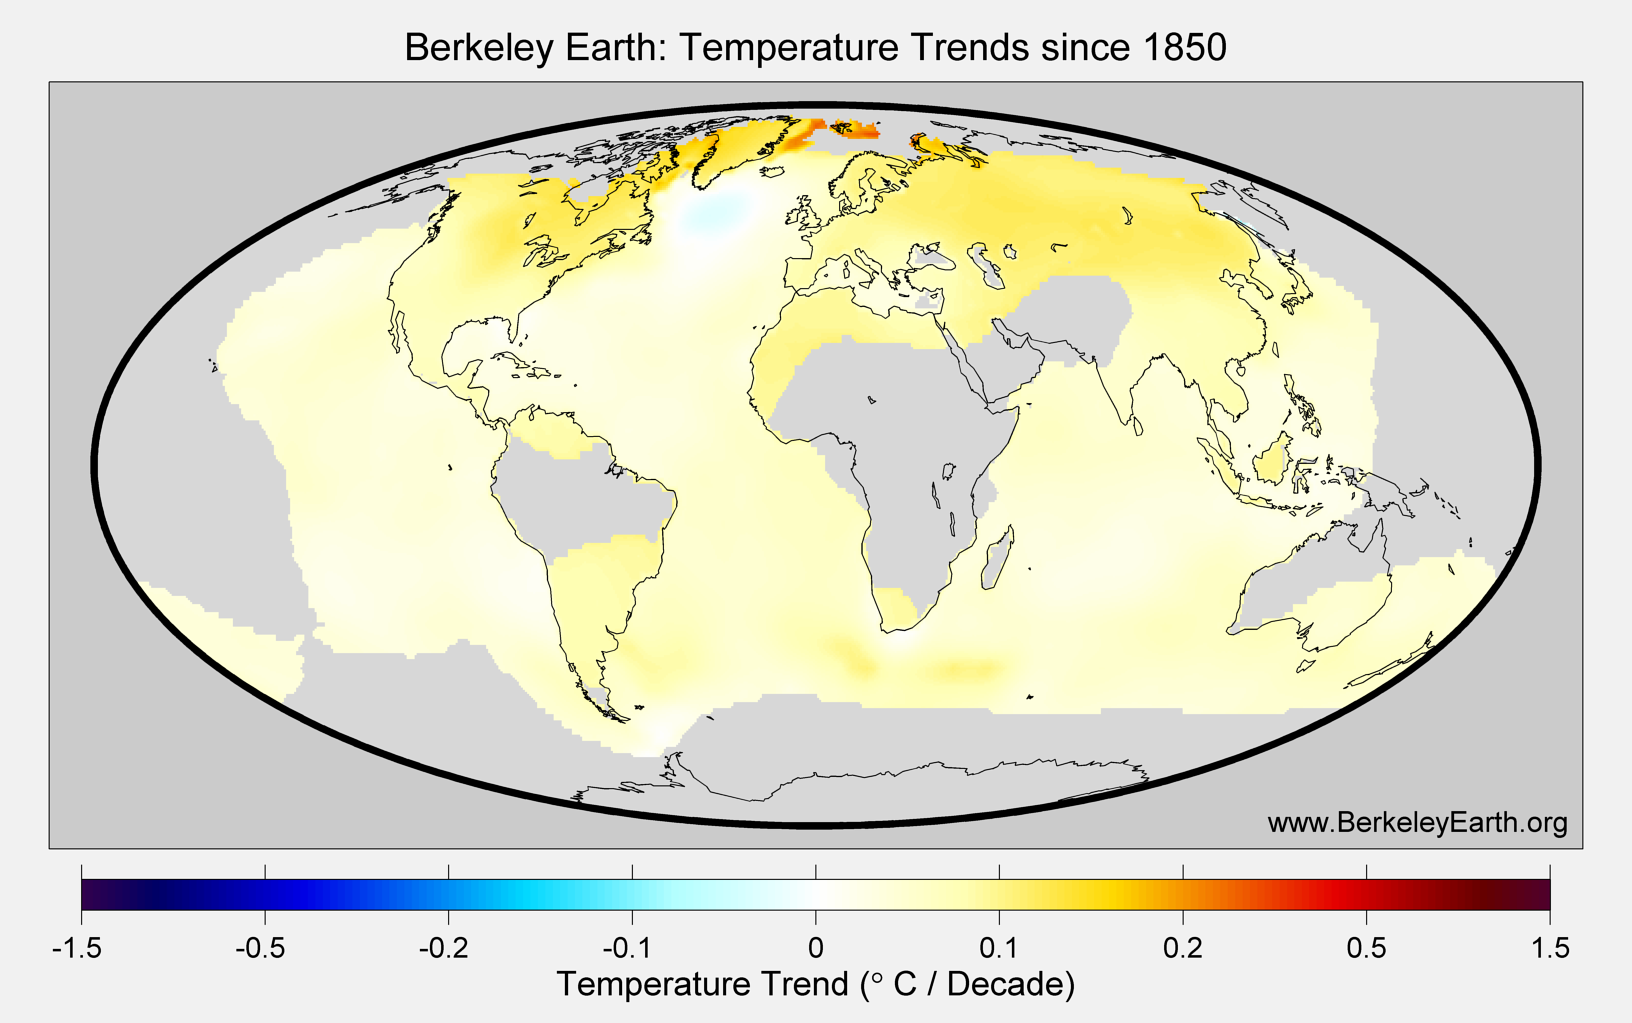
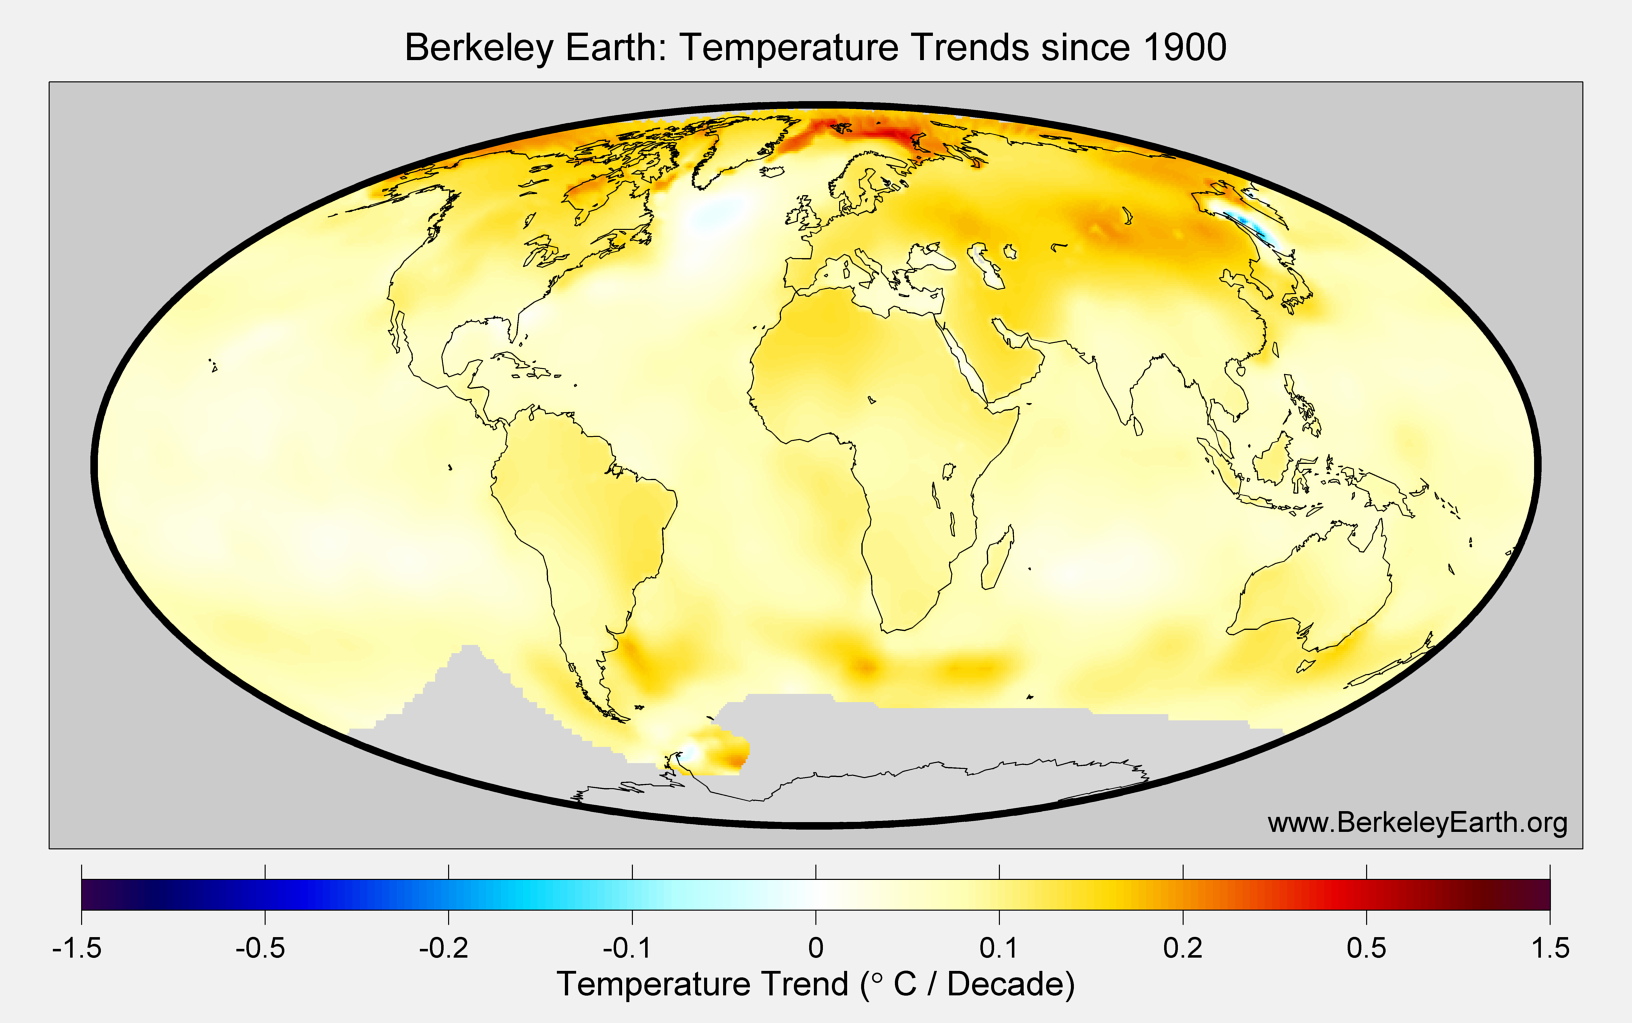
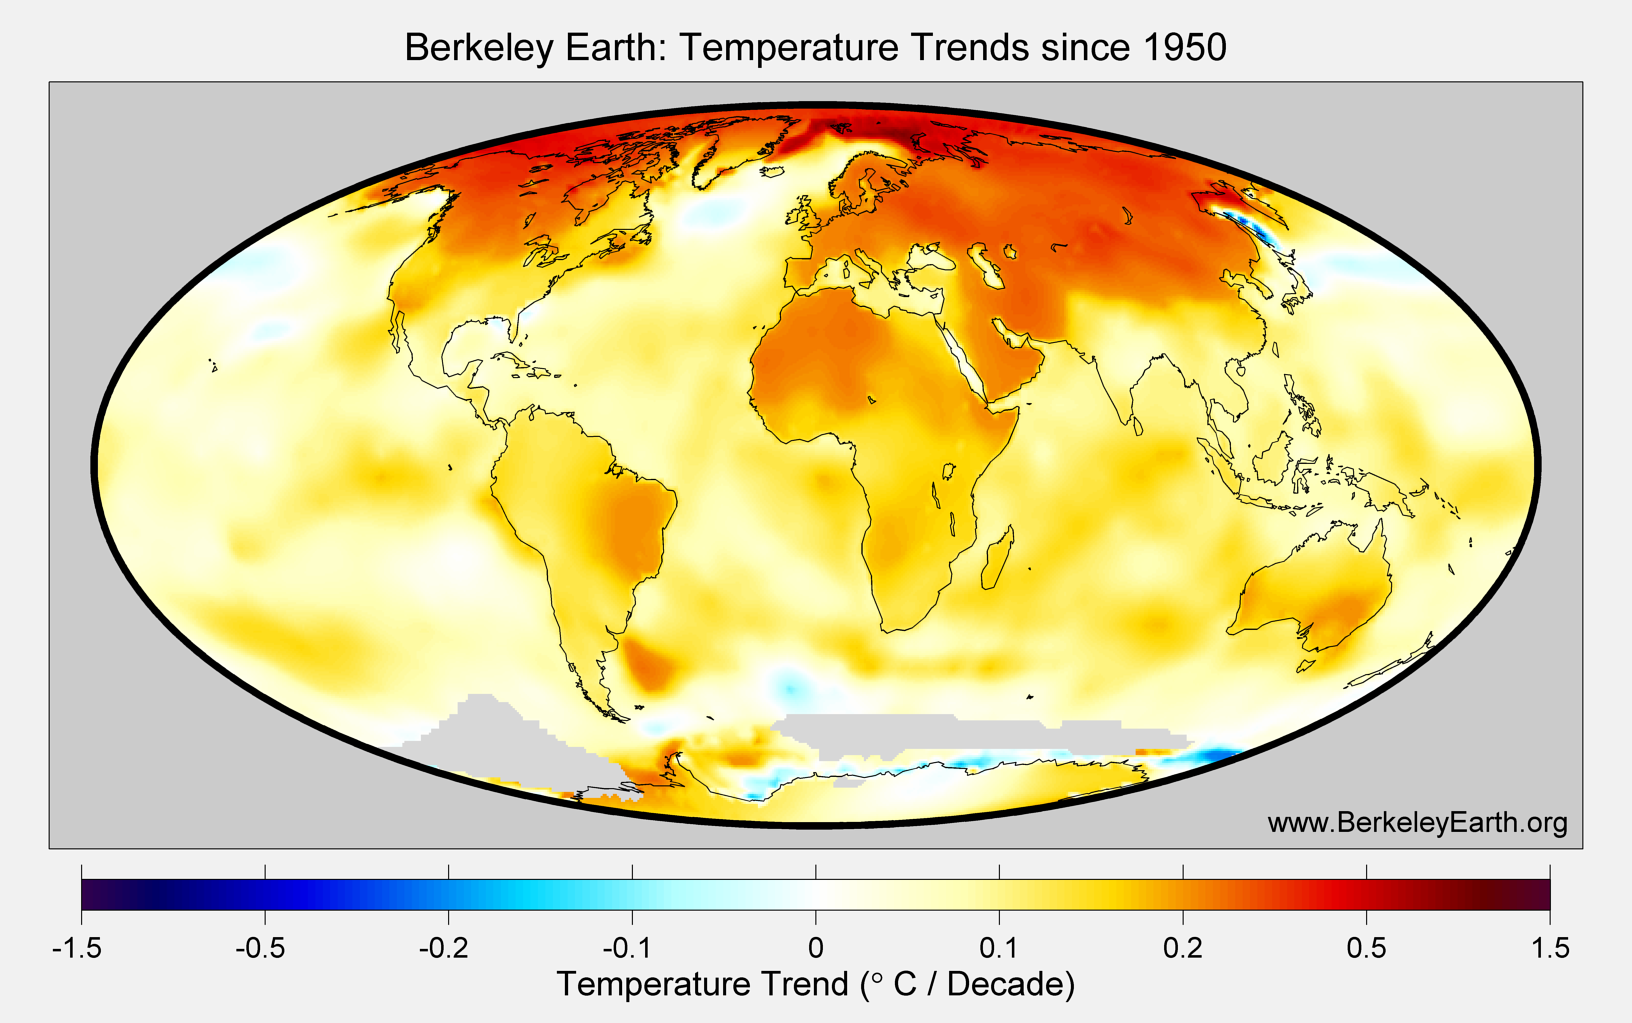
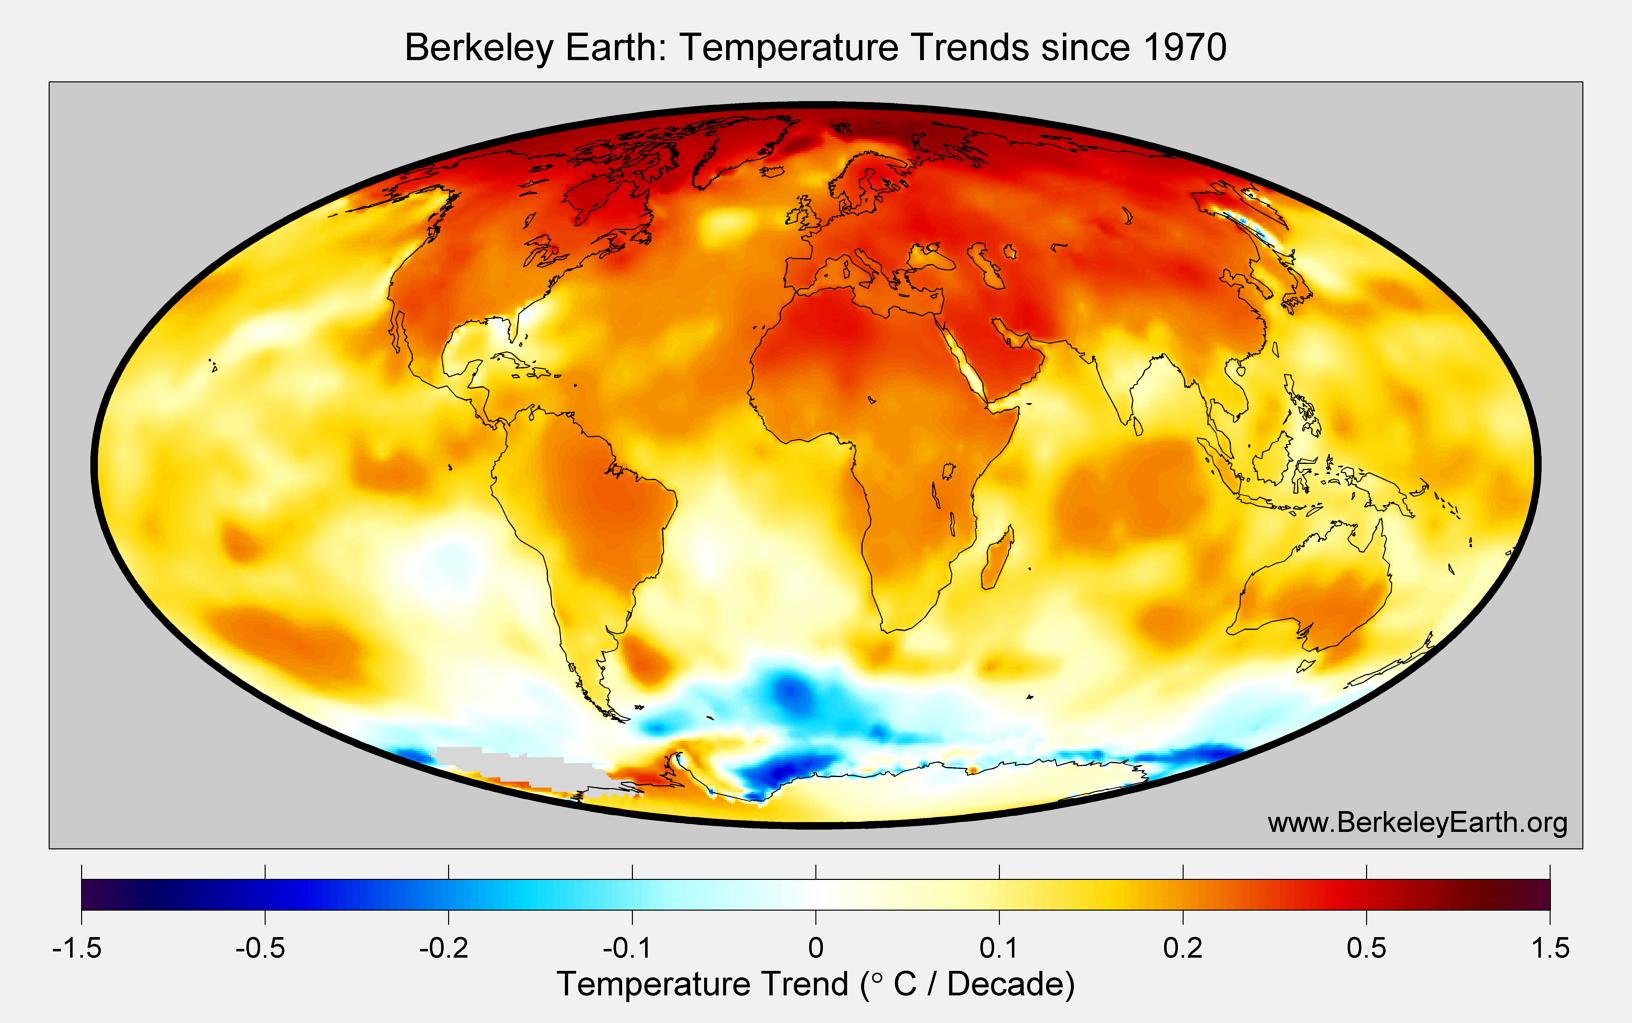
| Period | Trend C/decade |
| 1850-Present | 0.06 C/decade |
| 1900-Present | 0.086 C/decade |
| 1950-Present | 0.12 C/decade |
| 1970-Present | 0.179 C/decade |
| 1990-Present | 0.19 C/decade |
Downloads