Berkeley Earth, a California-based non-profit research organization, has been preparing independent analyses of global mean temperature changes since 2013. The following is our report on global mean temperature during 2025.
We conclude that 2025 was the third warmest year on Earth since 1850. It is exceeded only by 2024 and 2023. This period, since 1850, is the time when sufficient direct measurements from thermometers exist to create a purely instrumental estimate of changes in global mean temperature. Berkeley Earth’s analysis combines 23 million monthly-average thermometer measurements from 57,685 weather stations with ~500 million instantaneous ocean temperature observations collected by ships and buoys.
The last 11 years have included all 11 of the warmest years observed in the instrumental record, with the last 3 years including all of the top 3 warmest.
The warming spike observed in 2023 to 2025 has been extreme and suggests an acceleration in the rate of Earth’s warming. The spike has multiple causes, including both natural variability and man-made global warming from the accumulation of greenhouses gases; however, as discussed below, we believe additional factors are needed to explain the full magnitude of this event. Reductions in low cloud cover and man-made sulfur aerosol pollution are likely to have played a significant additional role in recent warming.
Over the previous 50 years, global warming has preceded in an almost linear fashion, consistent with an almost linear increase in the total greenhouse gas forcing. The warming spike in 2023 to 2025 suggests that the past warming rate is no longer a reliable predictor of the future, and additional factors have created conditions for faster warming, at least in the short-term.
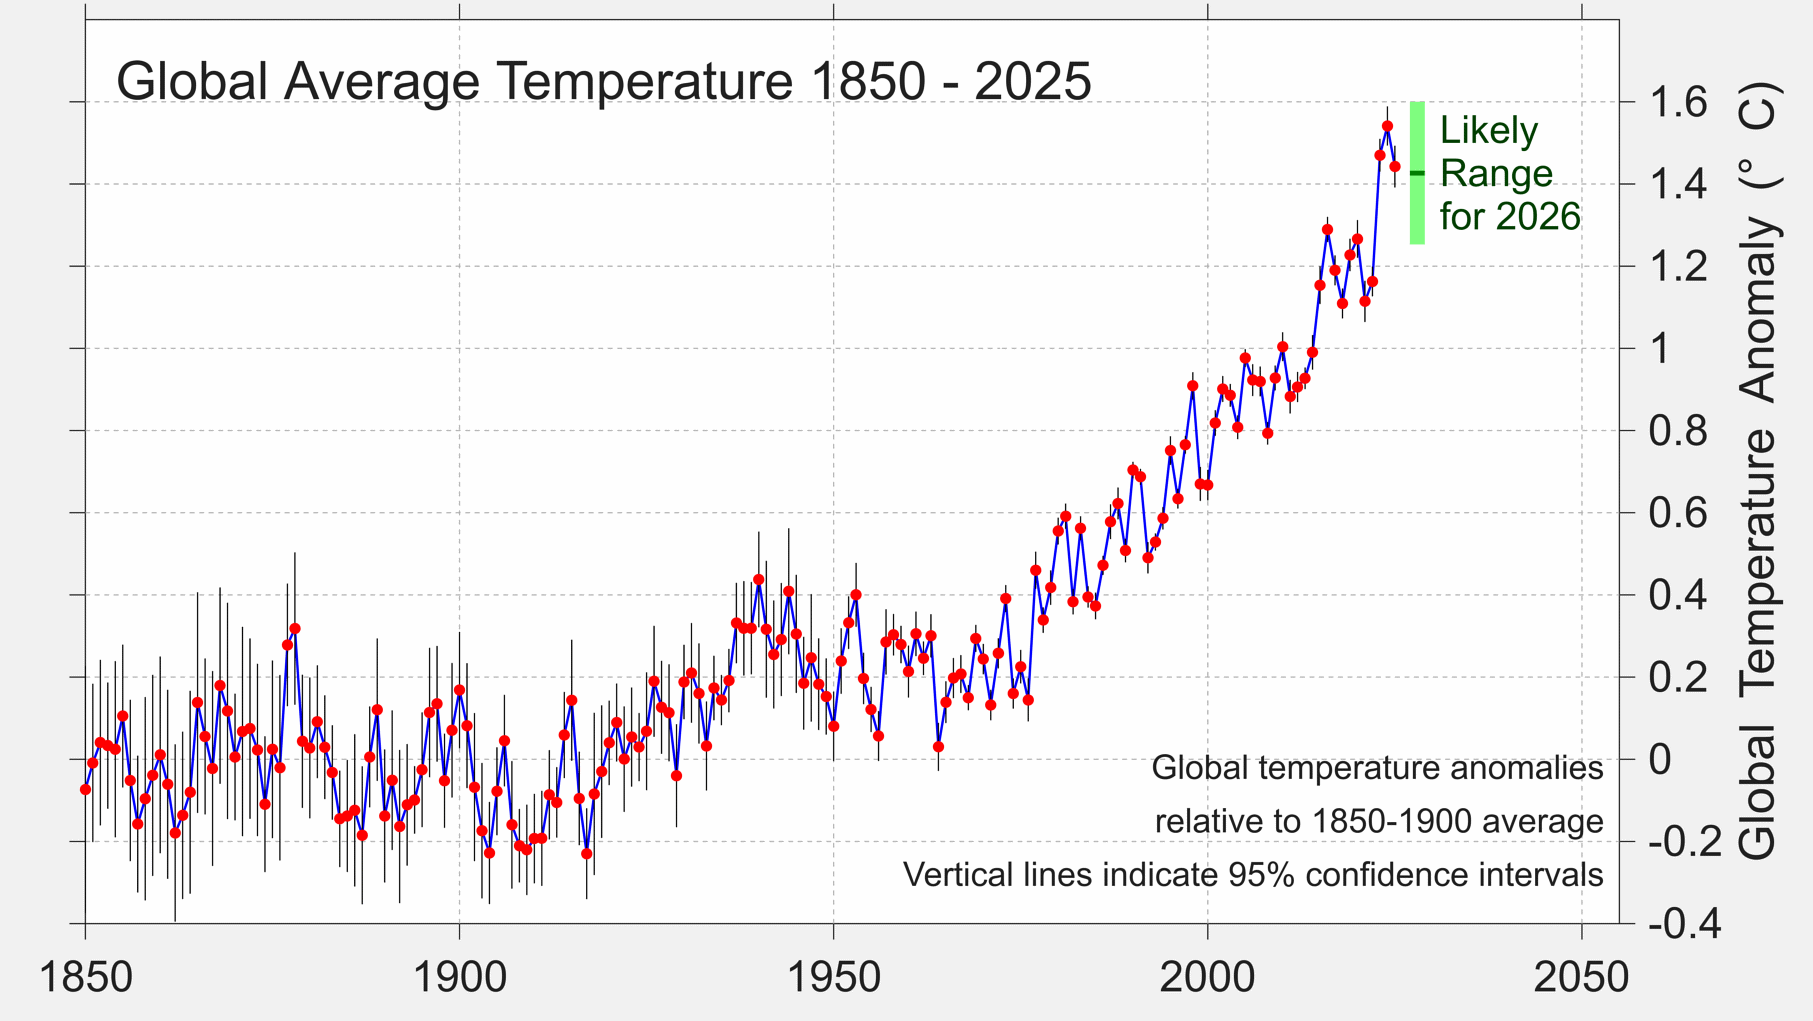
The global annual average for 2025 in the Berkeley Earth analysis is estimated as 1.44 ± 0.09 °C (2.60 ± 0.17 °F) above the average during the period 1850 to 1900, which is traditionally used a reference for the pre-industrial period.
Unlike 2023 and 2024, which were El Niño years, 2025 began and ended with a modest La Niña event. La Niña events are typically associated with modest cooling in the global mean temperature. While the Earth cooled in 2025 compared to the previous years, the anticipated cooling effect was relatively modest, at best.
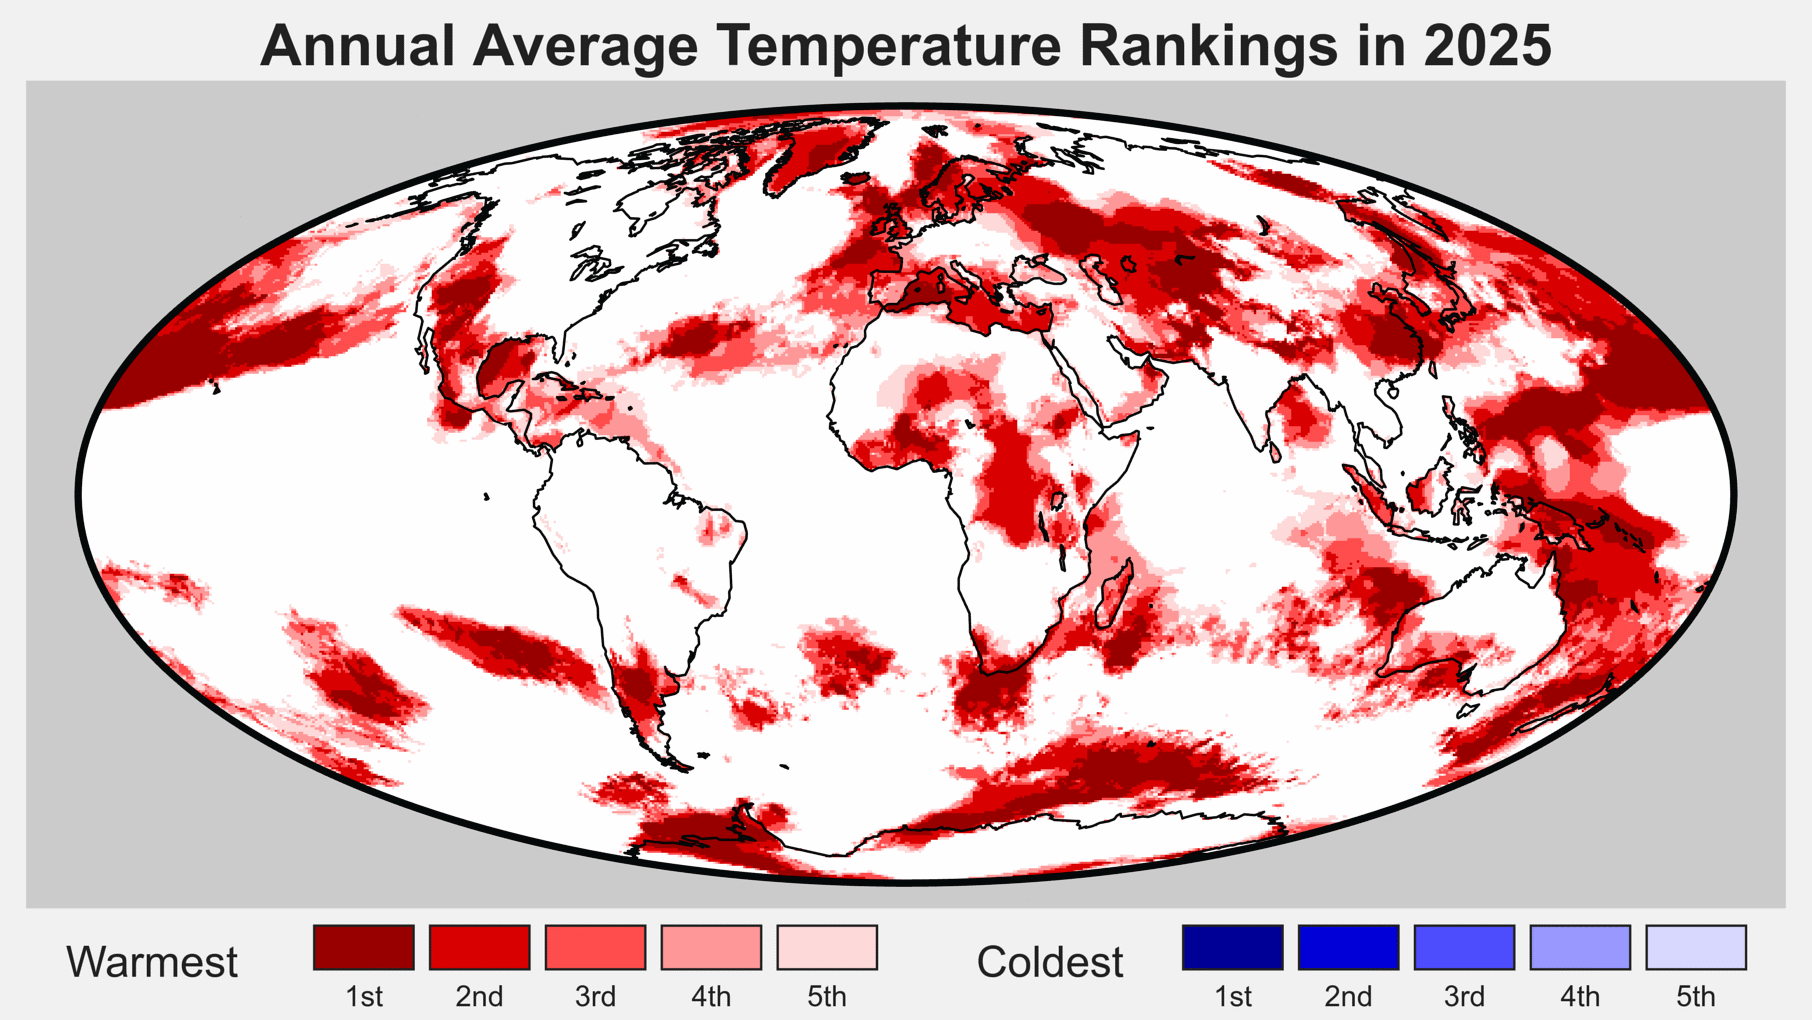
During 2025, 9.1% of the Earth’s surface had a locally record warm annual average, including 10.6% of land areas and 8.3% of ocean areas. These areas coincided with a number of major population centers. We estimate that 770 million people — 8.5% of Earth’s population — experienced a locally record warm annual average in 2025. The largest population centers affected by record warmth in 2025 were mostly in Asia, including ~450 million people in China.
None of the Earth’s surface had a record cold annual average in 2024.
Due to natural cooling patterns that have recently begun in the oceans, it is expected that 2026 will likely be similar to 2025. The most likely outcome is that 2026 ranks as roughly the 4th warmest year since 1850, though warmer or cooler outcomes are also possible. The likelihood of record warmth in 2026 is low, but can not be ruled out.
Annual Temperature Anomaly
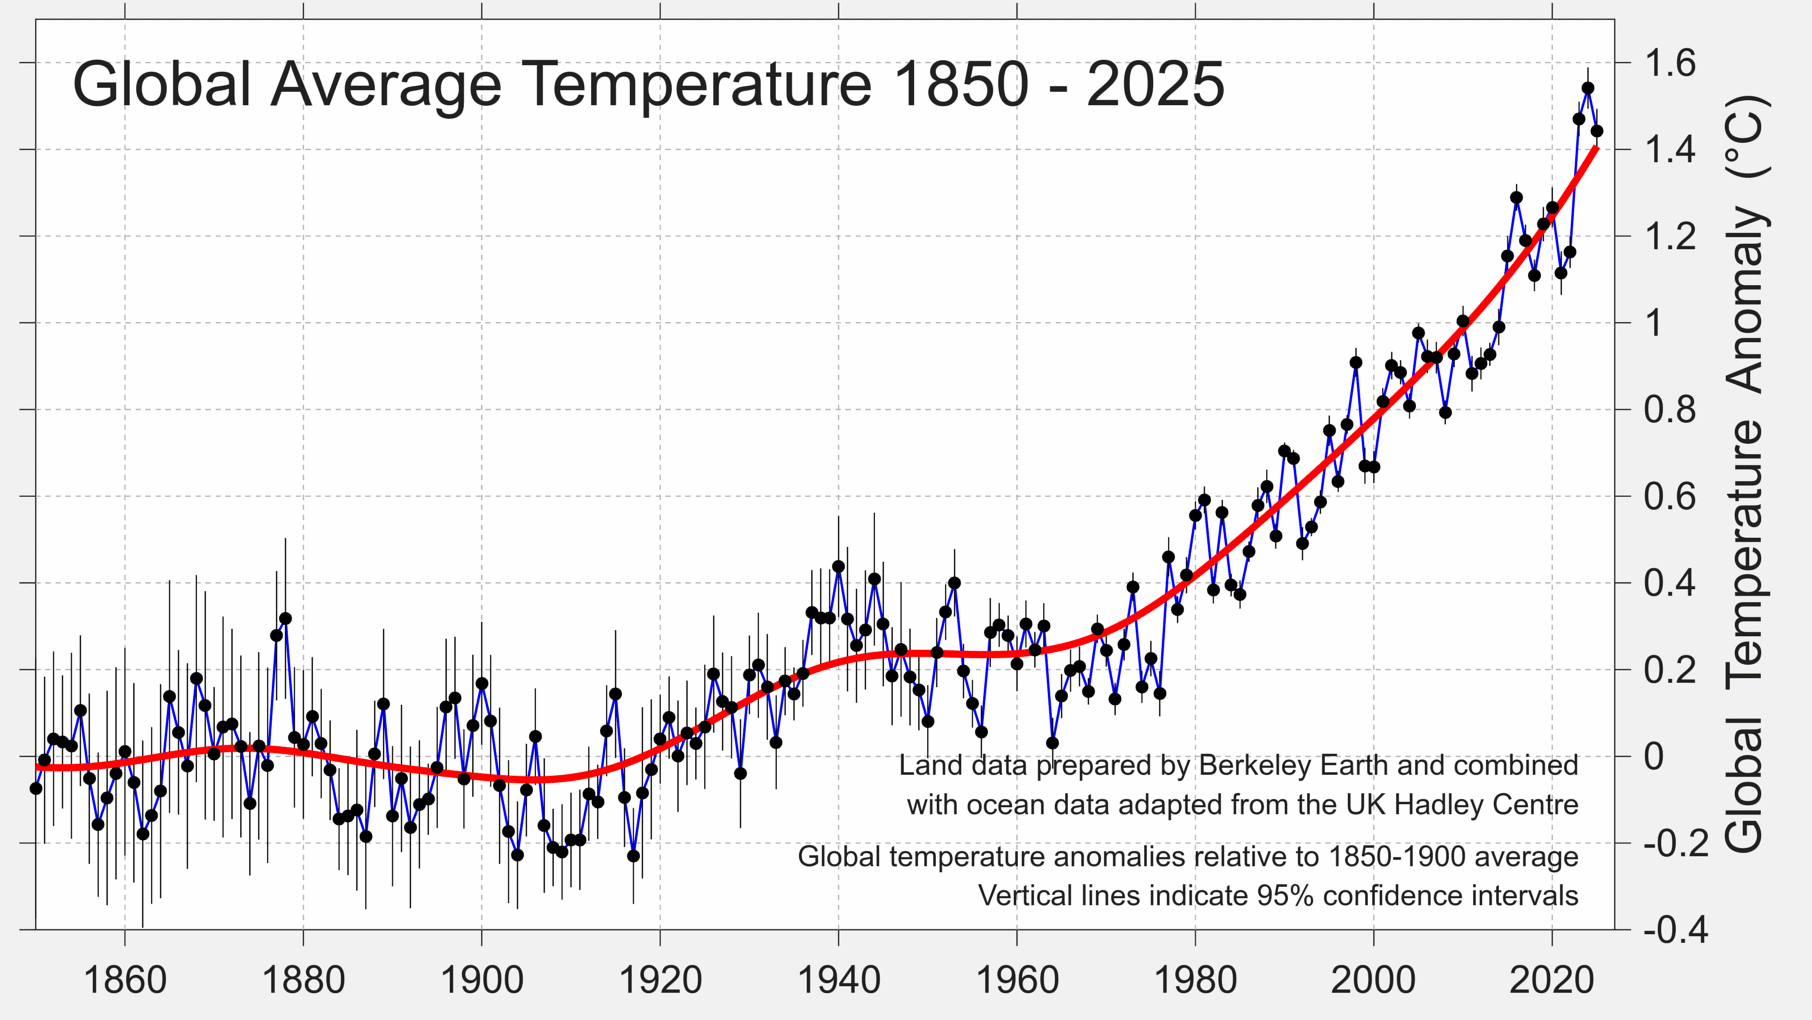
In Berkeley Earth’s analysis the global mean temperature in 2025 is estimated to have been 1.44 ± 0.09 °C (2.60 ± 0.17 °F) above the average temperature from 1850-1900, a period often used as a pre-industrial baseline for global temperature targets. This is ~0.08 °C (~0.14 °F) cooler than the previous record high observed in 2024, and also 0.03 °C (0.05 °F) cooler than 2023. As a result, 2025 is the 3rd warmest year to have been directly observed using thermometer measurements.
Though the availability of thermometers limits direct measurements to the period since 1850, indirect evidence suggests that the Earth is currently at its warmest global average temperature for at least several thousand of years, and possibly the warmest since the last interglacial ~120,000 years ago.
The last 11 years stand out as the 11 warmest years to have been directly observed.
The temperature uncertainties can be visualized using the schematic below where each year’s temperature estimate is represented by a distribution reflecting its uncertainty. In the analysis that Berkeley Earth conducts, the uncertainty on the mean temperature of a single year is approximately 0.03 °C (0.05 °F) for recent years. The global mean temperature in 2024 lies well above the previous record high set in 2023 and all other years.

The last ten years have been part of a period of significant warmth well above all previous years since 1850. This reflects the long-term trend towards man-made global warming.
Are these changes faster than expected?
Since 1970, global warming has proceeded at a roughly linear pace. This roughly linear pace has been consistent in both rate and magnitude with the expected effects of increasing greenhouse gases during this period.

However, the warming spike in 2023 to 2025 appears to have deviated significantly from the previous trend. If we were to assume that global warming was continuing at the same rate as during the 50-year period 1970-2019, then the 2023 to 2025 excursion would be by far the largest deviation from that trend, with less than a 1-in-100 chance of occurring solely due to natural variability.
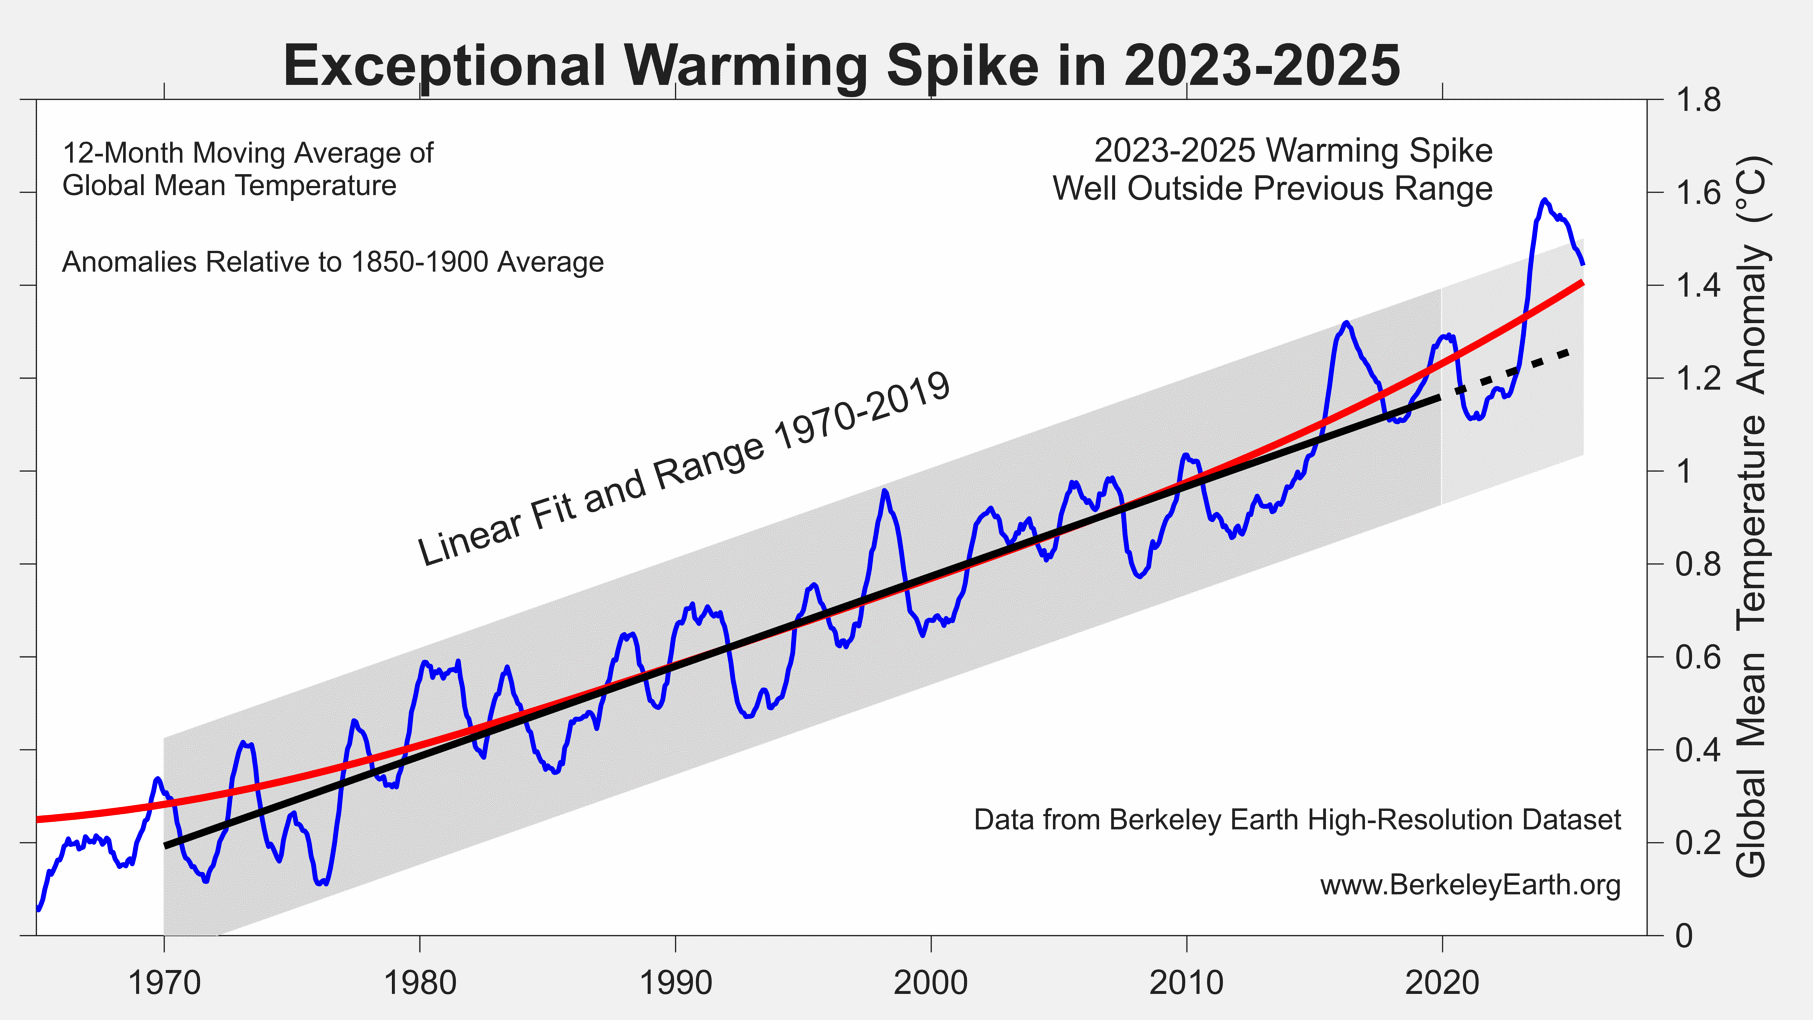
While 1-in-100 chance events do sometimes occur, we consider it more likely that the recent rate of global warming has been larger than expected, exceeding both the previous trend and what would be expected when considering only the observed pattern of greenhouse gas emissions.
As discussed below, it appears that changes in low cloud cover and reductions in man-made aerosol pollution may be responsible for additional recent warming.
Land Average Temperature in 2025
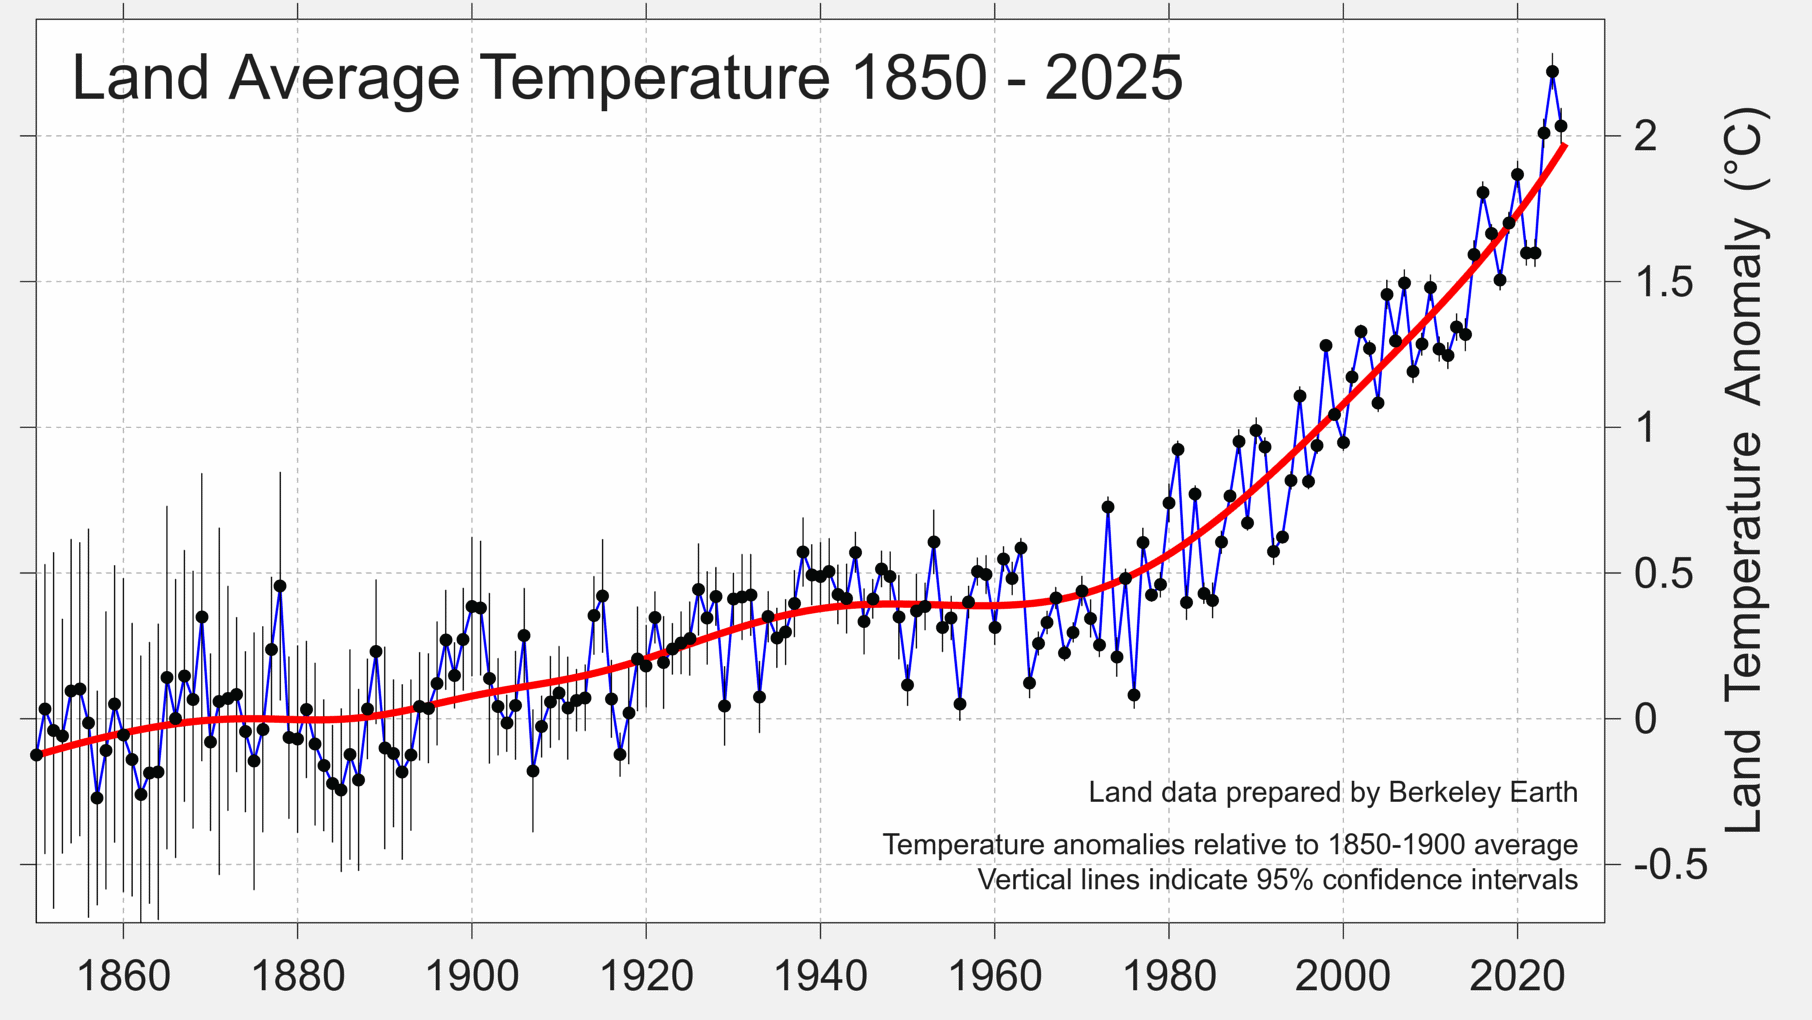
On land, 2025 was the 2nd warmest year directly observed, reaching 2.03 °C / 3.66 °F above the 1850 to 1900 average. This is the third year with a land-average of more than 2.0 °C.
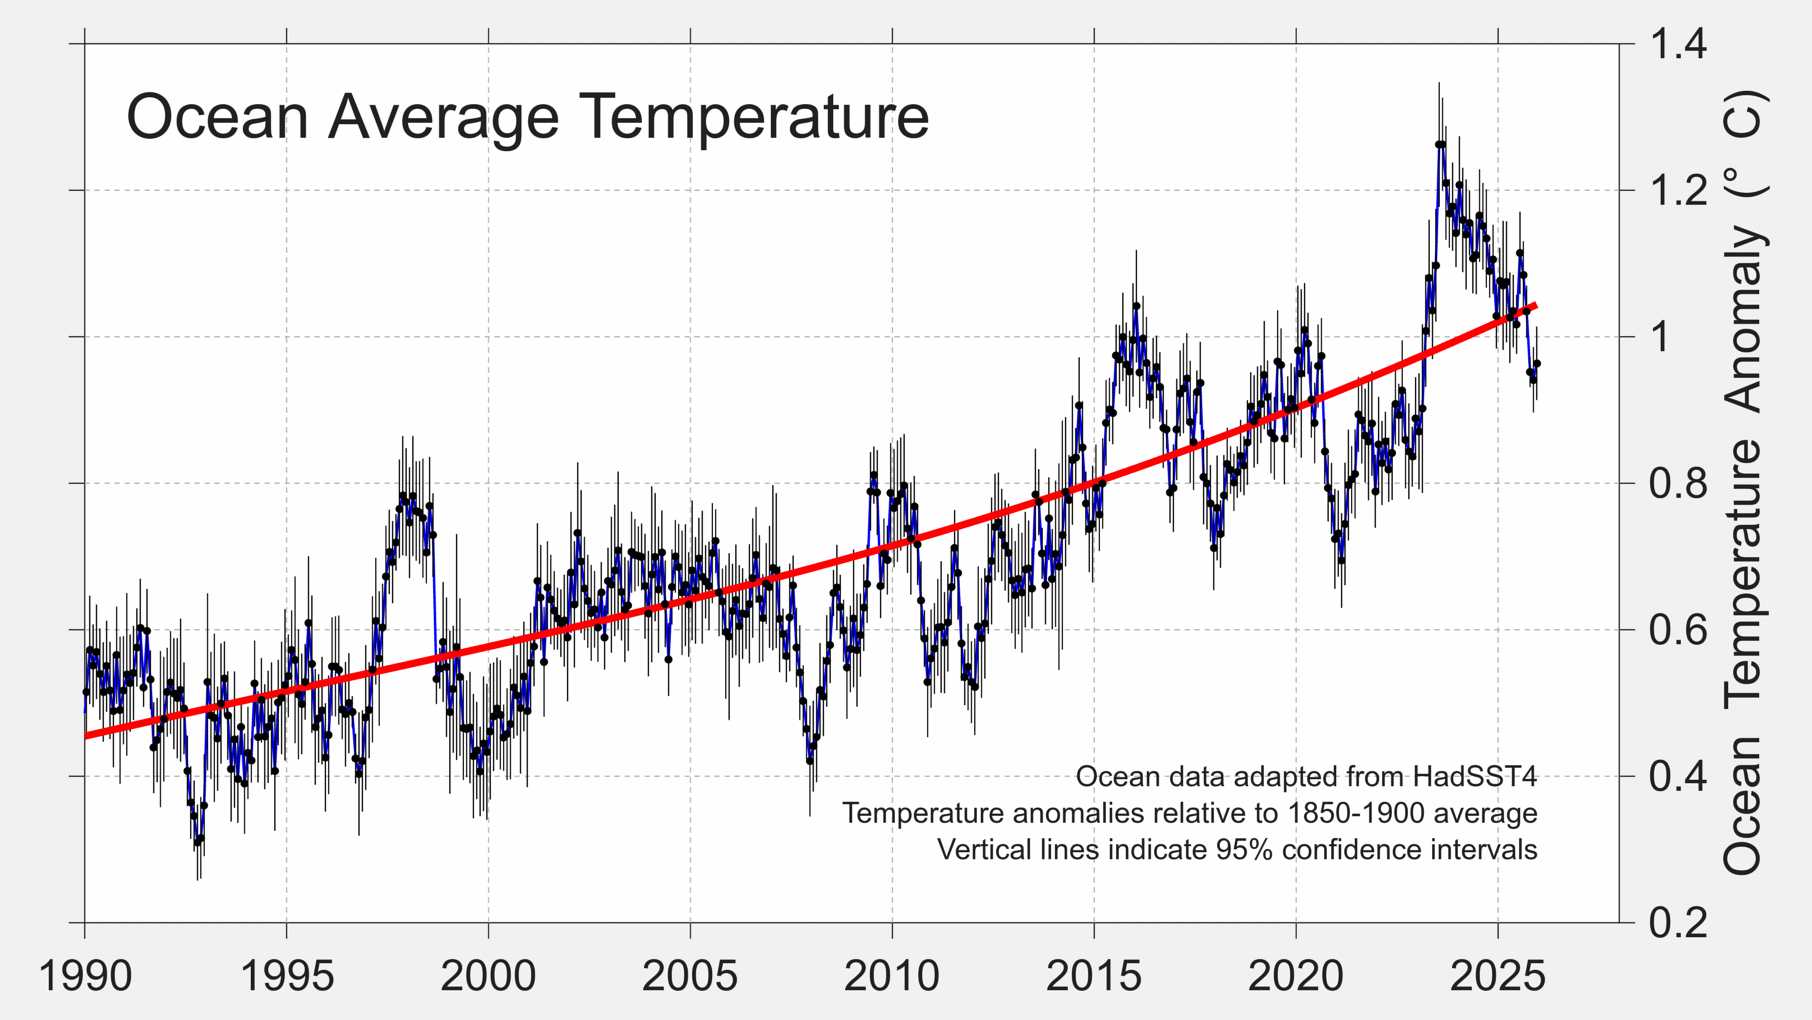
Ocean Average Temperature in 2025
On the ocean’s surface, 2025 was the 3rd warmest year directly observed, reaching 1.03 °C / 1.86 °F. This is the third year with a ocean-average above 1.0 °C, though noticeably cooler than 2023 or 2024.
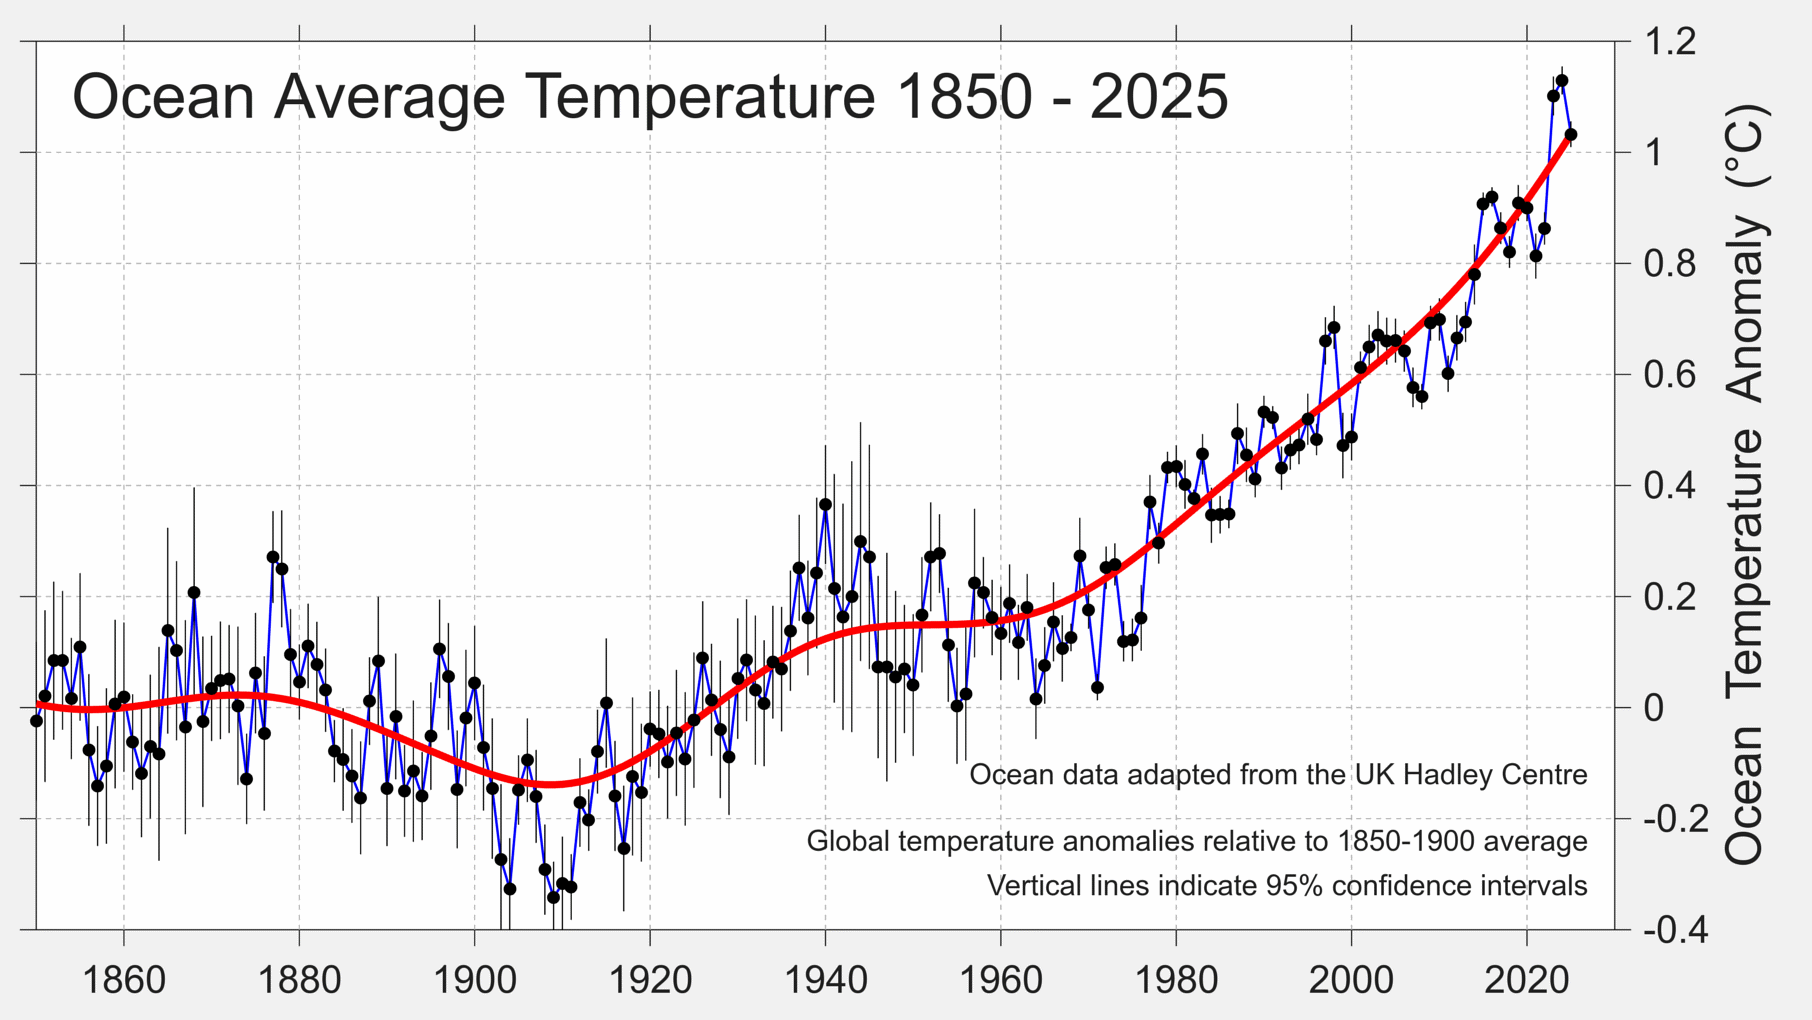
Berkeley Earth’s data for the oceans is adapted from the UK Hadley Centre’s HadSST4 data product after interpolation.
Temperature Distribution in 2025
This map shows how local temperatures in 2025 have increased relative to the average temperature in 1951-1980. Prominent warmth over Asia, Africa, North America, and South America is visible this year, as is warmth in the Atlantic, North Pacific, and Southern Ocean.
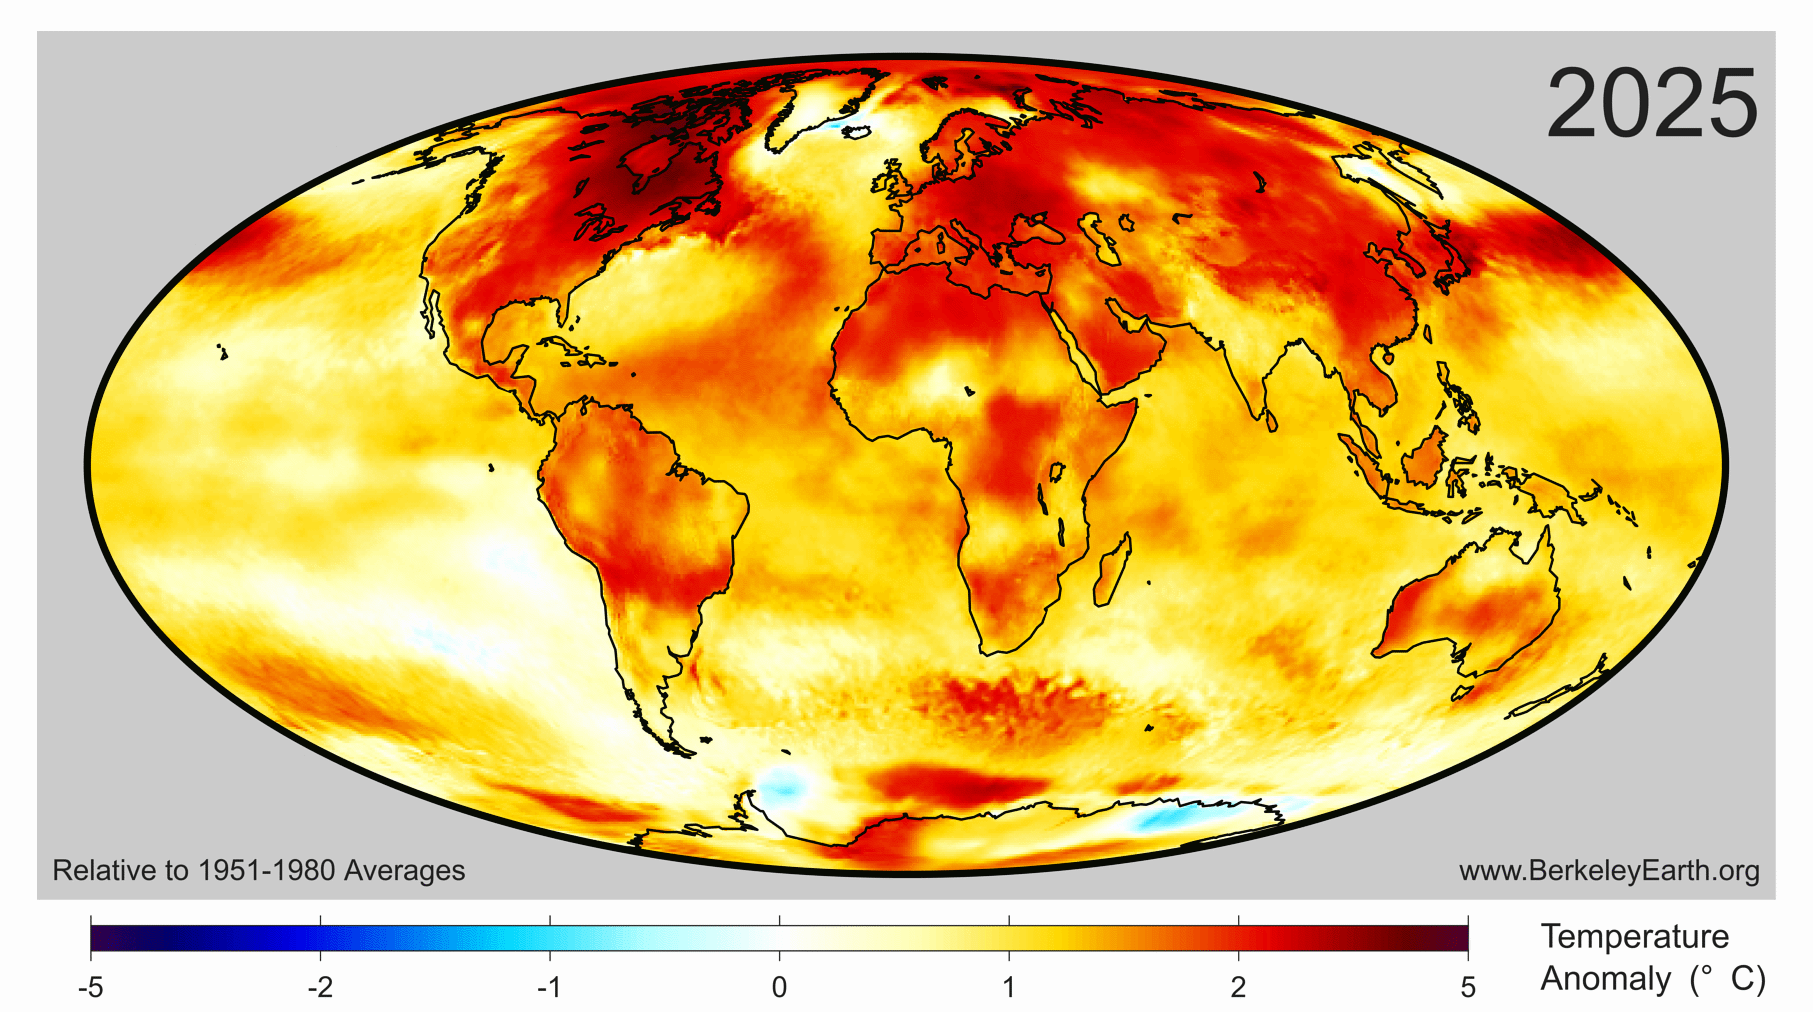
As can be expected from the global warming caused primarily by greenhouse gases, the temperature increase over the globe is broadly distributed, affecting nearly all land and ocean areas. In 2025, 97% of the Earth’s surface was significantly warmer than the average temperature during 1951-1980, 3.0% was of a similar temperature, and only 0.1% was significantly colder.
We estimate that 9.1% of the Earth’s surface set a new local record for the warmest annual average. This includes 10.6% of the land surface and 8.3% of the ocean’s surface. Particularly extreme conditions were observed over parts of Asia and the Northern Pacific Ocean.
As discussed below, these locations with record warm annual averages are home to approximately 770 million people, including particularly large population centers in Asia.
In 2025, no places on Earth experienced a record or near-record cold annual average.
Land areas generally show about twice as much warming as the ocean. When compared to the 1850-1900 averages, the land average in 2025 has increased 2.03 ± 0.17 °C (3.66 ± 0.32 °F) and the ocean surface temperature, excluding sea ice regions, has increased 1.03 ± 0.05°C (1.86 ± 0.09 °F). Most of this warming has occurred since 1970.
The following figure shows land and ocean temperature changes relative to the average from 1850 to 1900. The tendency for land averages to increase more quickly than ocean averages is clearly visible.
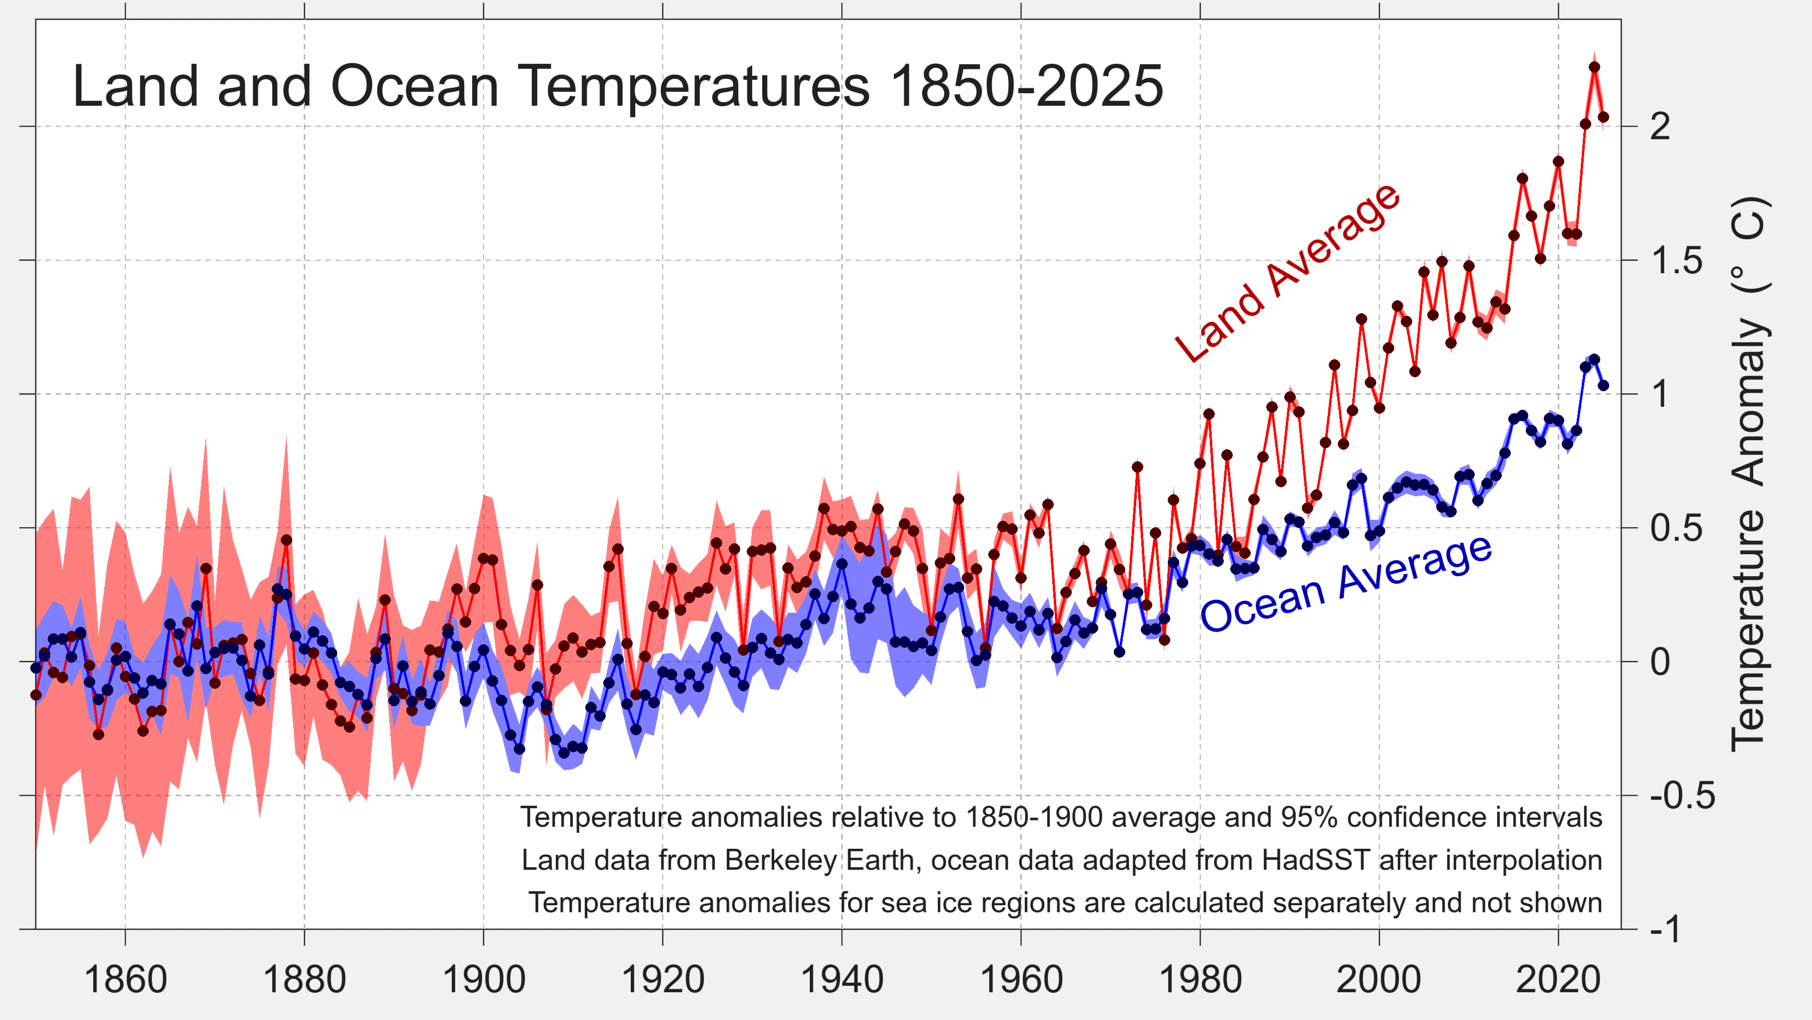
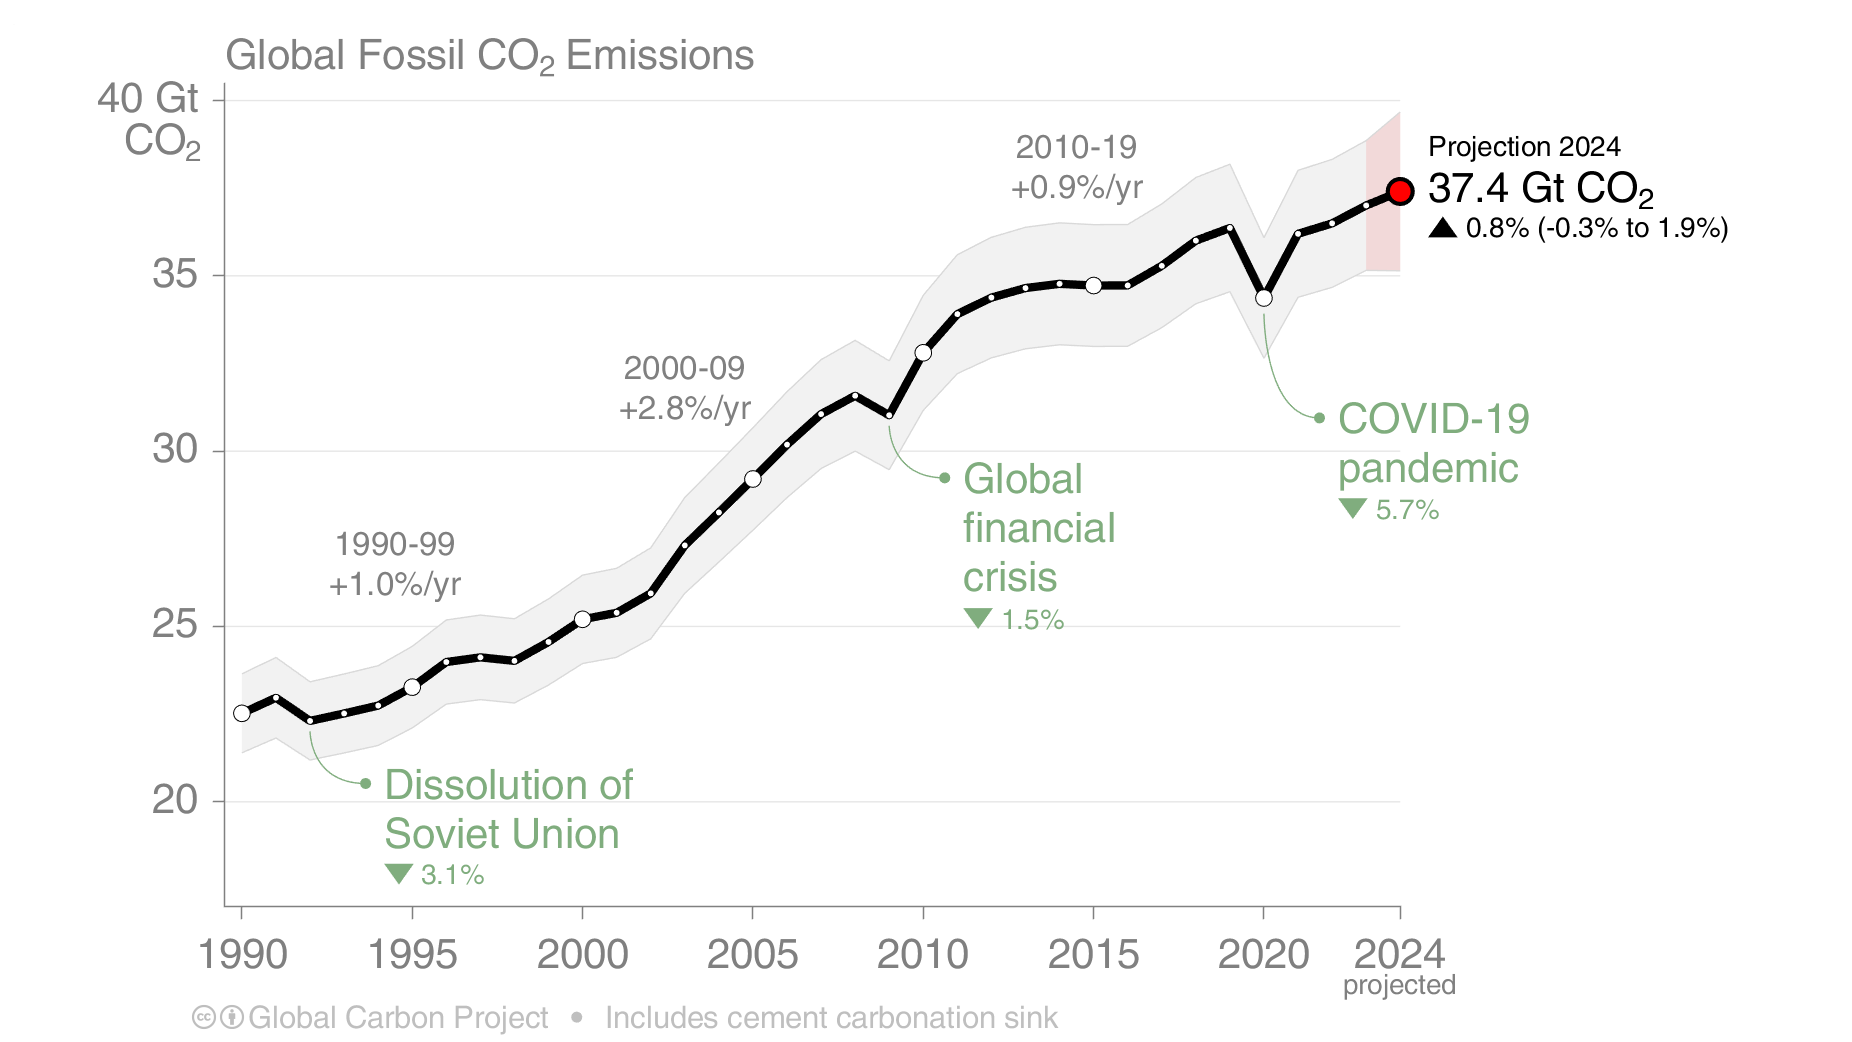
Both the tendency for land to warm faster than ocean and the higher rate of warming over the Arctic are expected based on the understanding of how increases in greenhouse gas concentrations will impact the Earth’s climate. As has been reported by the Global Carbon Project and other observers, 2025 saw a new record for the level of carbon dioxide in the atmosphere. This is due to the continued accumulation of carbon dioxide from human activities. The annual amount of carbon dioxide emitted in 2025 was 1.1% higher than 2024 and set a new all-time high.
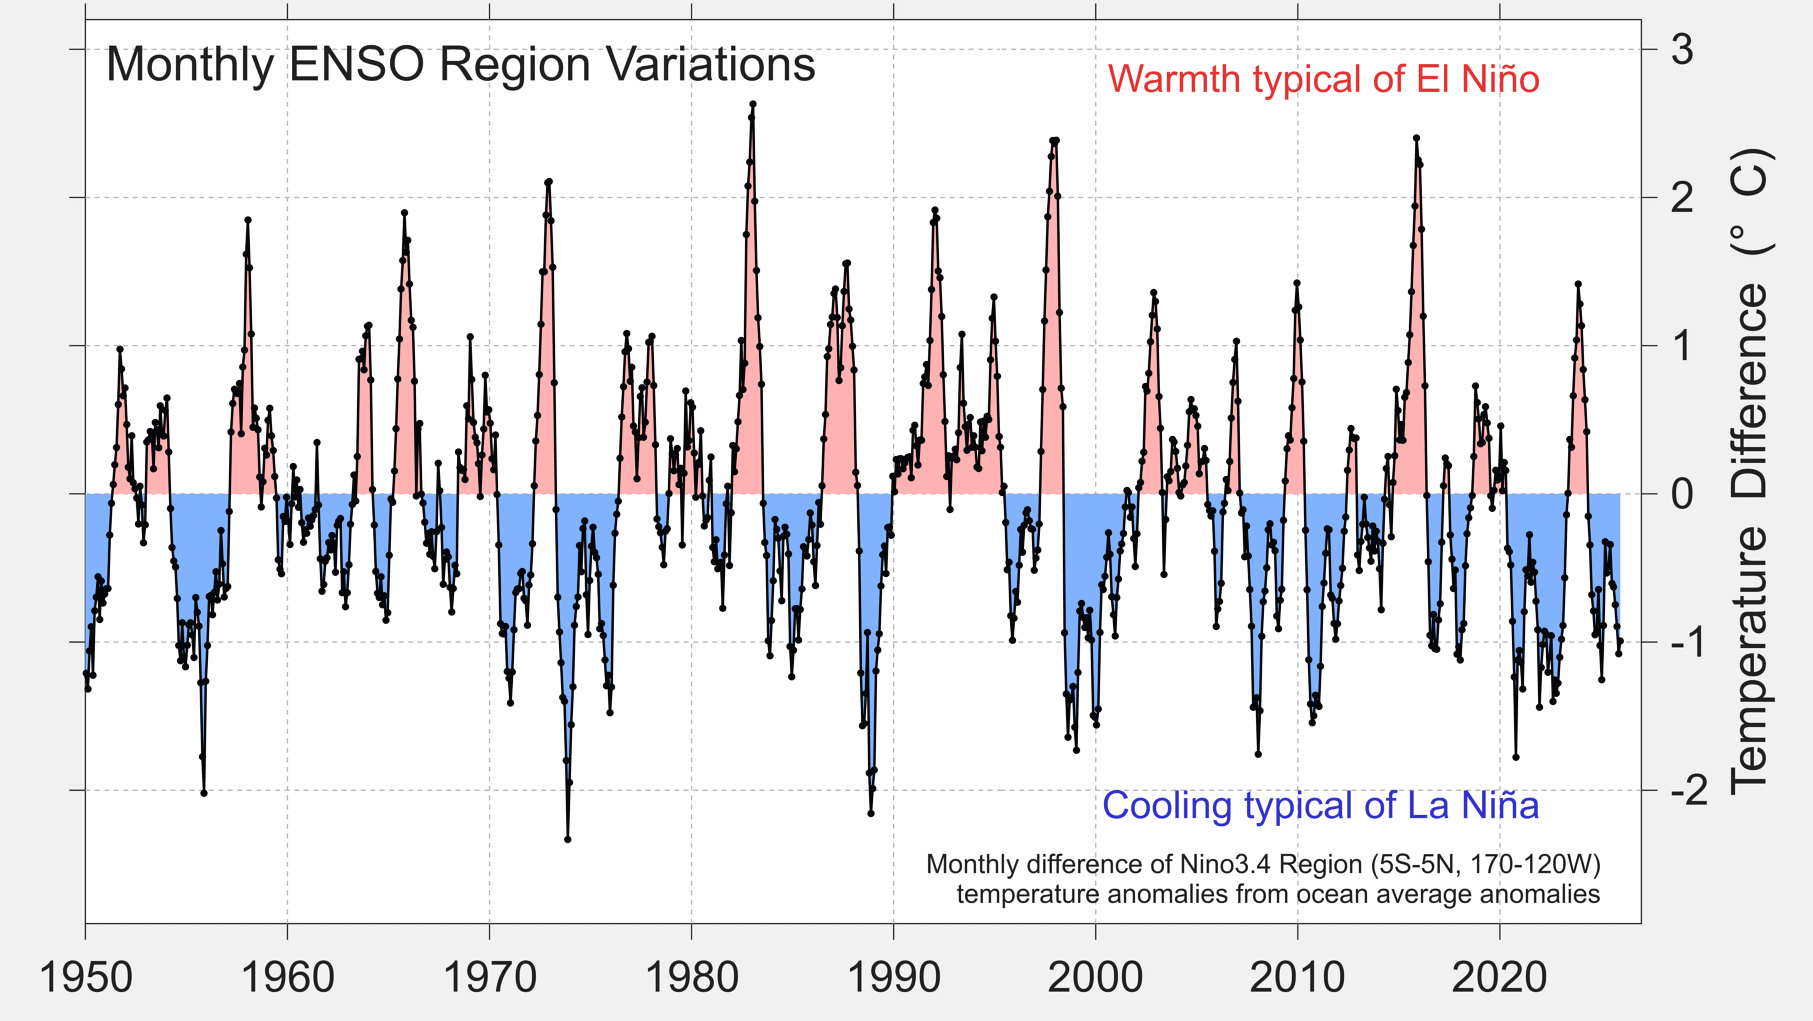
Return of La Niña
The emergence of the El Niño weather phenomenon in the middle of 2023 had a significant influence on temperatures during both 2023 and 2024, and is likely the largest short-term contributor to the 2023/2024 temperature spike. This El Niño peaked just before the end of 2023 and ended in June 2024. Central Pacific Ocean cooling continued during the rest of 2024. A new La Niña began in January 2025 but was weaked and short-lived. Neutral conditions persisted for a few months in mid 2025 before dipping back into a weak La Niña state at the end of the year.
La Niña is characterized by the emergence of a large area of relatively cool water in the eastern equatorial Pacific. In addition to the immediate cooling in the Pacific, La Niña can have far-reaching effects on global circulation and weather patterns. This disruption of weather patterns tends to be associated with an extended period of somewhat decreased global average temperatures that can last for months beyond the peak of the La Niña in the Pacific. Its counterpart, El Niño, is associated with relative warming the Pacific and somewhat increases global average temperatures.
Prior to 2023, the equatorial Pacific maintained La Niña conditions since mid-2020. This long-lived La Niña contributed to making 2021 and 2022 relatively cooler than other previous years. By contrast, the rapid transition from a La Niña at the start on 2023 to a strong El Niño by the end of 2023, contributed to the temperature records observed in 2023 and 2024. However, so far, the return to La Niña in 2025 has brought only relatively modest cooling. This is sufficient to help 2025 be cooler than 2024 and 2023, but has not pushed global averages below the long-term trend line.
National Average Temperature
Though the focus of our work is on global and regional climate analysis, it is also possible to use our data to estimate national temperature trends.
In Berkeley Earth’s estimation, 2025 had the warmest nationwide annual averages since instrumental records began in the following 16 countries:
Benin, Burundi, Cameroon, Central African Republic, Comoros, Democratic Republic of the Congo, Ghana, Jamaica, Kyrgyzstan, Mexico, Nigeria, Rwanda, Togo, Uganda, United Republic of Tanzania, Vietnam.
This is a major retreat from 2024 when 104 countries set new records.
This list of countries having record warmth in 2025 is estimated from Berkeley Earth’s gridded high resolution temperature data set. Due to uncertainties and methodological differences, national weather agencies may give slightly different estimates of temperatures in 2025. In some cases, this may cause disagreements over whether a record national average was truly reached in 2025.
Looking at the specific cities and sub-national locations where record annual averages occurred, we estimate that approximately 770 million people — 8.5% of Earth’s population — live in places that observed their locally warmest annual average during 2025. This was concentrated mostly in Asia, and includes 1/3 of the population of China (~450 million people), as well as significant populations in Russia, Kazakhstan, Uzbekistan, and Pakistan. Outside of Asia, 1/2 the population of Chile, 1/4 of the population of South Africa, and 1/5 the population of the United Kingdom also live in areas experiencing a record warm annual average in 2025.
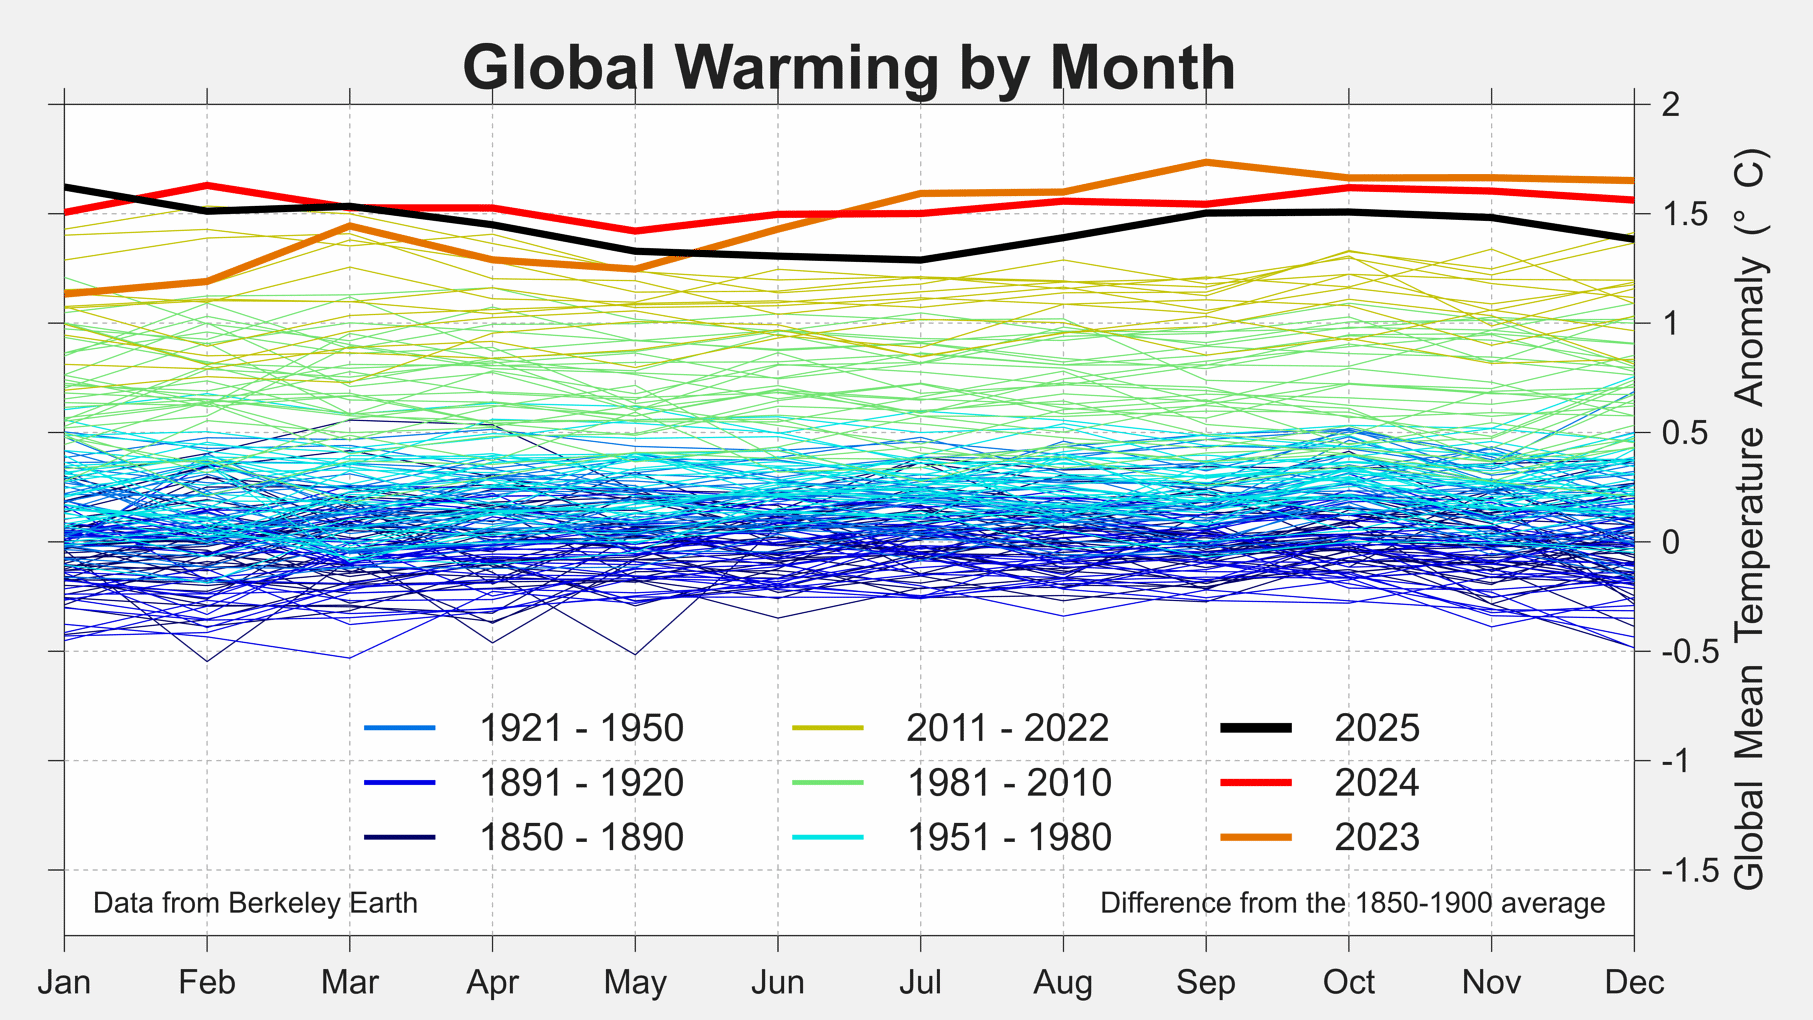
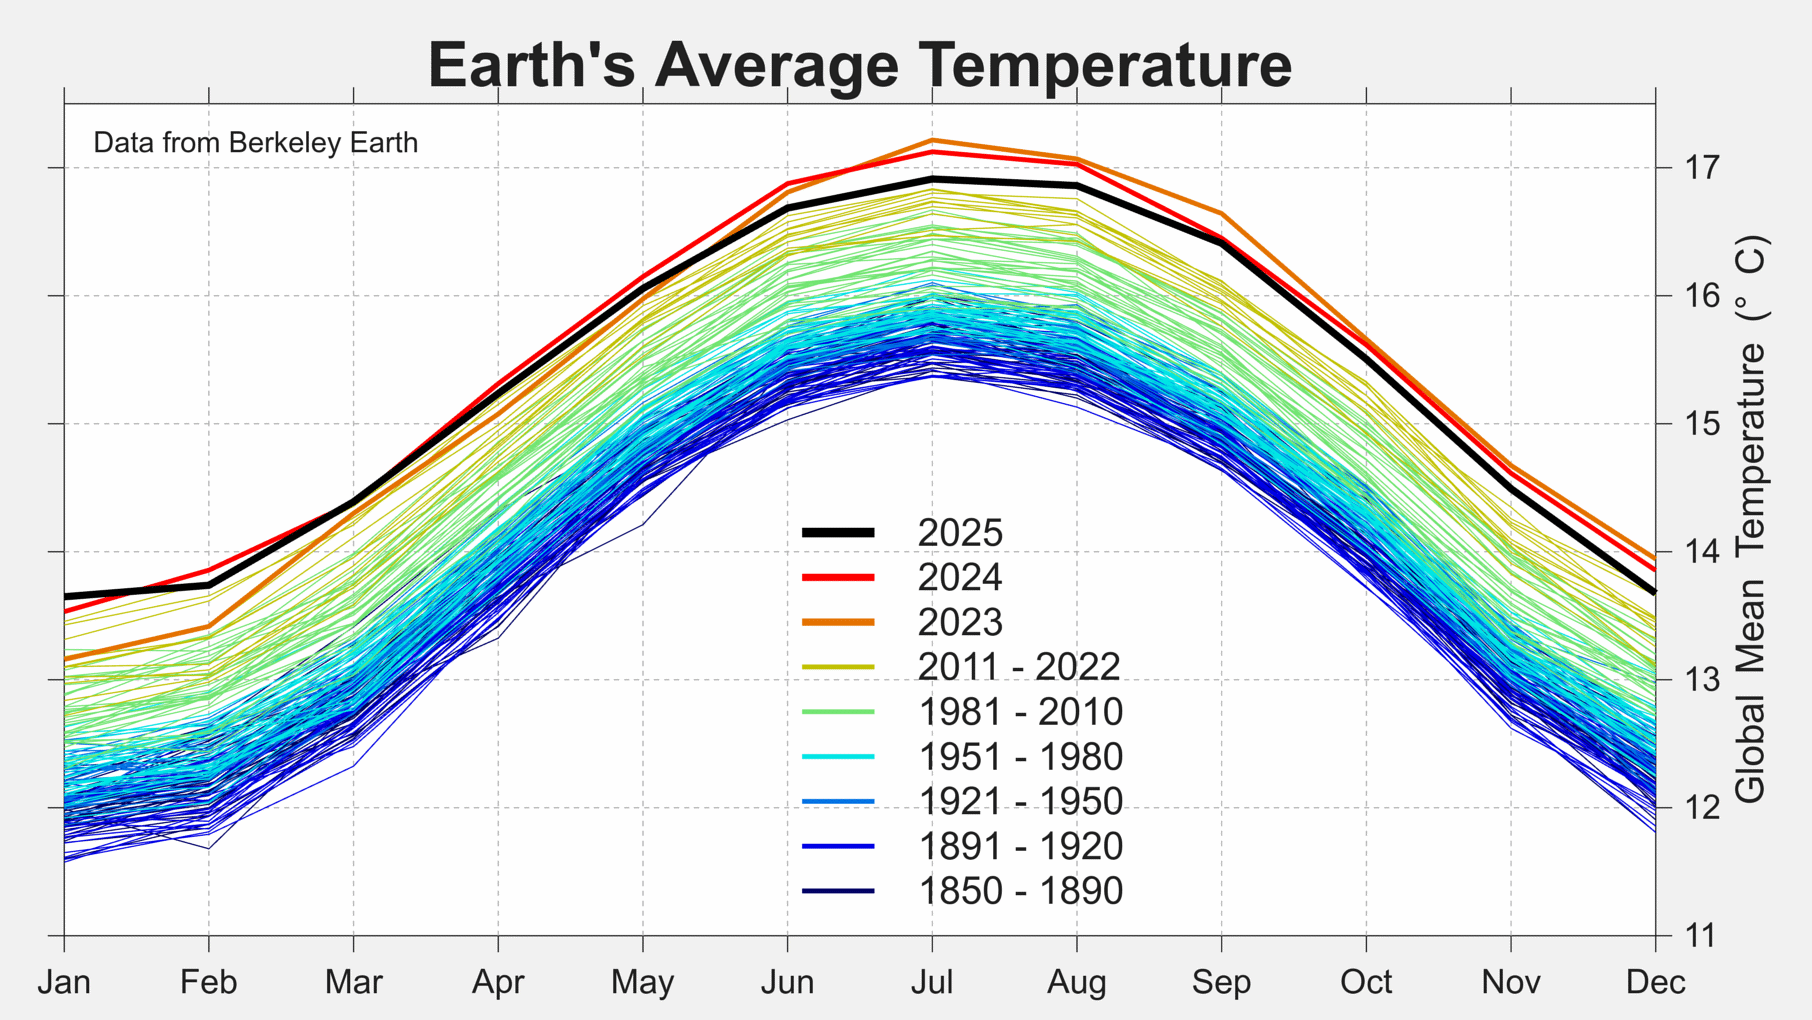
Monthly Temperature Patterns
The year 2025 began with record warmth in January and March before cooling and settling in the level behind 2023 and 2024. The cooling is partly due to La Niña event following the dissipation of the last El Niño event in mid 2024.
Causes of Warmth in 2025
The warming pattern in 2023 to 2025 has been extraordinary. It appears to have been caused by a combination of natural and man-made factors.
Over the long-term man-made global warming has been responsible for gradually increasing temperatures at a rate of ~0.20 °C / decade. Greenhouse gas emissions, which are the underlying cause of global warming, reached record highs in 2025.
While global warming controls the long-term trend, it changes only gradually. Short-term fluctuations in global mean temperature are primarily driven by internal variations in the climate system, such as the state of the El Niño / La Niña oscillation. To a lesser extent, they can also by affected by external processes such as the solar cycle and volcanic eruptions.
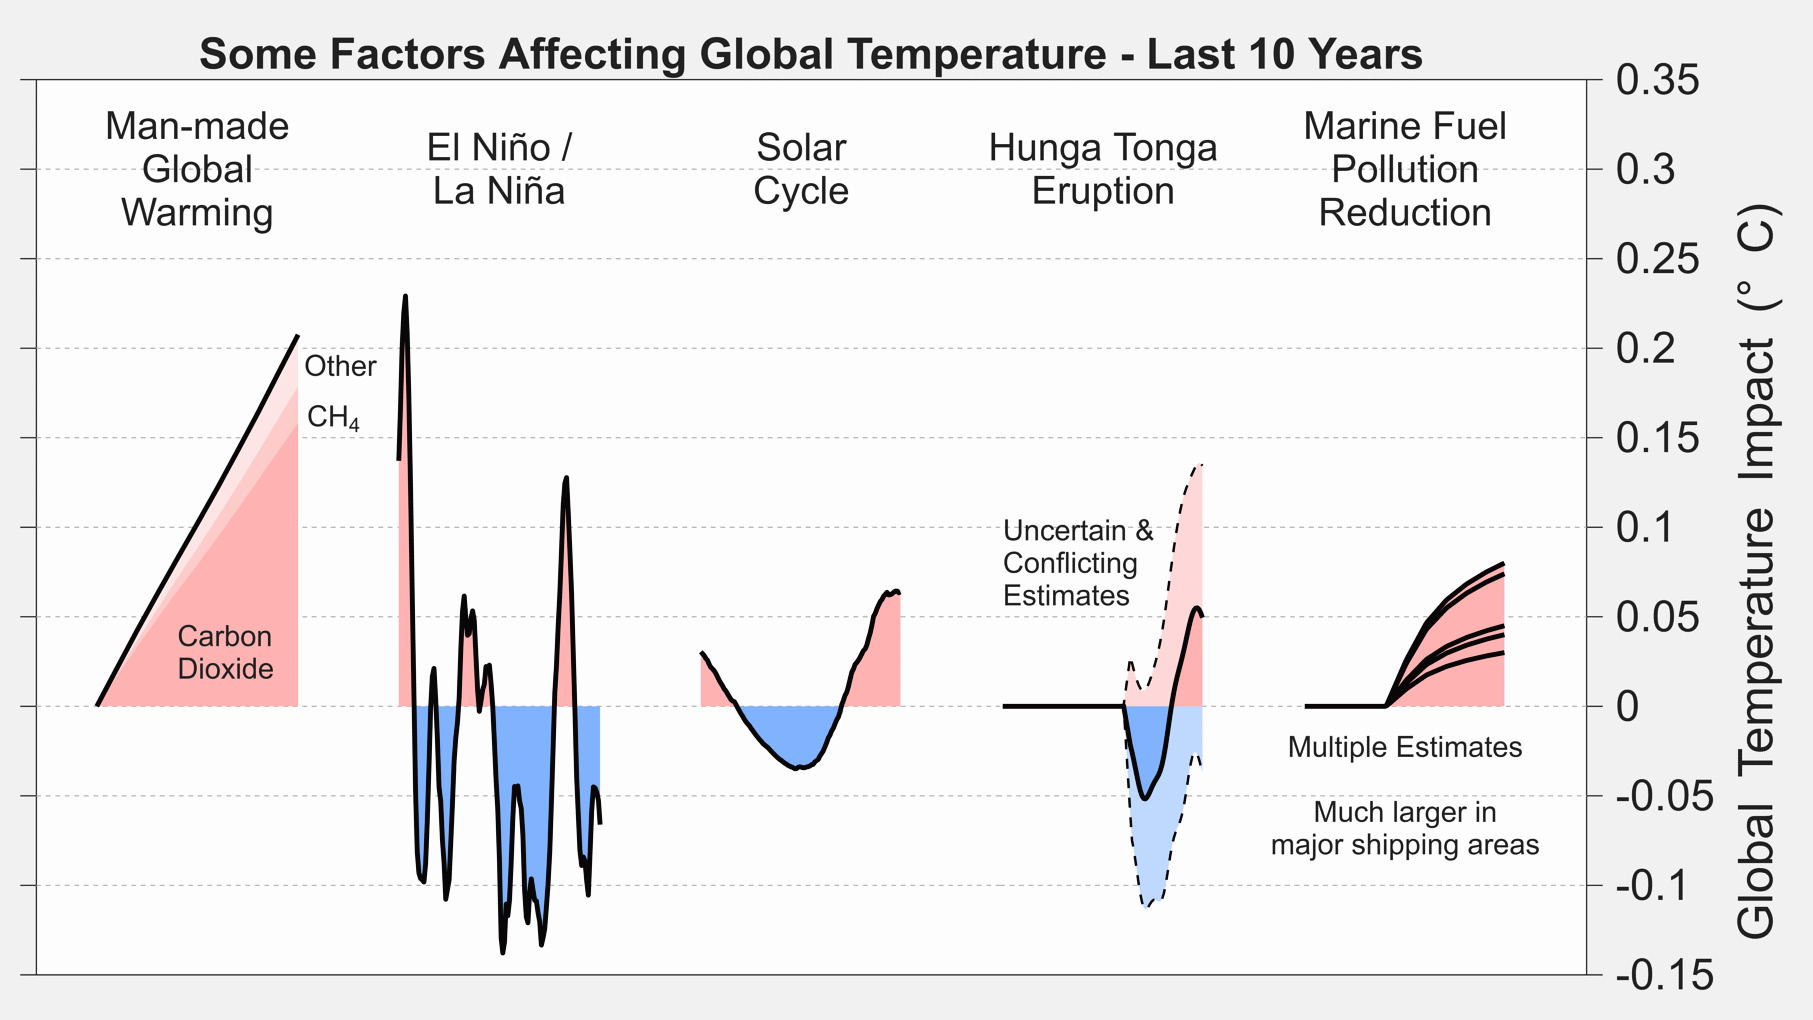
A large portion of the earlier temperature change from 2022 to 2023 can be ascribed to the effect of the transition from La Niña to El Niño. In mid 2024, this El Niño ended, and 2025 has seen mild La Niña events at both the start and end of the year. This La Niña would be expected to bring a reduction in global mean temperatures. Which cooling did occur in 2025, the magnitude was less than would ordinarily be exepected during a La Niña event.
Other factors likely influencing 2023 to 2025 climate include the ~11-year solar cycle, which is now near or slightly past its expected peak, and very modestly increases the energy coming from the sun. The current solar cycle appears to be modestly stronger than the previous cycle, but has an intensity close to 20th century averages.
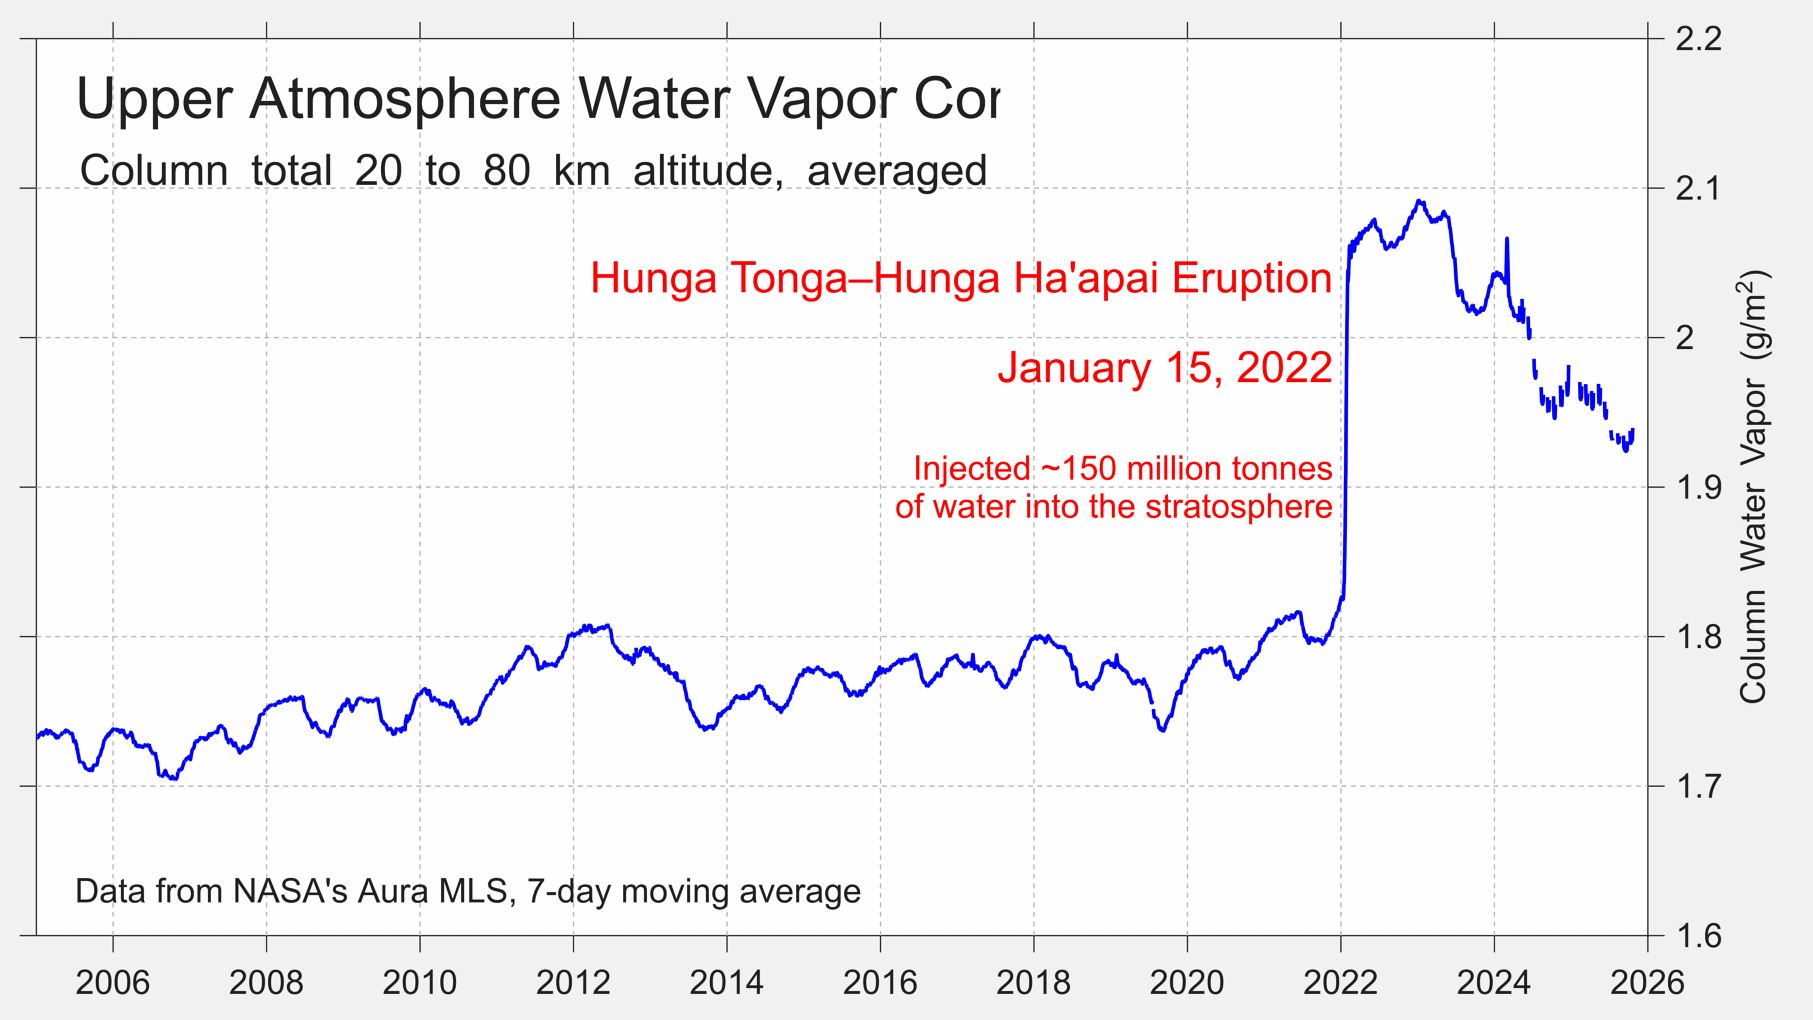
In addition, we consider it possible that the January 2022 Hunga Tonga eruption is contributing to unusual weather in during 2023 to 2025. Unlike most volcanoes, the eruption of Hunga Tonga was rich in water vapor and low in sulfur. Usually, a large eruption results in a temporary period of cooling due to excess sulfur in the atmosphere, but the Hunga Tonga eruption may have contributed warming instead due to the greenhouse effect caused by its large water vapor contribution to the upper atmosphere. In fact, a recent modeling study suggested that Hunga Tonga could lead to a initial period of cooling (due to sulfur aerosols) followed by a period of warming due to direct and indirect effects of upper atmospheric water vapor (which persists longer than the sulfur aerosols).
The total effect of the Hunga Tonga eruption is uncertain with arguments for both warming and cooling having been made. In addition, the excess water vapor may have had hard to predict indirect effects on upper atmospheric dynamics or chemistry. At present approximately half of the water vapor injected into the upper atmosphere by Hunga Tonga remains there.
Another likely factor in the warmth witnessed during 2023 to 2025 is the reduction in man-made sulfur aerosols. In 2020, new international rules (IMO2020) governing heavy fuels for marine shipping abruptly reduced sulfur emissions from large ships by ~85%.
This change was made to preserve human health, due to the toxic nature of sulfur aerosols. However, such aerosols also reflect sunlight, and as a result have a cooling effect. The aerosols can also serve a condensation centers aiding in the formation of cloud cover. This latter effect may be particularly important in oceanic regions due to the typically high relative humidity and low abundance of other condensation centers such as dust.
In general, sulfur aerosols are believed to have masked some of the effects of global warming. Reducing them from shipping could explain some of the excess warming, especially in the heavily trafficked North Atlantic and North Pacific regions.

Increased attention has recently been paid to the question of marine aerosols and their impact on climate. This has led to a diversity of estimates of the net effect.
Energy Imbalance and Cloud Cover
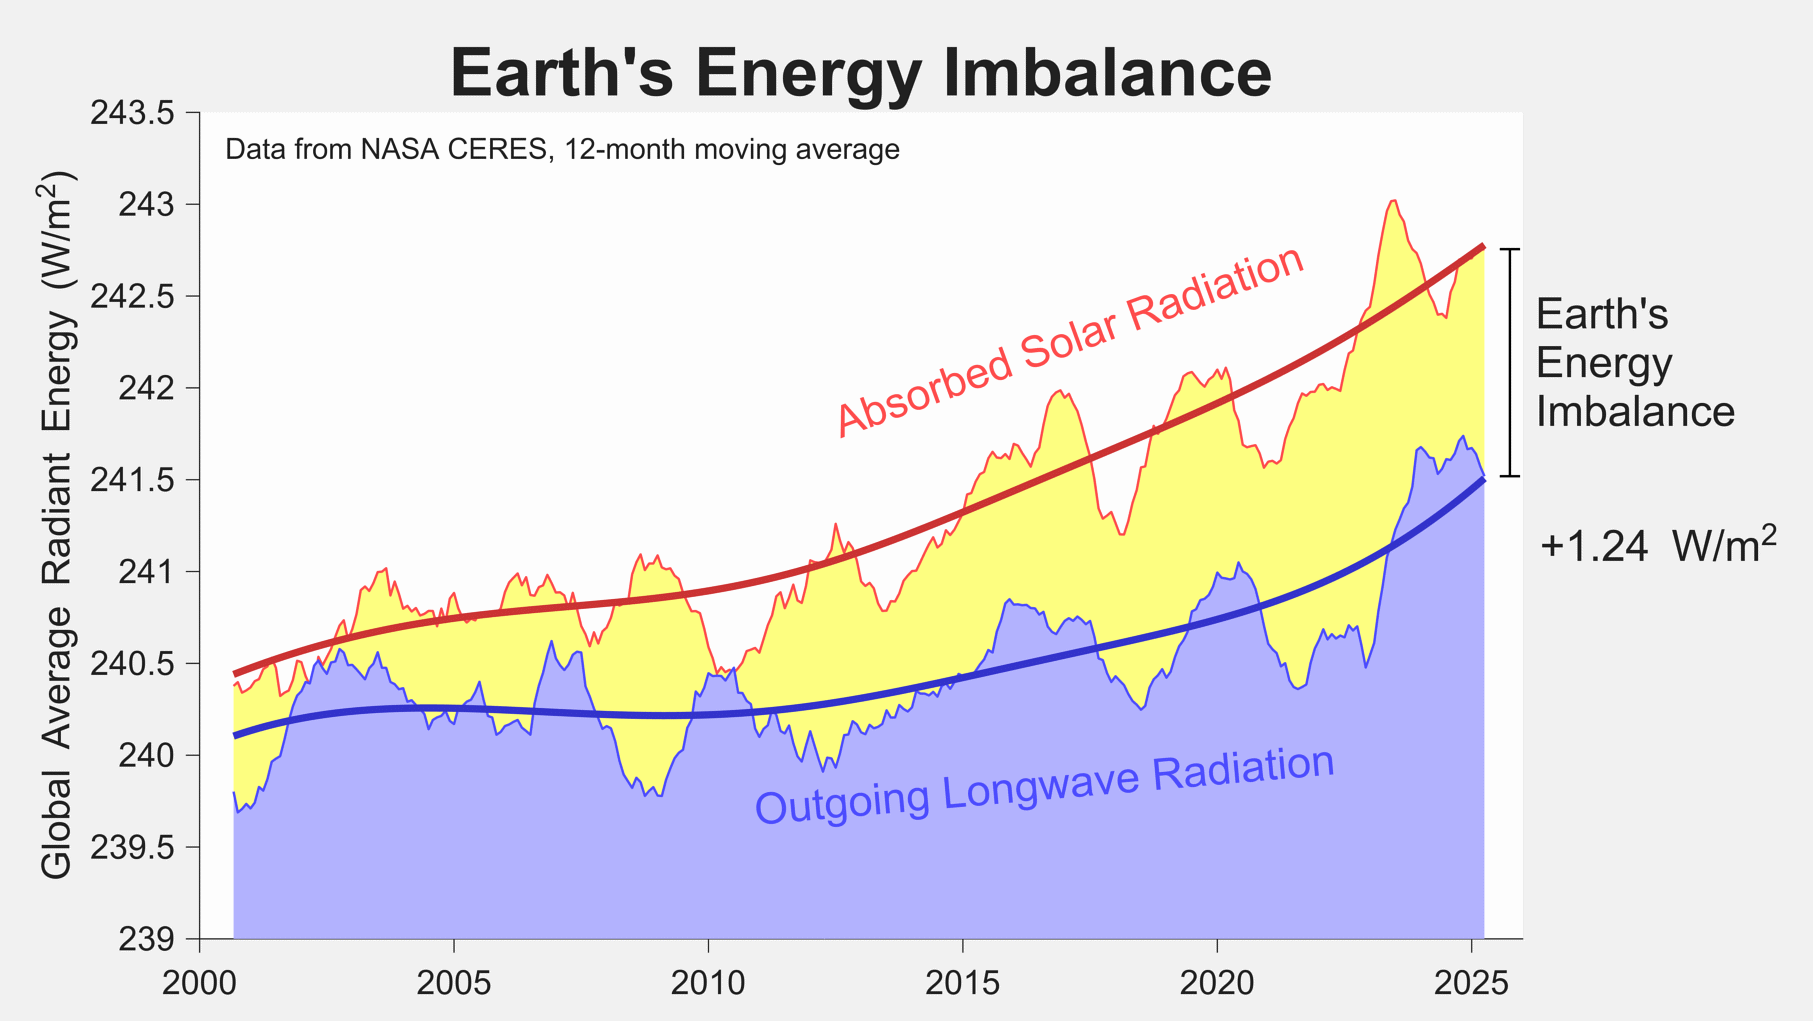
In order to understand the high rates of warming in 2023 to 2025 it is useful to examine Earth’s energy imbalance (EEI). The energy imbalance is the difference between how much energy the Earth absorbs from the Sun and how much subsequently escapes back into space as thermal radiation. It is a direct measure of how much extra energy is being trapped in the Earth system as a result of changes in greenhouse gases and other factors. As long as the energy imbalance is positive, we can expect the Earth to continue warming.
In the decades since satellites began reliably measuring Earth’s energy imbalance, recent years have produced some the largest EEI measurements on record.
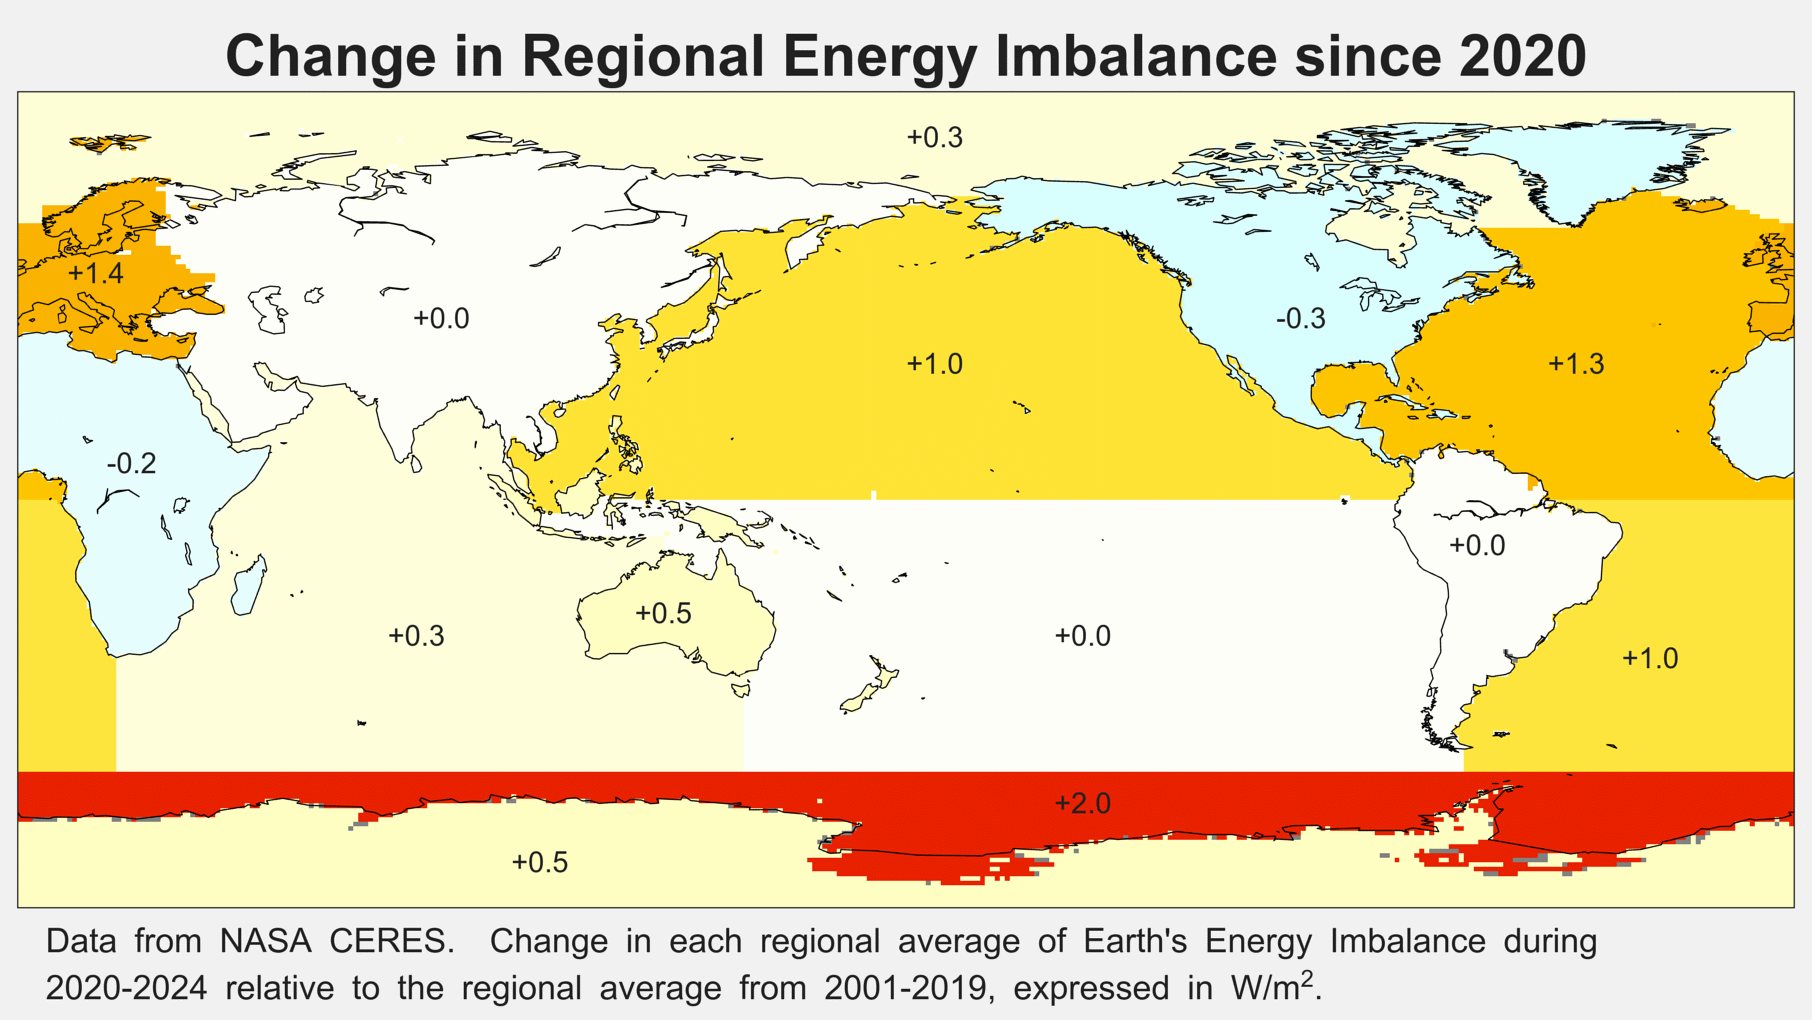
Spatially, the recent change in Earth’s energy imbalance is concentrated over the North Atlantic, South Atlantic, North Pacific, Europe, and the Southern Ocean. The change in the Southern Ocean is primarily related to record low sea ice cover in recent years. The changes in other ocean basins may be directly related to the reduction in marine sulfur aerosol emissions, which would be expected to allow more sunlight to reach the Earth’s surface.
Recent work by Goessling and colleagues has found that the changes in Earth’s energy imbalance are in large part the result of recent decreases in low cloud cover. This leads to a corresponding decrease in Earth’s albedo and allows a greater portion of incoming sunlight to be absorbed rather than reflected back into space.
Though changes in low cloud cover can explain changes in absorbed solar radiation, they aren’t really a primary cause. Cloud cover responds to other changes in the environment and can reasonably be understood as a sort of feedback or amplifier of other changes. Knowing that cloud cover changes are playing an important role in recent warming is very useful, but then requires one to determine why the cloud cover has changed.
Most climate models do expect absorbed solar radiation to increase as global warming progresses. This would be due to a reduction in low cloud cover, a reduction in snow and ice at the surface, and an increase in water vapor, all of which favor an increase in absorbed solar radiation. However, the observed changes indicated by the CERES program are far more rapid than typically expected by climate models given the current pace of global warming.
The change in cloud cover and rapid increase in absorbed solar radiation may be due, in part, to the recent reduction is man-made sulfur and other aerosols that have historically served to block a portion of the incoming solar radiation and facilitate cloud formation. In essence, recent efforts to reduce smog and other air pollution may have inadvertently accelerated global warming. It is also possible that some of the changes in cloud cover are due to natural variability or other feedback processes. Better understanding the recent changes in cloud cover and the associated increases in absorbed solar radiation will be vital for ensuring accurate forecasts of the future.
Given the known reductions in man-made air pollution, and the evidence of an increasing energy imbalance, it is also reasonable to anticipate that global warming may continue to accelerate if additional reductions in sulfur air pollution are undertaken. However, in some regions (such as the oceans) the majority of sulfur air pollution has already been eliminated, limiting the potential for further reductions to add additional warming.
Future Long-term Trend
Though it is interesting to understand the characteristics of individual years, global warming is ultimately about the long-term evolution of Earth’s climate. The exceptional nature of the warming in 2023 to 2025 makes future forecasting more difficult, since it likely points to a deviation from the historical trend.
Since 1980, the overall trend has been about +0.20 °C/decade (+0.36 °F/decade). The extreme warmth in 2023 to 2025 likely points to a period of greater warming. However, whether that greater warming rate persists over the long-term or is only present briefly is currently hard to predict. To the extent that excess recent warming is likely driven by reductions in man-made aerosol pollution, future warming from this source will also depend directly on human choices regarding the regulation of such aerosols.
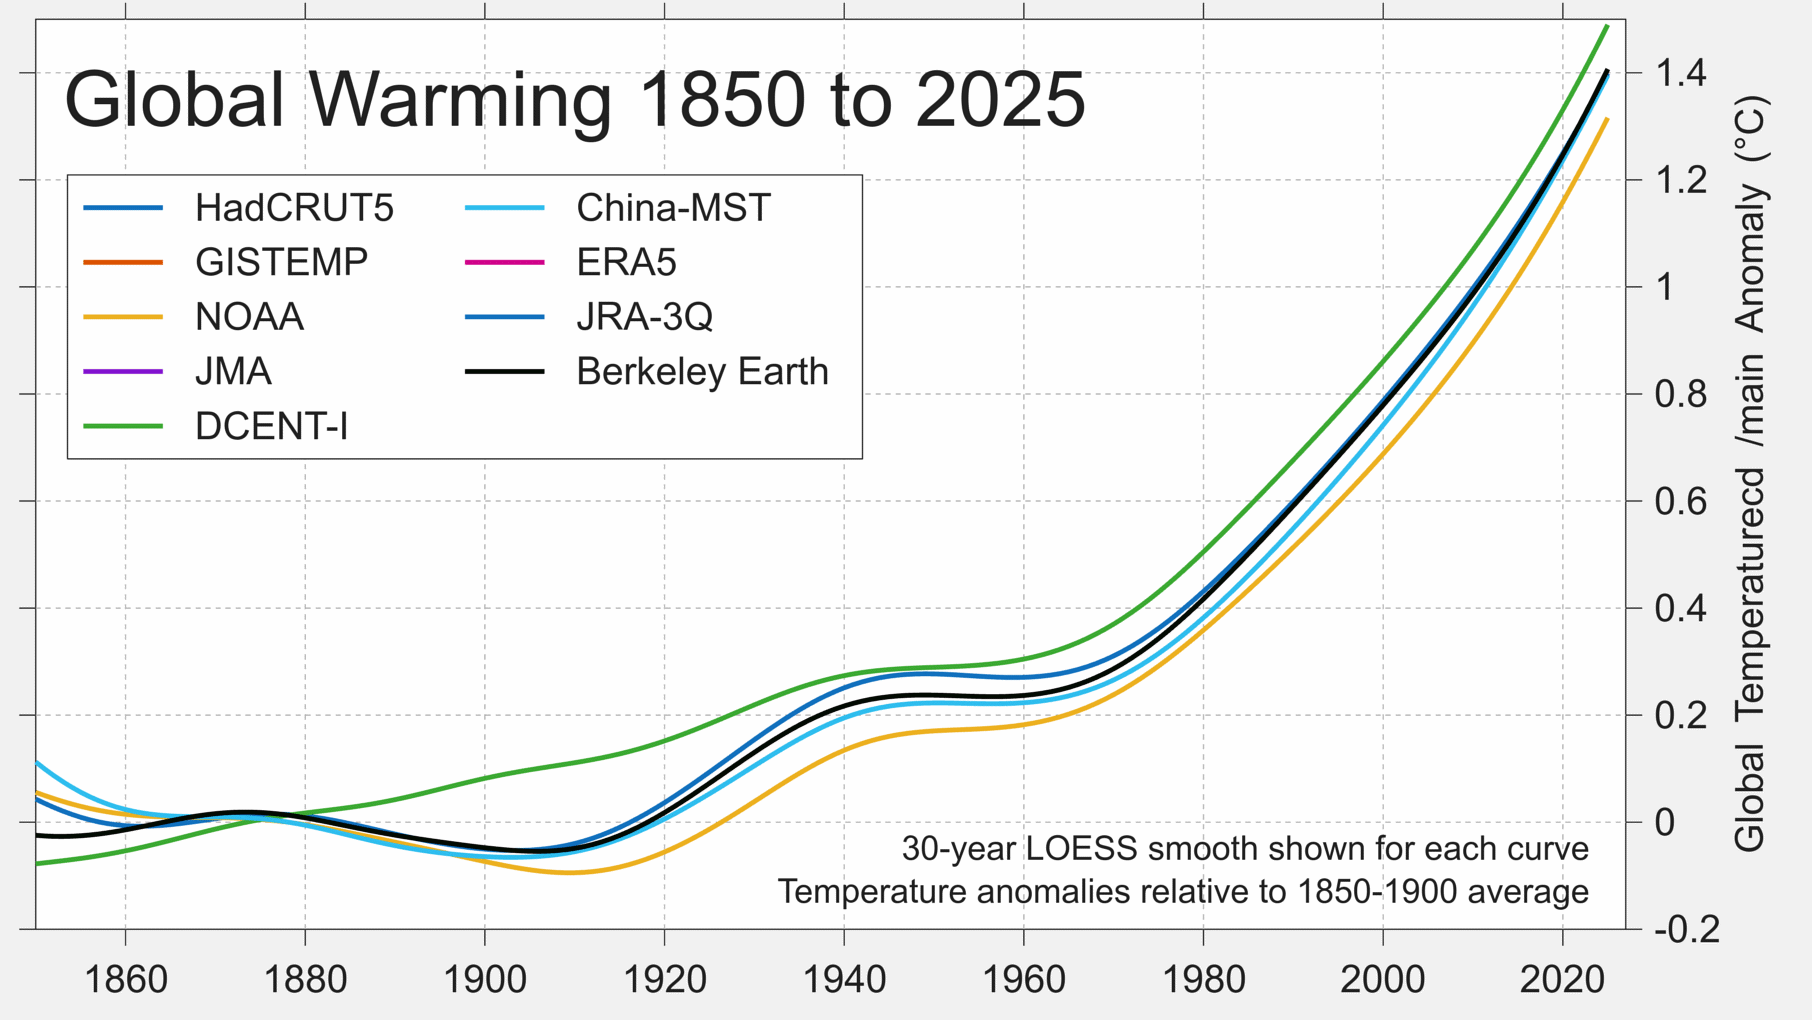
That said, our long-term trend estimate (a 30-year LOESS smooth) has already crossed 1.4 °C (2.5 °F) above the average temperature from 1850-1900. Given recent rates of warming is may take only less than 5 years for our long-term trend to reach 1.5 °C (2.7 °F).
The Paris Agreement on Climate Change aims to keep the long-term average global temperature rise to well below 2 °C (3.6 °F) and encourages parties to strive for warming of no more than 1.5 °C (2.7 °F). It has been clear for sometime that the 1.5 °C (2.7 °F) goal will not be achieved. Too little time remains and efforts at mitigation fall far short of what would have been needed to meet that target.
Nonetheless, effective mitigation can still limit global warming and reduce the severity of negative outcomes. The increasing abundance of greenhouse gases in the atmosphere due to human activities is the primary cause of recent global warming. If the Paris Agreement’s goal of no more than 2 °C (3.6 °F) warming is to be reached, significant progress towards reducing greenhouse gas emissions needs to be made soon.
Global Mean Temperature Prediction for 2026
Based on historical variability and current conditions, it is possible to roughly estimate what global mean temperature might be expected in 2026. Our current estimate is that 2026 is likely to be similar to or slightly cooler than 2025. With the ongoing La Niña, it is likely that 2026 will stay cooler than 2023 and 2024. As a result, we expect that 2026 will be roughly the 4th warmest year in the instrumental record. However, the newly formed La Niña is expected to be weak, and a return to El Niño by the end of 2026 is possible. The swings from El Niño to La Niña and back again are the largest source of predictable interannual variability in the global temperature record. If El Niño develops in early to mid-2026, it could drive up averages during 2026. However, it is more typical for El Niños to begin in the last few months of the year. In that case, a return to El Niño would impact 2027 more than it does 2026.
Estimated probabilities of annual average rank in 2026:
- 1st place: 10%
- 2nd place: 21%
- 3rd place: 12%
- 4th place: 51%
- 5th – 7th place: 5%
- 8th place or lower: 1%
At the start of 2025, we foresaw a 63% chance that 2025 would become the 3rd warmest year. The actual evolution of 2025 appears to have been broadly consistent with this forecast. Statistically, we expect global mean temperature to fall within our predicted forecast range ~95% of the time.
Comparisons with Other Groups
When preparing our year-end reports, Berkeley Earth traditionally compares our global mean temperature analysis to the results of four other groups that also report global mean surface temperature. The following charts compares Berkeley Earth’s analysis of global mean temperature to that of the NASA’s GISTEMP, NOAA’s GlobalTemp, the UK’s HadCRUT, and ECMWF‘s reanalysis. This year we are also including new and less well-known analyses including DCENT, JRA-3Q, JMA, and China-MST. All of these groups produce a similar understanding of recent climate change.
Due to delays in reporting, NOAA and NASA averages for 2025 are based on 11 months of data.
Different groups use different data and methods, but arrive at broadly similar conclusions. Most of the monitoring agencies concur with us that 2025 is the 3rd warmest year in the observational record, though NASA and DCENT place it as 2nd warmest.
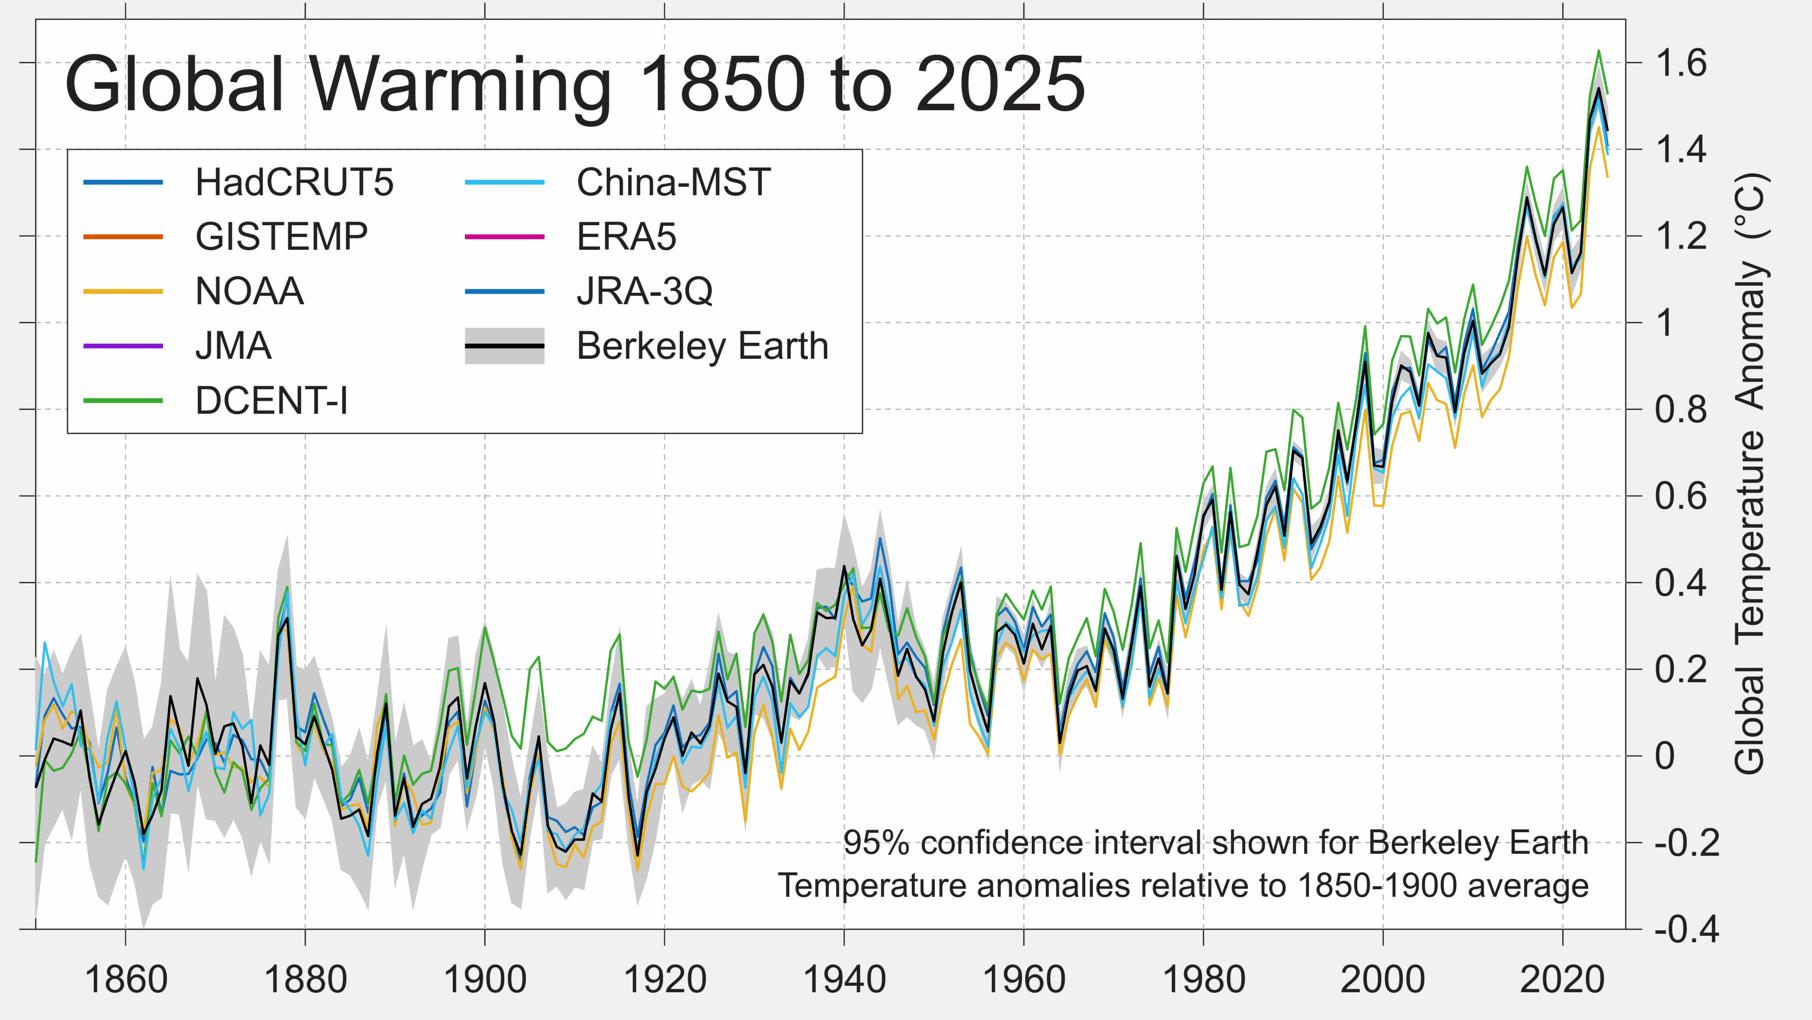
That said, the estimates of the total amount of warming in 2025 relative to the 1850 to 1900 baseline period do vary somewhat among the groups. This is primarily due to different estimates of global mean temperature during the baseline period.
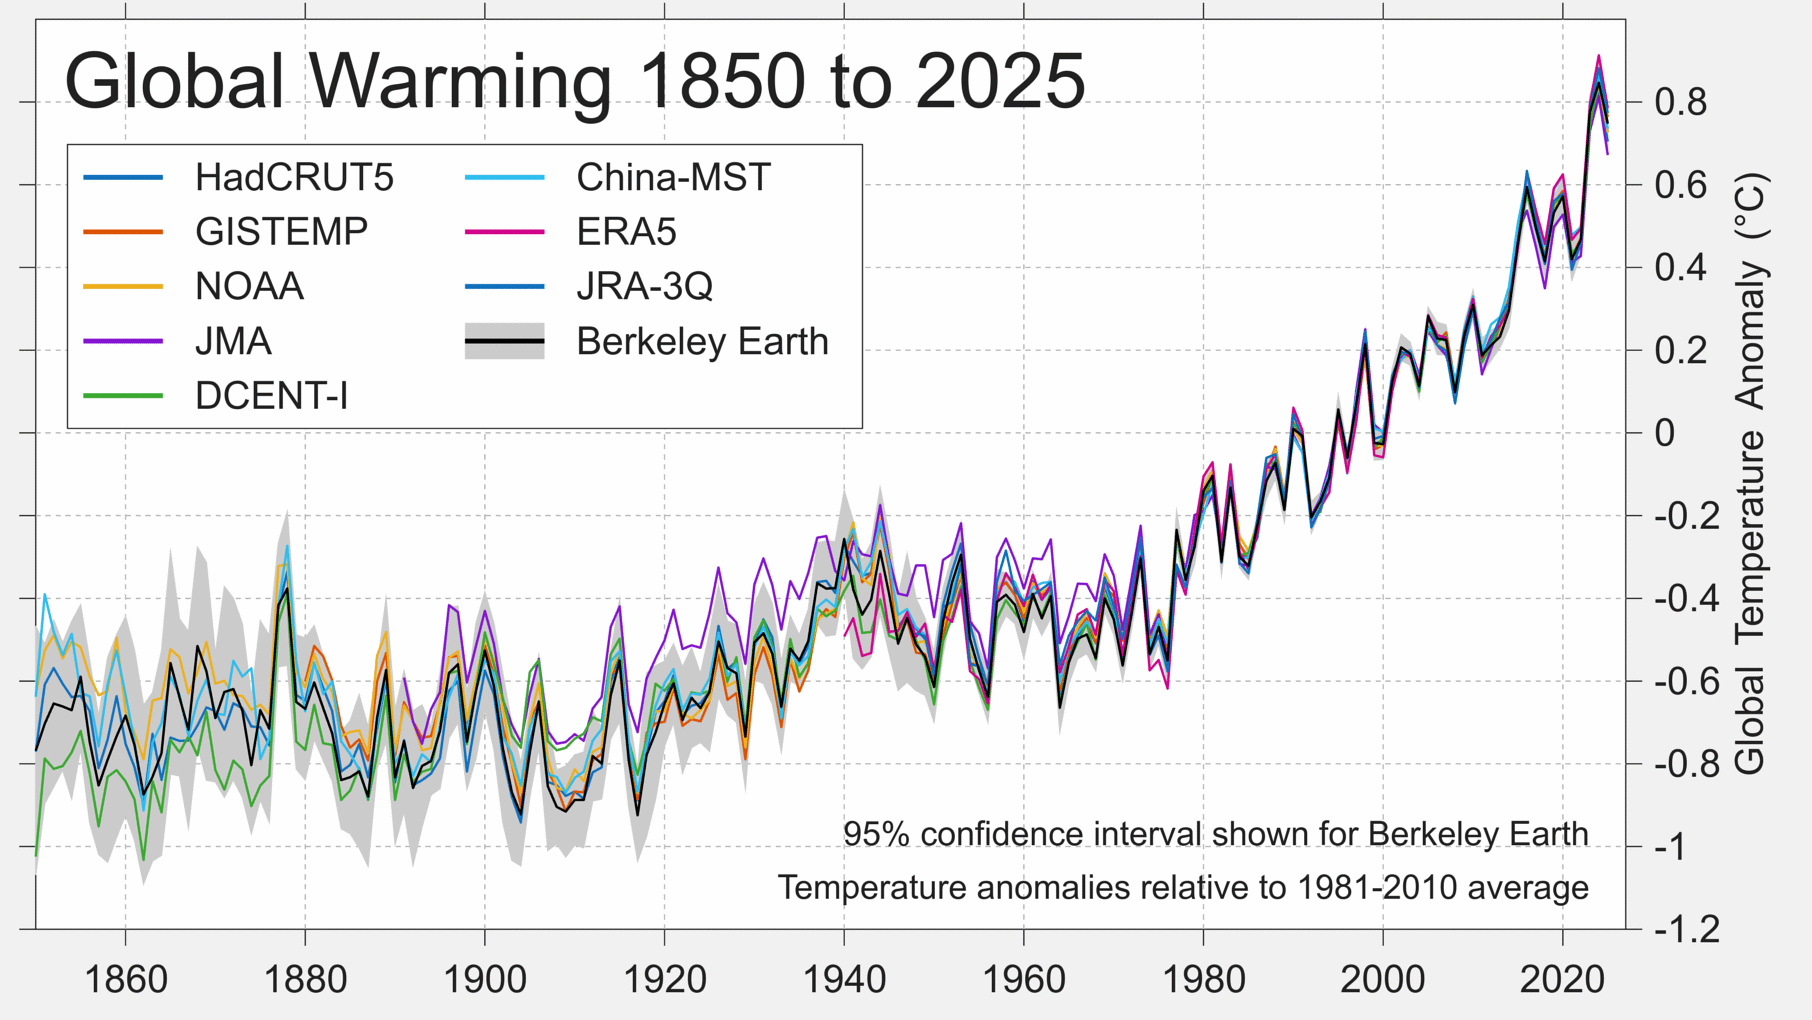
In the modern period, slight disagreements between groups mostly reflect the simple measurement uncertainties in these estimations and the differences in how various research programs look at the Earth. Each uses a somewhat different selection of source data and different methods of interpolation and correcting for measurement errors. Some methods are more limited than others. Berkeley Earth is notable for incorporating more weather station data than any other project.
Unfortunately, there are larger disagreements regarding the earliest part of the observational temperature history. If we align each time series for a pre-industrial baseline, it becomes clear that some of the series imply a slightly larger or smaller change in the present day due to their differing estimates of the pre-industrial period.
Smoothing each series makes this even clearer.
Estimating global mean temperature in the late 19th century is always going to be more challenging than during the recent period due to less data and the less reliable nature of the data that does exist. Much of the disagreement between analysis groups derives from the choice of ocean dataset employed. NASA and NOAA rely on NOAA’s ERSST data product, while Berkeley Earth and HadCRUT use the HadSST data set. These two data products are the most widely used instrumental reconstructions of the long-term changes in the ocean and they disagree to an appreciable degree.
The primary reason that ERSST and HadSST differ is due to different estimates of the biases introduced by changing methods and instrumentation over time. Early ocean temperature observations relied on hauling buckets of water onto the ship’s deck in order to be measured. Over time this was replaced, first with measurements at an engine cooling intake, and later with automated buoys. It is known that each of these processes measures the ocean slightly differently (e.g. sampling at slightly different depths), and will give slightly different answers at the level of a fraction of a degree Celsius. Untangling these differences and correcting the resulting biases is an important aspect of ocean temperature analysis. Unfortunately ERSST and HadSST disagree on the magnitude of these corrections. These problems are well-known and have led to calls for new approaches to understood past ocean biases. In part, the new DCENT analysis was created to provide a new ocean analysis. In the future, new efforts to analyze ocean temperature records and the associated biases may also help to reduce this disagreement.
Ultimately, each research group strives to produce the best possible estimate, but these methodological differences make understanding of the changes since the pre-industrial period more difficult. Different research groups disagree on the amount of warming that has occurred since the pre-industrial by more than 0.1 °C (0.2 °F).
This large difference between analysis groups is sometimes described as the “structural uncertainty” in the estimate of long-term temperature change, and limits humanity’s ability to say for sure how much warming has occurred. Most groups provides an error estimate of how confidently climate can be reconstructed within their own set of bias and uncertainty assumptions. However, the structural disagreement between groups is often larger than the individual uncertainty estimates of the groups, indicating that disagreements about the underlying assumptions themselves are likely a significant source of uncertainty.
Berkeley Earth Methodology
In reconstructing the changes in global mean temperature since 1850, Berkeley Earth has examined 24 million monthly-average temperature observations from 57,685 weather stations. Of these 21,765 stations and 200,000 monthly averages are available for 2025.
The weather station data is combined with sea surface temperature data from the UK Met Office’s Hadley Centre (HadSST). This ocean data is based on 498 million measurements collected by ships and buoys, including 14.6 million observations obtained in 2025. We reprocess and interpolate the HadSST data to provide a more complete picture of the oceans. After combining the ocean data with our land data, we arrive at a global picture of climate change since 1850.
Uncertainties arise primarily from the incomplete spatial coverage of historical weather observations, from noise in measurement devices, and from biases introduced due to systematic changes in measurement technologies and methods. The total uncertainty is much less than the long-term changes in climate during the last 170 years.
This report is based on such weather observations as had been recorded into global archives as of early January 2025. It is common for additional observations to be added to archives after some delay. Consequently, temperature analysis calculations can be subject to revisions as new data becomes available. Such revisions are typically quite small and are considered unlikely to alter the qualitative conclusions presented in this report.
Copyright
This report was prepared by Berkeley Earth. The contents of this report, including all images not attributed to a specific third-party author, may be reused under the terms of the Creative Commons BY-NC 4.0 copyright license for any non-commercial purpose and in any forum, consistent with the terms of that license.
Members of the news media may also use the materials in this report for any news reporting purpose provided that Berkeley Earth is properly acknowledged, without concern for whether or not the CC BY-NC 4.0 license is followed.
For more information about licensing for commercial purposes, please contact admin@berkeleyearth.org.
Data
Updated data files will appear at our data page, and are updated monthly.
In particular, monthly and annual time series are available.