The following is a summary of global temperature conditions in Berkeley Earth’s analysis of September 2022.
- Globally, September 2022 was the 4th warmest September since records began in 1850.
- Warm conditions occurred in Greenland, parts of North America, parts of Asia, and in several areas of the Atlantic, Pacific, and Mediterranean.
- Unusually cool conditions were present in Eastern Europe, the Equatorial Pacific, Northern Asia, and parts of Antarctica.
- Moderate La Niña conditions are present, and La Niña is expected to continue until next year.
- 2022 is likely to the be the 4th or 5th warmest year.
Global Summary
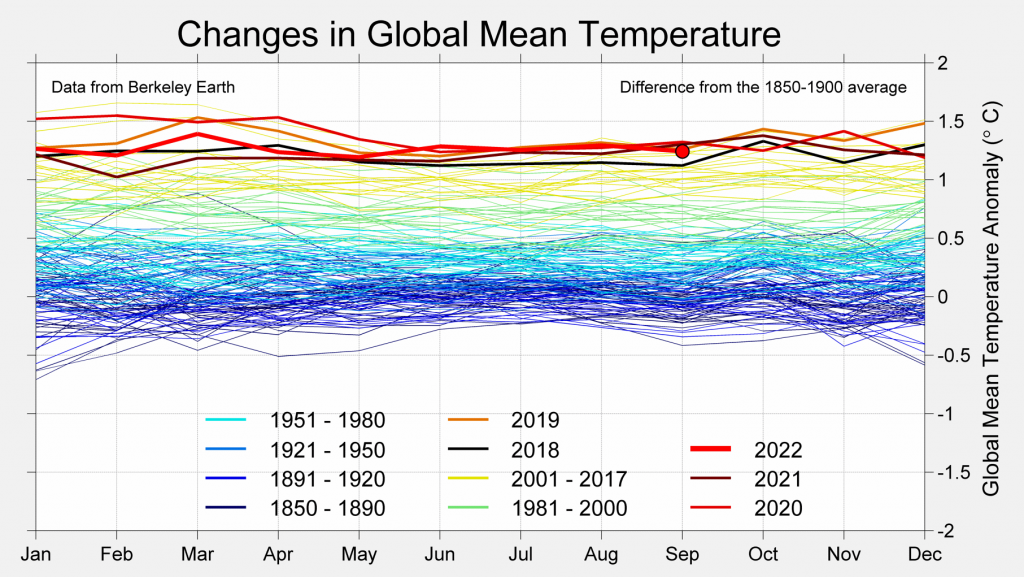
Globally, September 2022 has been nominally the fourth warmest September since records began in 1850. This September is slightly cooler than the three previous Septembers, in 2019, 2020, and 2021, and slightly warmer than September 2014, 2015, and 2016. However, given the error margins, many of these years are essentially tied. All other previously observed years had a September significantly cooler than in 2022.

The global mean temperature in September 2022 was 0.90 ± 0.08 °C (1.62 ± 0.14 °F) above the 1951 to 1980 average, which is a modest decrease from August.
This is equivalent to being 1.24 ± 0.11 °C (2.24 ± 0.19 °F) above the 1850 to 1900 average, which is frequently used as a benchmark for the preindustrial period.
The global mean temperature anomaly in September 2022 was a slight decrease from August 2022 and similar to several other recent months. Temperatures in September were close to the long-term trend line despite the cooling effect of the ongoing La Niña conditions.

Spatial Variation
September 2022 continues the ongoing pattern of widespread warmth, though with some notable exceptions. Particularly warm conditions were present in some of North America and in parts of central Asia. Record setting warmth was also present in significant portions of the North Atlantic, Mediterranean, and the North and South Pacific. Particularly cool conditions were present in Eastern Europe, Northern Asia, parts of Antarctica, and the Eastern equatorial Pacific Ocean.
We estimate that 4.2% of the Earth’s surface experienced their locally warmest September average, and 73% of the Earth’s surface was significantly warm when compared to their local average during the period 1951 to 1980. In addition, 0.01% of the Earth’s surface had their locally coldest September.
The large cool area in the Eastern Pacific is consistent with the ongoing La Niña conditions.
A special note regarding a likely underestimate of temperatures in Greenland is discussed in a separate section below.

Over land regions, 2022 was the 8th warmest September, falling markedly below September 2019, 2020, and 2021, though somewhat higher than September 2018. The land average was 1.08 ± 0.11 °C (1.95 ± 0.20 °F) above the 1951 to 1980 average. This is a significant decline from August, which was the 2nd warmest August on land.
September 2022 was the 5th warmest September in the oceans, recorded as 0.65 ± 0.10 °C (1.17 ± 0.18 °F) above the 1951 to 1980 average. This is largely indistinguishable from the previous six years, though markedly cooler than the record set in September 2015. This relatively low rank is influenced, in part, by the cooling effects of the ongoing La Niña event.


Greenland
A special note is needed regarding possible record-breaking temperatures in Greenland during September. We place the Greenland average as very high for September, but nowhere near the extremes suggested by other work, include satellite and reanalysis observations. ERA5 reanalysis, for example, concluded that September set a new record by a large margin. Satellite observations tend to support this, following an extreme warm air and melting event that was unprecedented in magnitude for September.

Berkeley Earth’s analysis, based on weather stations, shows less extreme warming in Greenland. However, after review, we believe the ERA5 conclusions are more likely to be correct, and that Berkeley Earth’s estimate for this month in Greenland is likely to be too low.
The initial analysis of September weather conditions by Berkeley Earth was done using such weather station data as was available in global archives during the first week of October. Upon review, we find that the September inputs included six weather stations in Greenland. However, unfortunately, none of the weather stations on the top of the ice sheet that we would ordinarily use had archived their data at the time of our analysis. Since this run did not include any observations above 1000m elevation, it appears likely that our observational network did not adequately sample the peak of this warming event. As a result, we think that the satellite and ERA5 evidence of a more extreme event should be considered likely.
As routinely occurs, future updates of the Berkeley Earth analysis will incorporate any additional data that has become available. Assuming additional weather data is provided from Greenland, our estimate of Greenland’s temperature in September will be revised accordingly.
La Niña
September 2022 had well-defined moderate La Niña conditions in the Pacific Ocean. The La Niña phenomenon, associated with relatively cool water in the Eastern equatorial Pacific, is a form of seasonal weather variability that is generally associated with cooler global average temperatures. The current La Niña event began in 2020 and has exhibited surprising longevity. This La Niña is likely to continue into the next year. The CPC/IRI analysis suggests that La Niña conditions are likely over the rest of the year, with only a < 10% chance of a shift to El Niño conditions before the middle of 2023.

Year to Date
Though June, July, and August were each only slightly below their corresponding monthly records, September is more markedly below the prior record. Nonetheless, every month in 2022 has been at least 1.1 °C (2.0 °F) warmer than the 1850-1900 average. As a result, 2022 is currently positioned as the 5th warmest year.
The most prominent spatial features of year to date temperatures are the cool La Niña pattern, warmth over Asia, and record warmth in the North and South Pacific. Parts of Western Europe, including the UK, have also seen record or near-record temperatures when averaging January through September.

Rest of 2022
The ongoing La Niña event makes it likely that 2022 will be cooler than recent record warm years; however, 2022 is nearly certain to remain within the top eight warmest years overall.
The statistical approach that we use, looking at conditions in recent months, believes that 2022 is most likely to be the 4th or 5th warmest year in the instrumental record, with about a 89% chance of one of these outcomes. It is very unlikely (< 1%) that the remainder of 2022 warms enough for 2022 to be within the top 3 warmest years. It is also very unlikely that 2022 will be any cooler than the 6th warmest, which means that this year is very likely to still surpass all years prior to 2015.

Likelihood of final 2022 ranking:
- 1st place (< 1 %)
- Top 3 overall (< 1 %)
- 4th place (30 %)
- 5th place (59 %)
- 6th place (10%)
- Top 6 overall (> 99 %)
Methodology
The Berkeley Earth global temperature data set is ordinarily a combination of Berkeley Earth land surface temperature data and an interpolated ocean sea surface temperature field derived from the HadSST4 data set. The HadSST data set is built upon multiple third-party data collections of direct ocean temperature measurements from ships, buoys, and other platforms. During most of 2021, HadSST updates were frequently subject to delays of weeks or months due to delays in the third-party data sources that it relied on. Due to these delays, Berkeley Earth updates were also frequently delayed.
Due to the ongoing pattern of delays, we have taken the unusual step of preparing this monthly temperature report using an alternative set of sea surface temperature data. The data set adopted for this purpose is the sea surface temperature data from the Copernicus ERA5 reanalysis. This alternative data is only used for September 2022 during which HadSST4 is not yet available. The ERA5 data has been reprocessed to make it more similar to the resolution of our previous analysis and local anomaly baselines have adjusted to match the 1980 to 2021 period in HadSST4.
We believe that this substitute data should provide a good indication of current global ocean conditions.
However, due to difference between ERA5 and HadSST4, we do observe more small-scale variation in the data processed this way and estimates of temperature ranks for assessing local records may sometimes be unreliable in the ocean. In addition, we have increased the reported uncertainty on the ocean averages to include an estimate of the systematic differences between HadSST4 and ERA5.
Though we have adopted ERA5 ocean data for these reports in order to provide timely temperature updates, the gridded data sets appearing on the Berkeley Earth website will continue to use only HadSST as described in the associated documentation. As a result, updates to some of the gridded data sets are likely to continue to be delayed.