
| Land | |||
| Temperature Anomaly | 2.176C | 0.108C (+-) | Relative to 1951-1980 |
| Temperature Anomaly | 2.752C | 0.162 (+-) | Relative to 1850-1900 |
| Anomaly Rank since 1850 | 2 out of 1995 | range: 1 – 2 | Any 1 month period |
| Anomaly Rank since 1850 | 1 out of 167 | range: 1 – 1 | Same 1 month period |
| Ocean | |||
| Temperature Anomaly | 0.682C | 0.079 (+-) | Relative to 1951-1980 |
| Temperature Anomaly | 0.929C | 0.108 (+-) | Relative to 1850-1900 |
| Anomaly Rank since 1850 | 3 out of 1995 | range: 1 – 11 | Any 1 month period |
| Anomaly Rank since 1850 | 1 out of 167 | range: 1 – 1 | Same 1 month period |
| Land & Ocean | |||
| Temperature Anomaly | 1.195C | 0.064 C (+-) | Relative to 1951-1980 |
| Temperature Anomaly | 1.565C | 0.090 (+-) | Relative to 1850-1900 |
| Anomaly Rank since 1850 | 2 out of 1995 | range: 1 – 3 | Any 1 month period |
| Anomaly Rank since 1850 | 1 out of 167 | range: 1 – 1 | Same 1 month period |
March Extremes
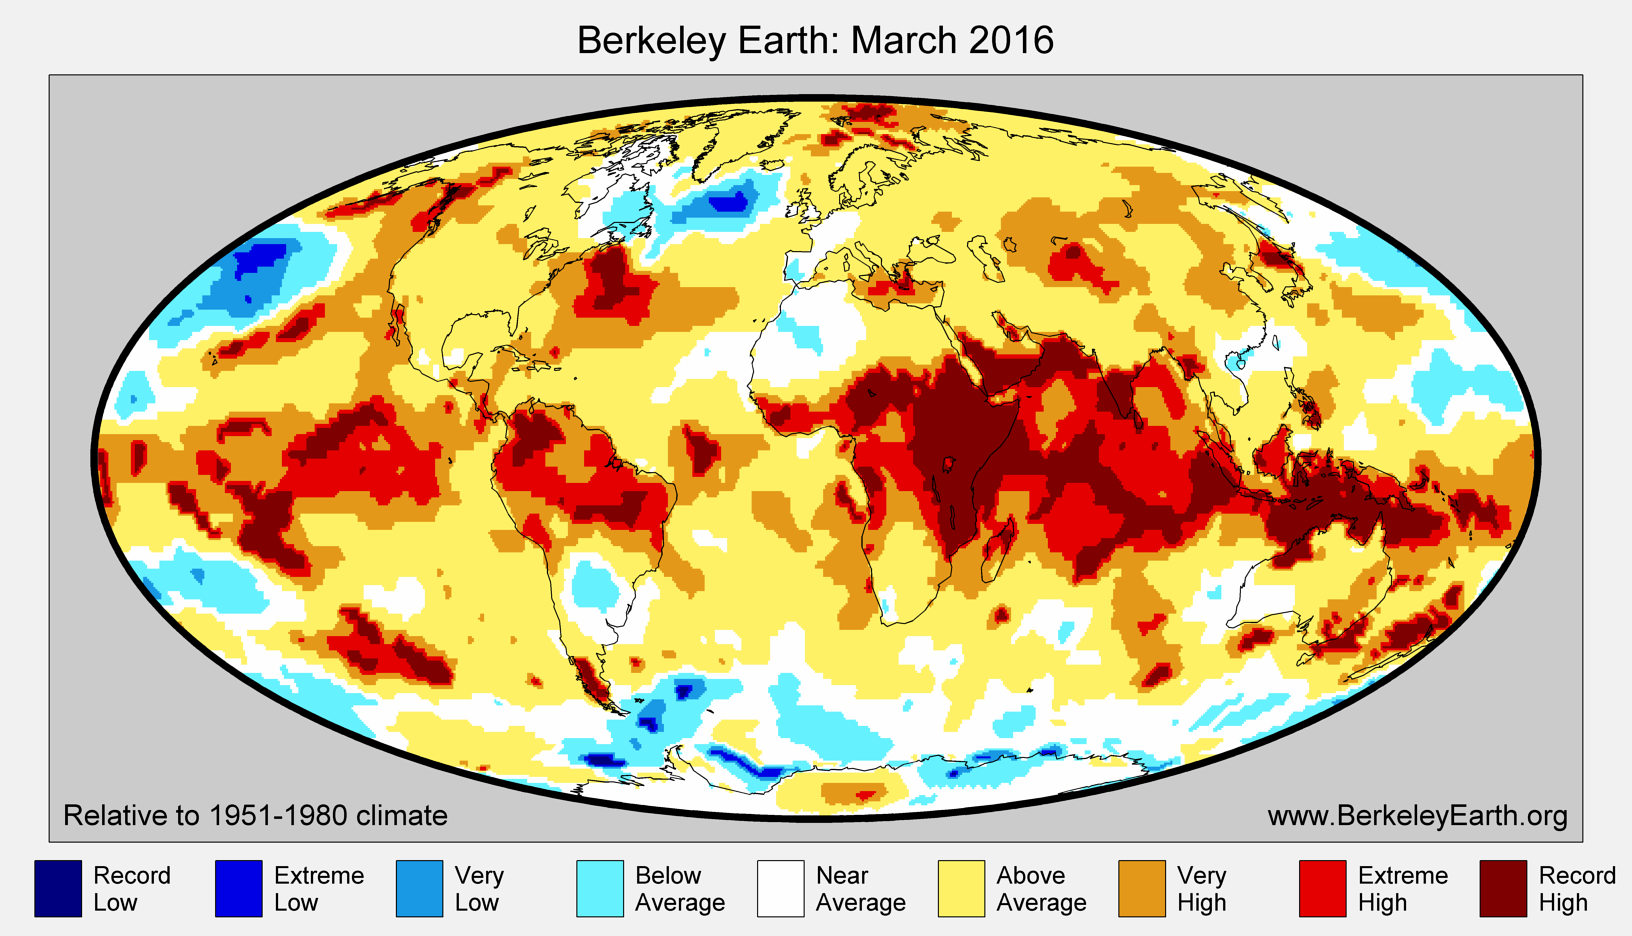
| Record Low: | 0.09% |
| Extreme Low: | 0.29% |
| Very Low: | 1.08% |
| Below Average: | 7.18% |
| Near Average: | 15.72% |
| Above Average: | 41.64% |
| Very High: | 18.17% |
| Extreme High: | 7.01% |
| Record High: | 8.82% |
Time Series
Land

Ocean

Land & Ocean

Trend Maps


| Period | Trend C/decade |
| 1850-Present | 0.06 C/decade |
| 1900-Present | 0.086 C/decade |
| 1950-Present | 0.12 C/decade |
| 1970-Present | 0.177 C/decade |
| 1990-Present | 0.188 C/decade |