The following is a summary of global temperature conditions in Berkeley Earth’s analysis of January 2025.
- Globally, January 2025 was the warmest January since records began in 1850, breaking the 2024 record by 0.09 °C
- The land temperature average was the warmest January on record while the ocean average was the second warmest.
- La Niña conditions were established in December, however global temperatures remain anomalously warm compared to past La Niña events.
- The 12-month moving-average is equal to 1.57 ± 0.08 °C (2.83 ± 0.15 °F) above the 1850-1900 average.
- There is approximately a 30% chance that 2025 will be the warmest year on record.
Global Summary
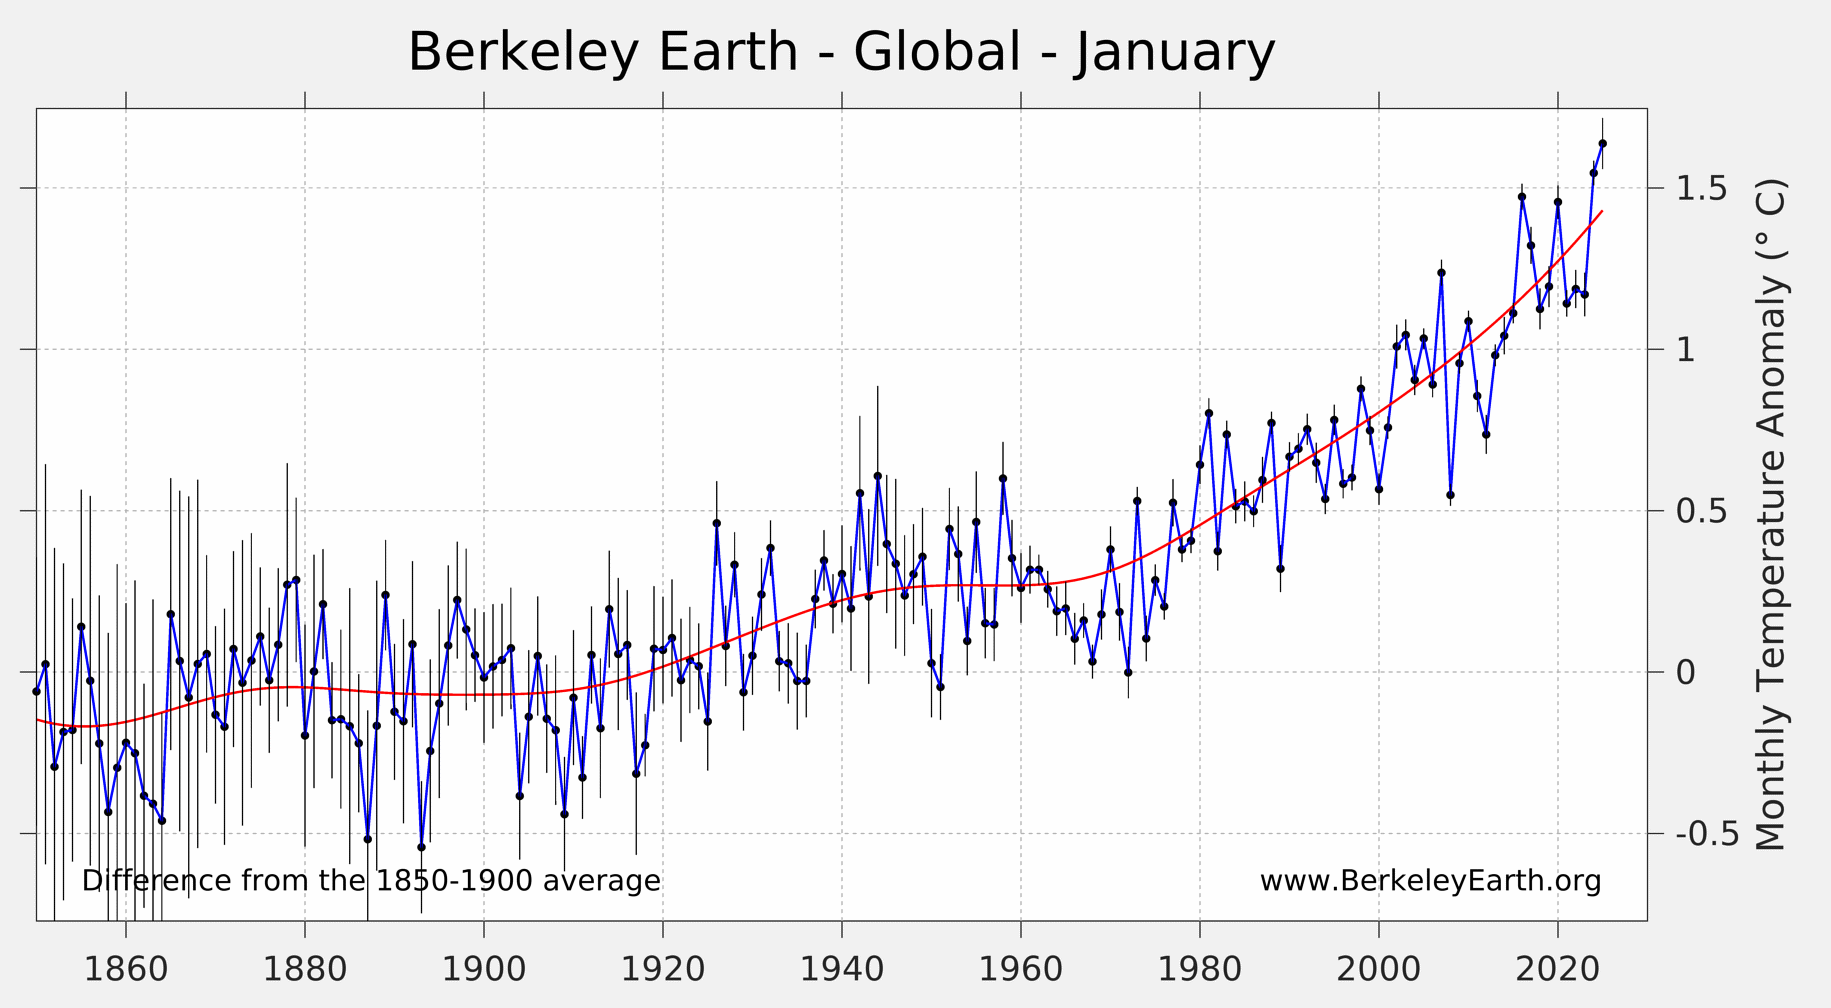
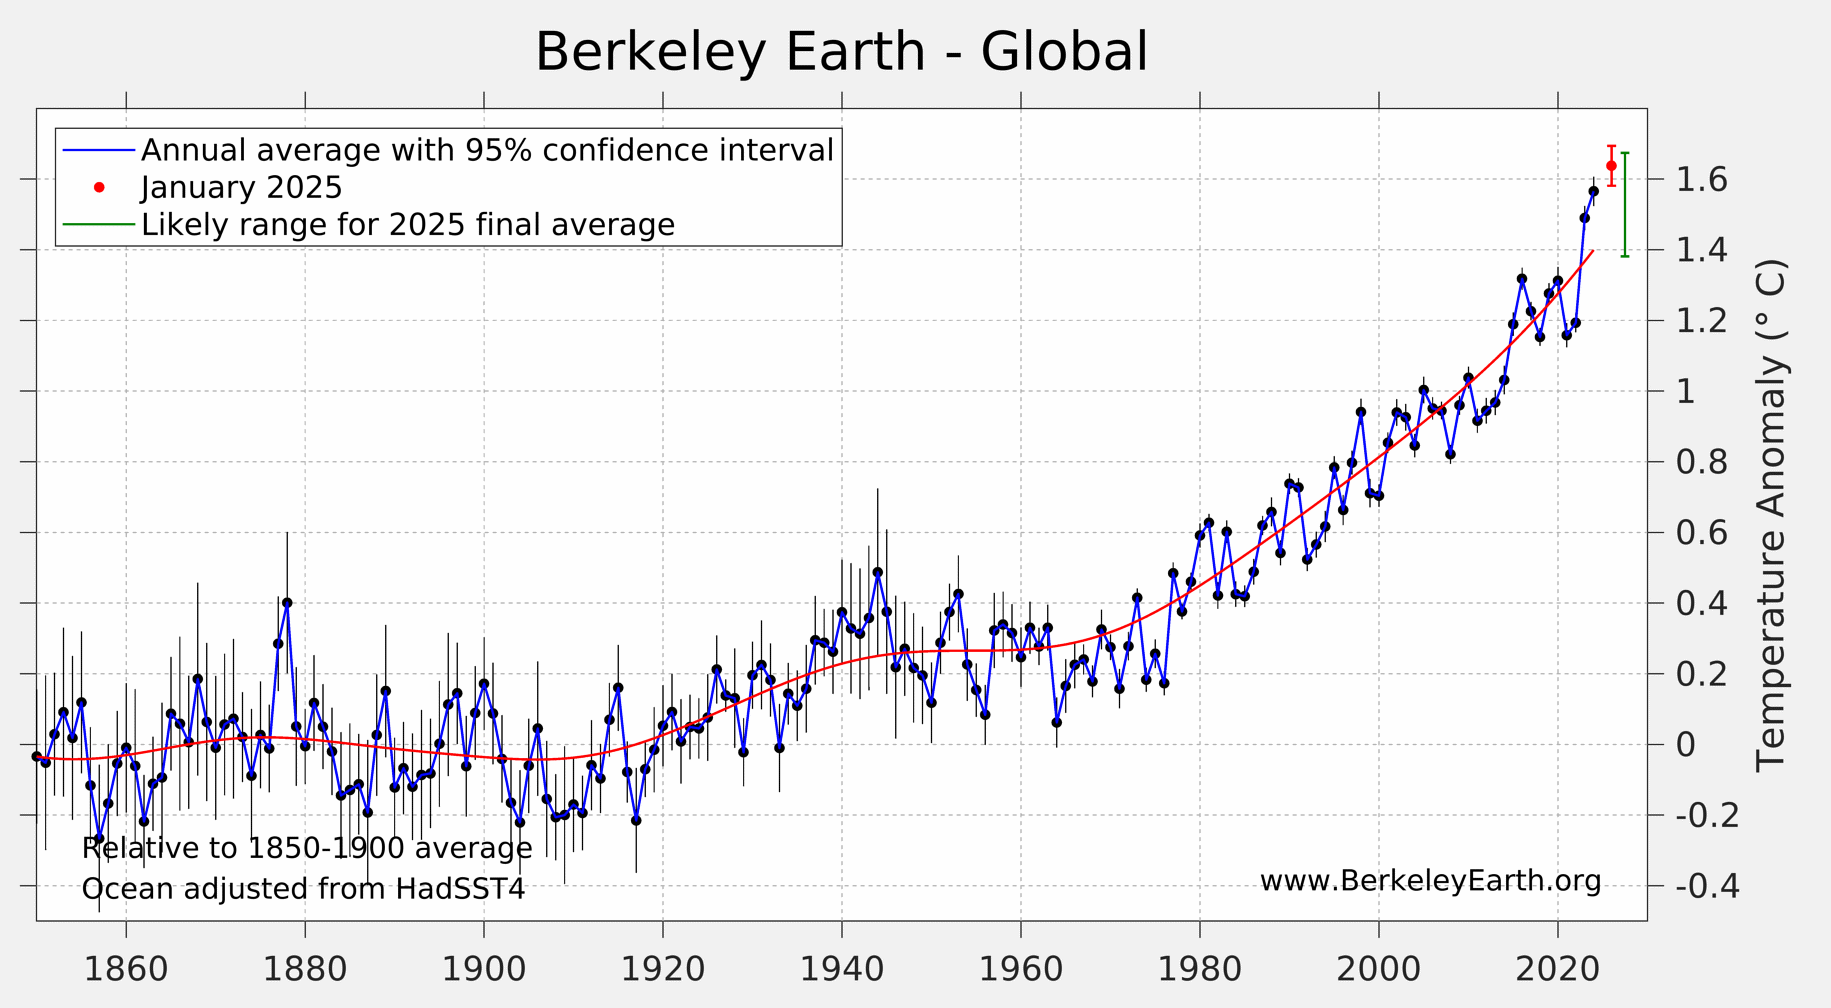
Globally, January 2025 was the warmest January since directly measured instrumental records began in 1850. January 2025 was measured as 1.64 ± 0.11 °C (2.95 ± 0.19 °F) above the corresponding 1850-1900 average. This is 0.09 °C (0.16 °F) warmer than the January 2024 record.
In addition, January 2025 marks the nineteenth consecutive month with global average temperatures at least 1.5 °C warmer than the corresponding 1850 to 1900 monthly average. The Paris Agreement target to limit warming below 1.5 °C (2.7°F) concerns the 20-year average, centered on the present year. Thus we will not know in real-time when exactly we surpass this threshold. However, recent studies suggest we have entered the 20-year period within which this target will be surpassed. Furthermore, we may pass this target sooner than expected unless significant reductions in greenhouse gas emissions are achieved.
The global mean temperature in January 2025 was surprisingly warmer than November and December, 2024, given the onset of a La Niña event in December.
The 12-month moving average of global mean temperature now stands at 1.57 ± 0.08 °C (2.83 ± 0.15 °F) above the 1850-1900 average. We expect to see cooling in February as La Niña conditions persist and we move further from a warm El Niño event.
Spatial Variation
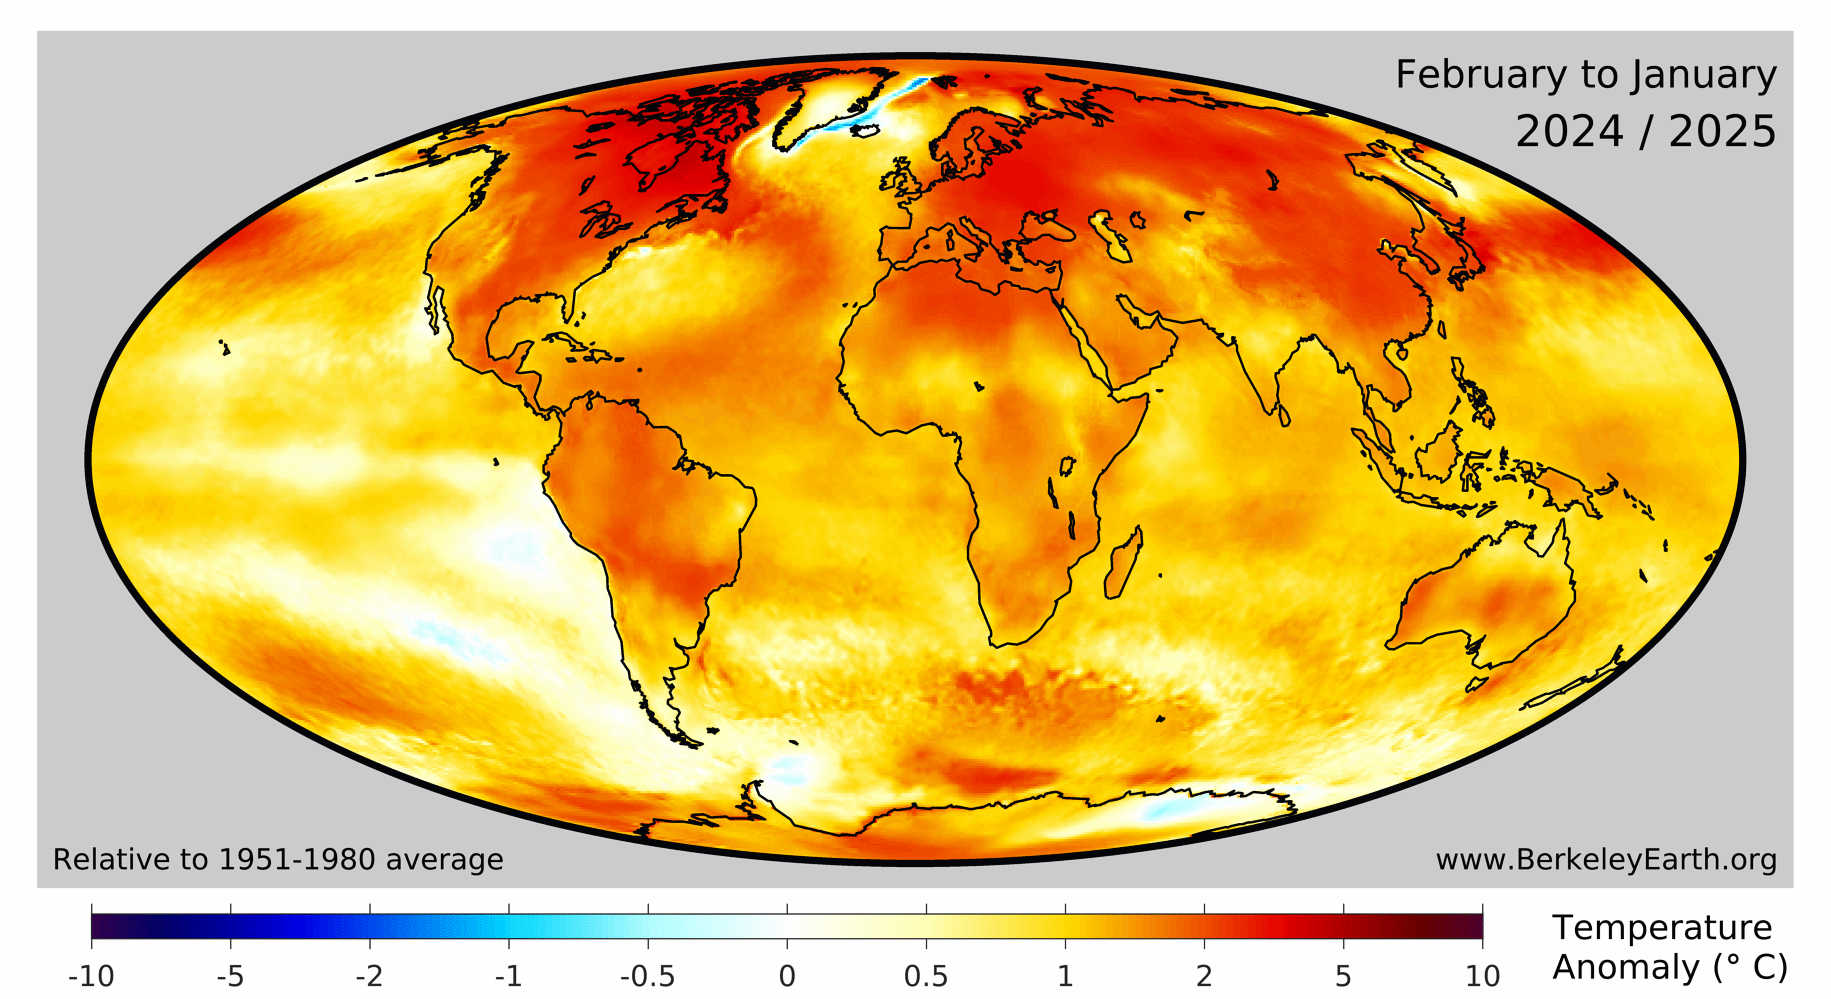
January 2025 exhibited warm temperature anomalies over Canada, Russia, and China, while much of CONUS experienced cooler conditions.
We estimate that 6.1% of the Earth’s surface experienced their locally warmest January average (including 8.2% of ocean areas), and 52% of the Earth’s surface was significantly warm when compared to their local average during the period 1951 to 1980. By contrast, 0.01% of the Earth’s surface had their locally coldest January.
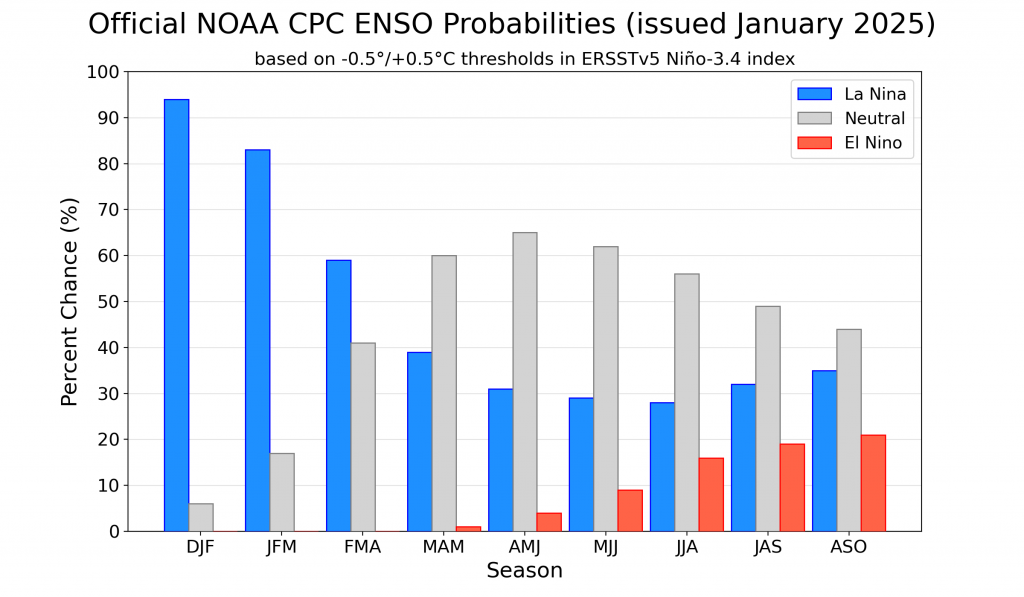
A La Niña event in the equatorial pacific was officially declared by NOAA in December 2024 and is likely to persist February – April (59% chance). Global cooling is generally associated with La Niña events, thus we predicted a cooler January compared to 2024 temperatures. However, temperatures are anomalously warm given La Niña conditions when compared to historical events.
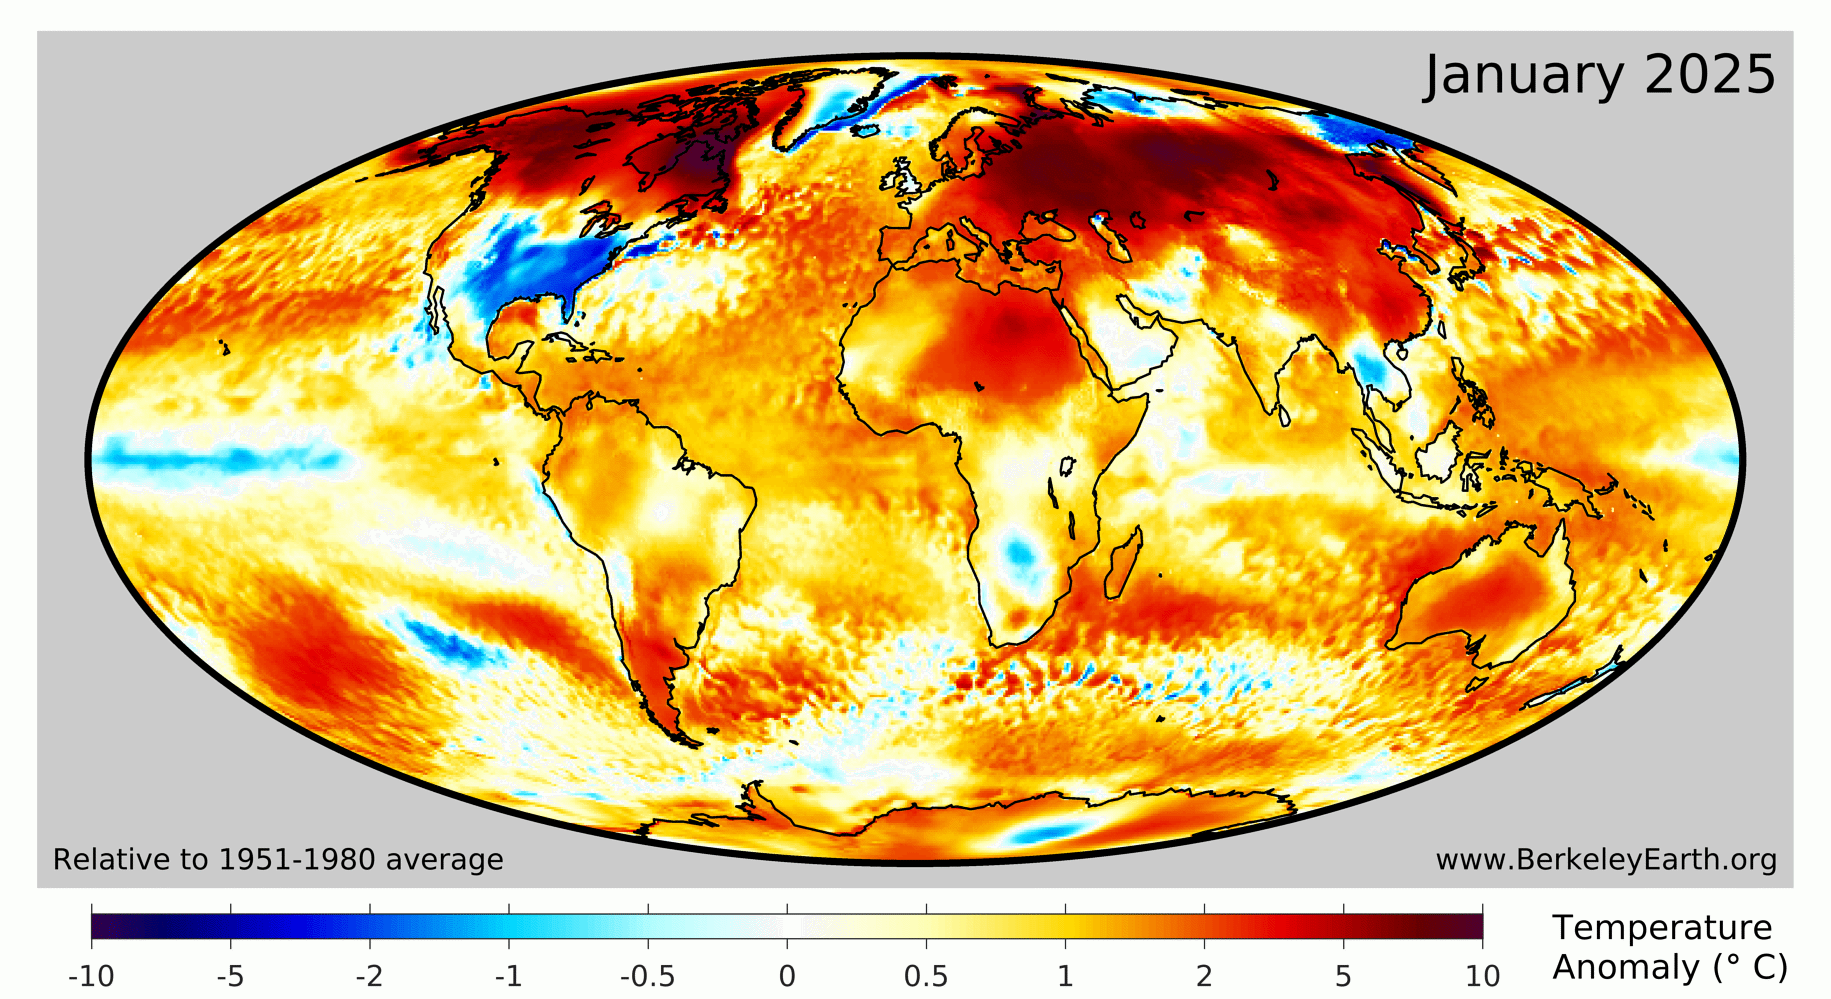
17 countries had a record warm national average in January: Antigua and Barbuda, Argentina, Barbados, Belarus, China, Comoros, Egypt, Grenada, Libya, Mozambique, Papua New Guinea, Saint Kitts and Nevis, Saint Lucia, Saint Vincent and the Grenadines, Seychelles, Somalia, Vanuatu. No continents as a whole experienced record warmth. In contrast, CONUS had its 55th coldest (or 122nd warmest) January since 1850.
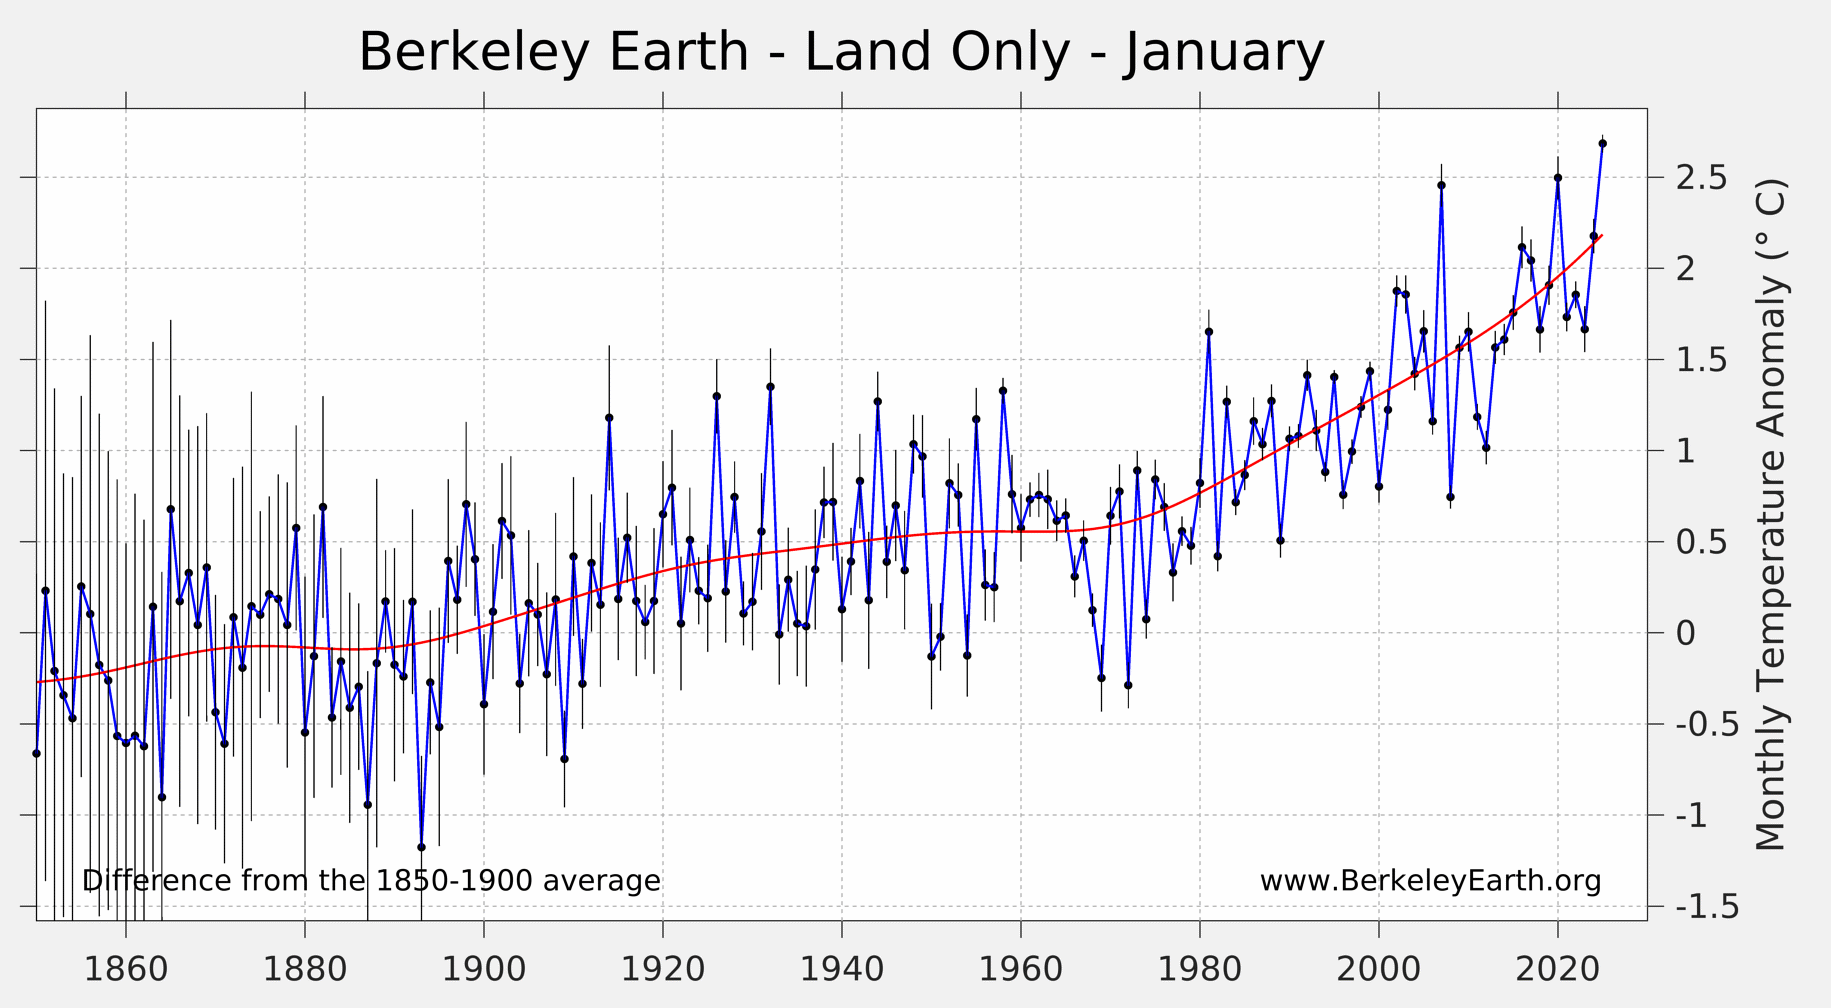
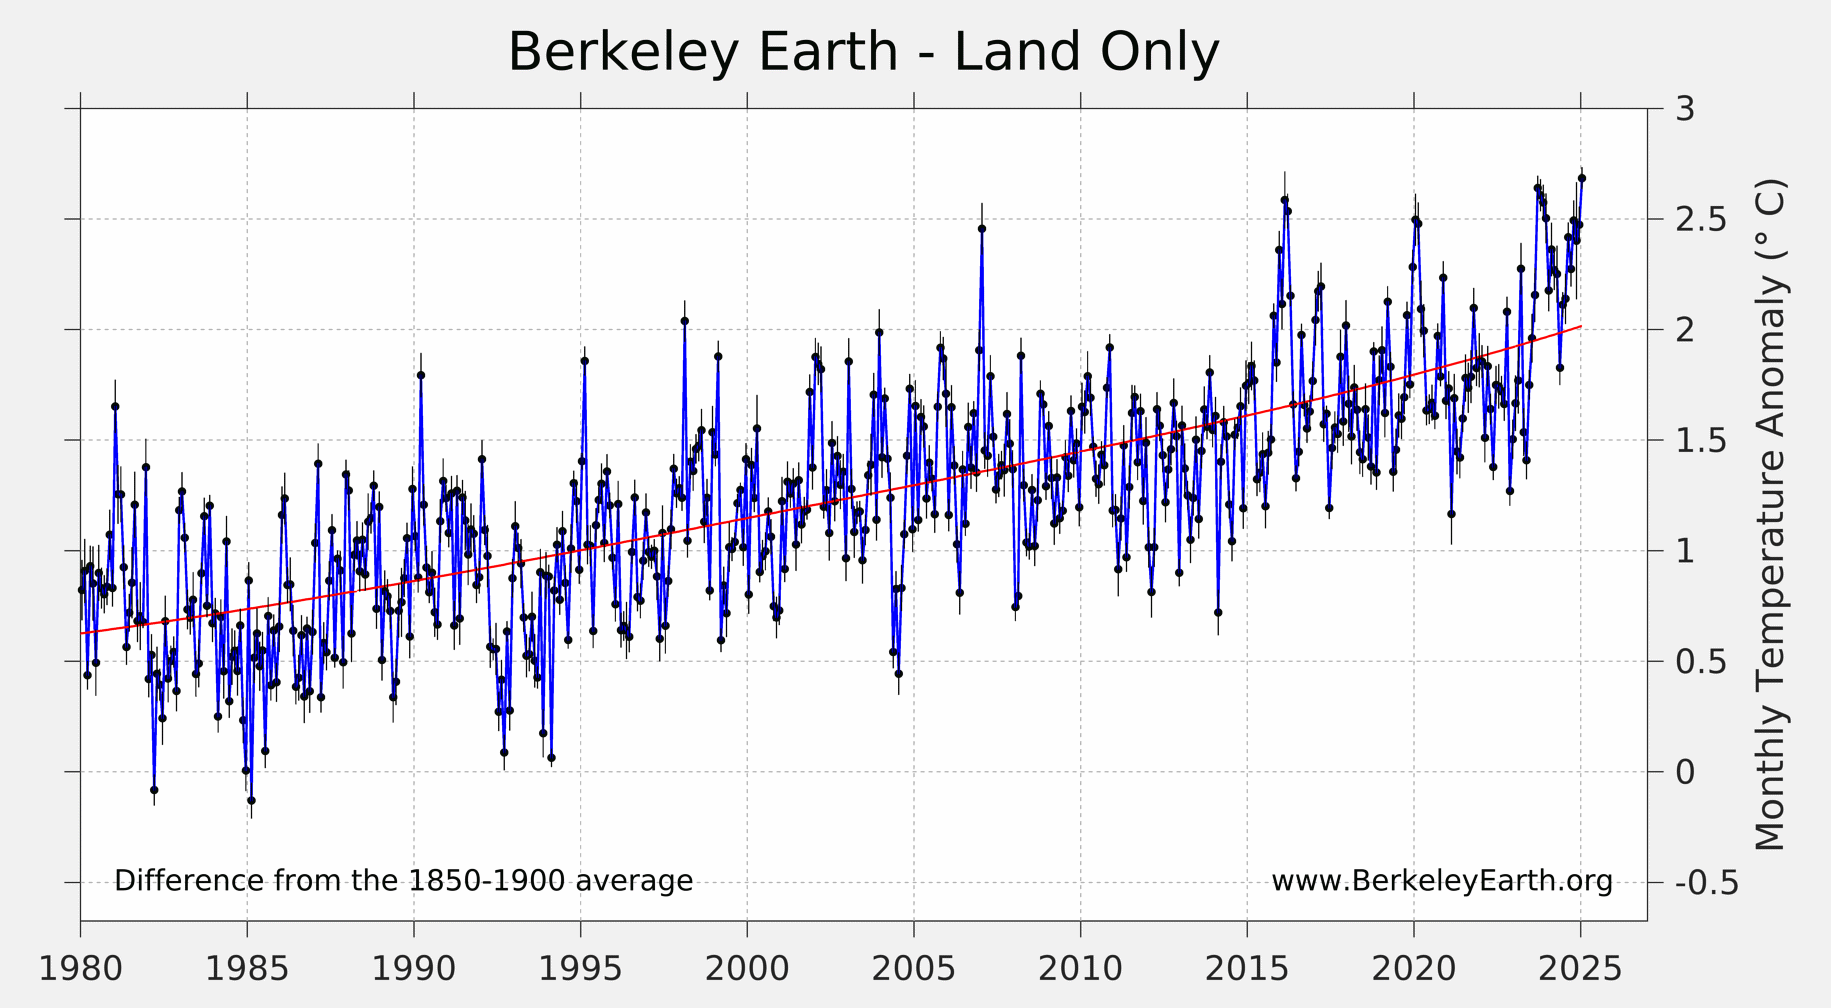
Over land regions, 2025 was the warmest January since 1850. The land average was 2.67 ± 0.15 °C (4.83 ± 0.26 °F) above the 1850 to 1900 average.
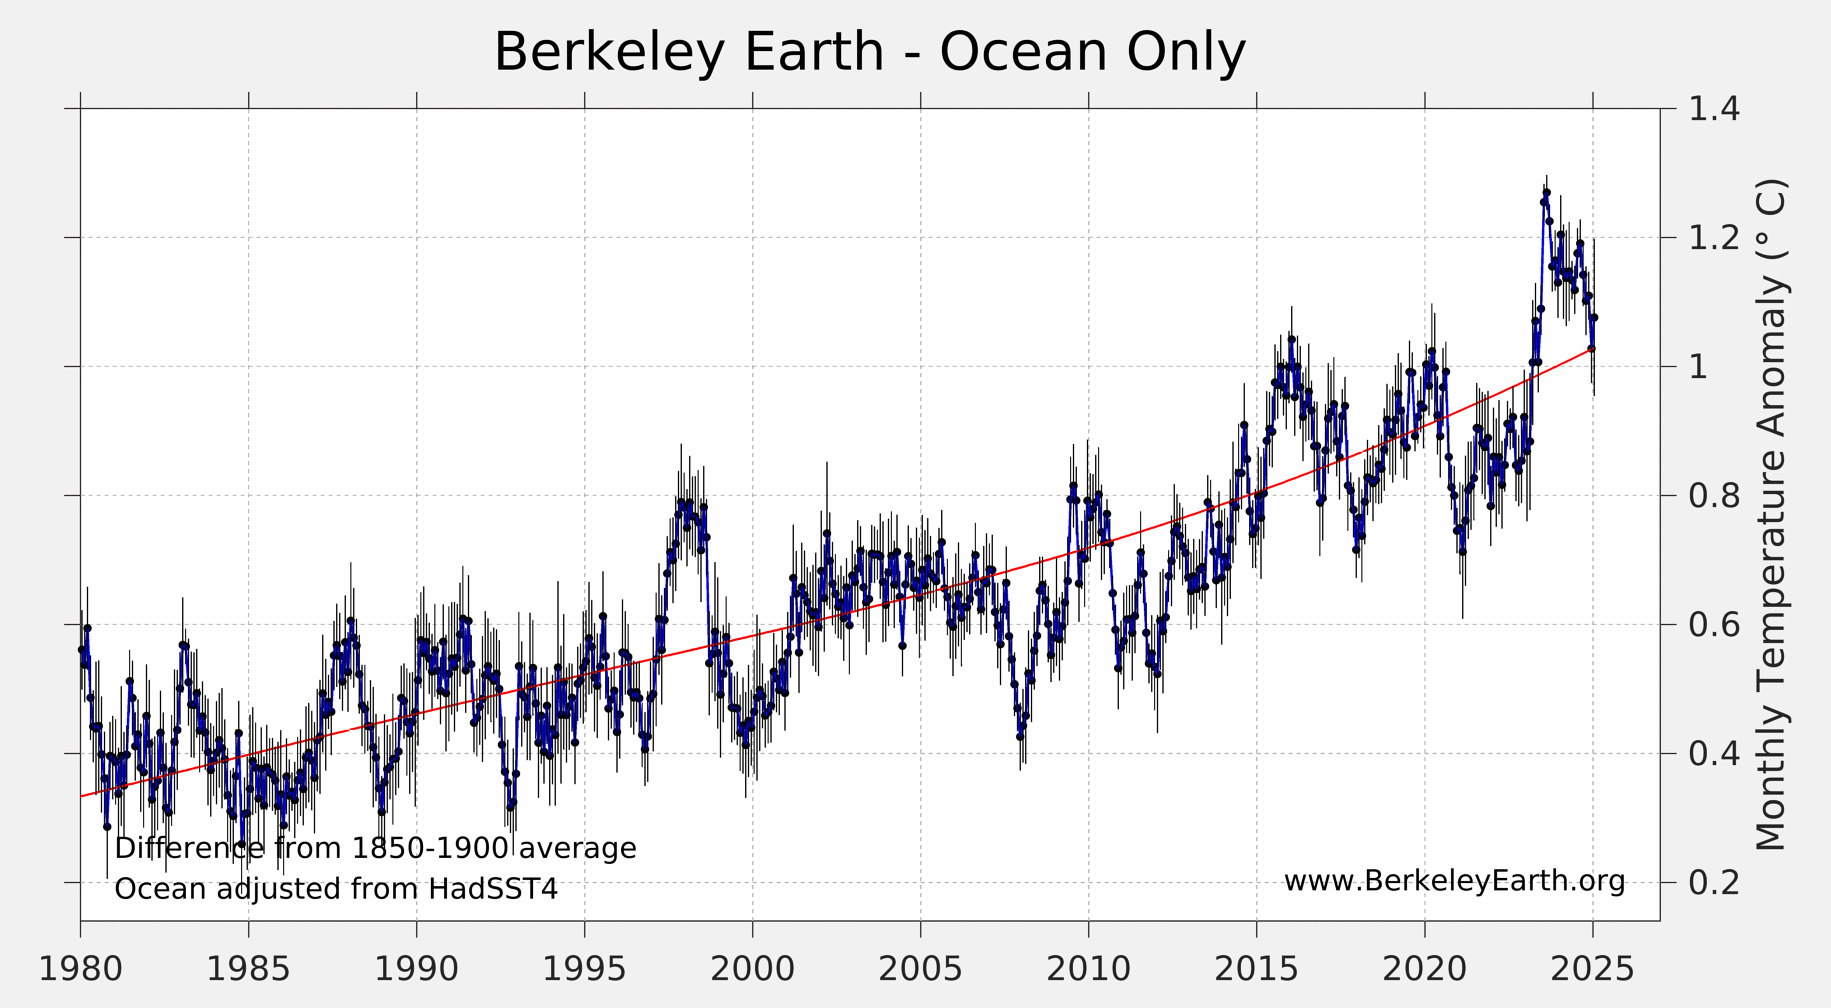
January 2025 was the second warmest January in the ocean average behind only January 2024. The ocean average temperature in January 2025 was 1.08 ± 0.13 °C (1.94 ± 0.23 °F) above the 1850 to 1900 average.

Considered in terms of the average over the last 12 months (February 2024 to January 2025), anomalously warm temperatures been measured in North America, Europe, Asia, North Africa, South America, and the Pacific, Atlantic, Arctic, and Southern Oceans. Furthermore, record breaking 12 month February-January averages have been observed in South America (Amazon), Mexico, Canada, Africa (Congo), Europe, Russia, China, and the Atlantic, Pacific, Indian, and Southern Oceans. No regions have significant relative cooling during this period.
An unexpectedly warm month
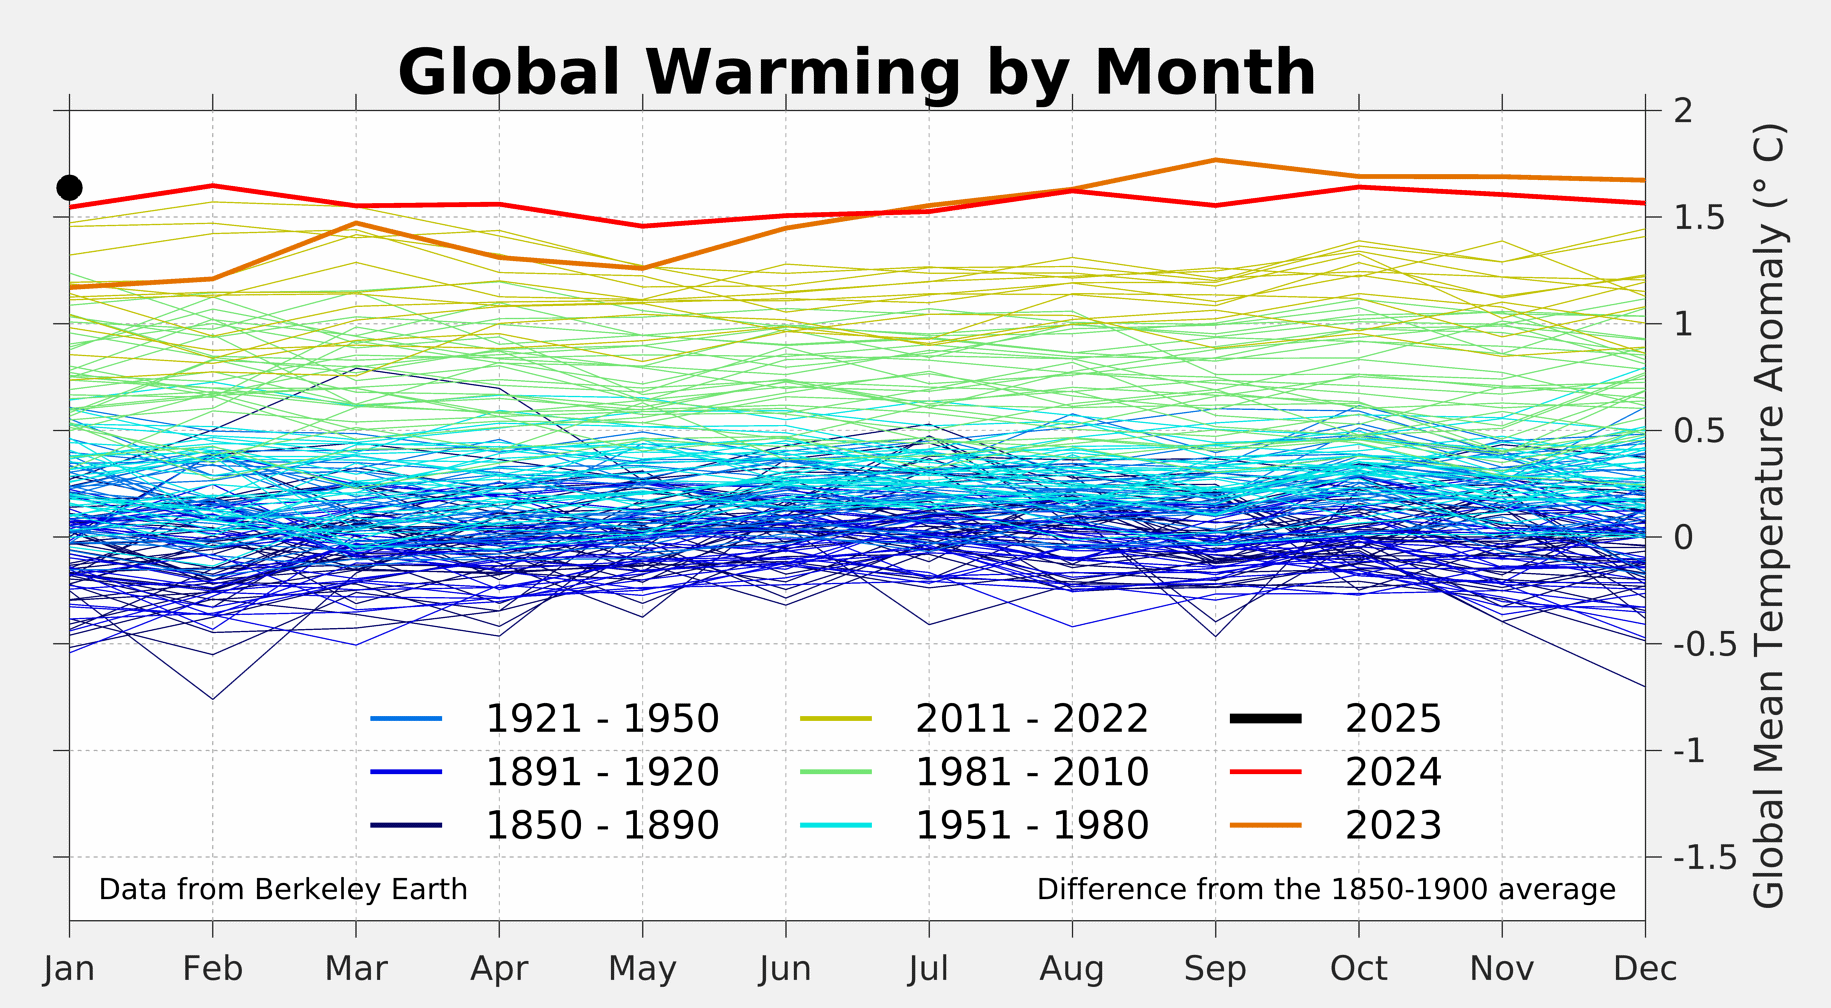
The end of El Niño conditions in the tropical Pacific in summer 2024 and the development of weak La Niña in the past two months should help push global temperatures downward in 2025 compared to the past two years. For that reason, it was quite surprising that global temperatures set a new record in January 2025, coming on the heels of 2024’s record January warmth that occurred shortly after El Niño conditions peaked.
The figure below shows all of the January temperatures in the Berkeley Earth dataset since 1950 along with their ENSO status (El Niño, La Niña, or neutral). The figure starts in 1950 as that corresponds with the ENSO dataset (NOAA’s Oceanic Niño Index – ONI) used.
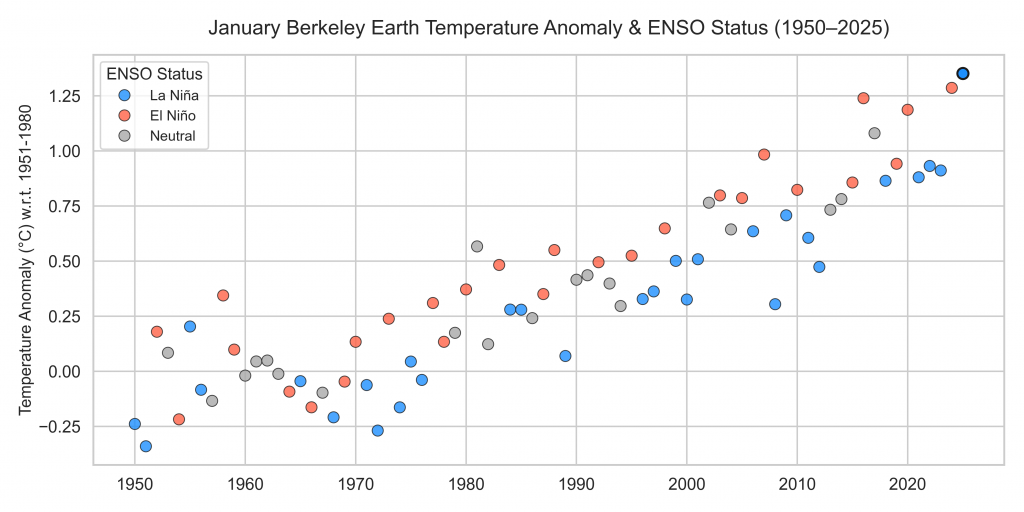
January temperatures have tended to be cooler than average during La Niña years and warmer than average during El Niño years, and there is only one other time in the historical record (1955) where a La Niña year set a new January record. It is not yet clear what contributed to this January’s unexpected warmth, or if it might be a harbinger of warmer-than-expected temperatures for the remainder of the year.
El Niño / La Niña Outlook
Mild La Niña conditions have developed in the tropical Pacific as of December 2024, and have continued into the start of 2025. This follows a strong El Niño event that peaked in November 2023 and persisted into the middle of the year. While there is generally a modest lag of two to four months between peak ENSO conditions in the Pacific and the maximum global temperature response, the effects of the 2023/2024 El Niño should have fully faded at this point in time, and the effects of the current La Niña should be established.
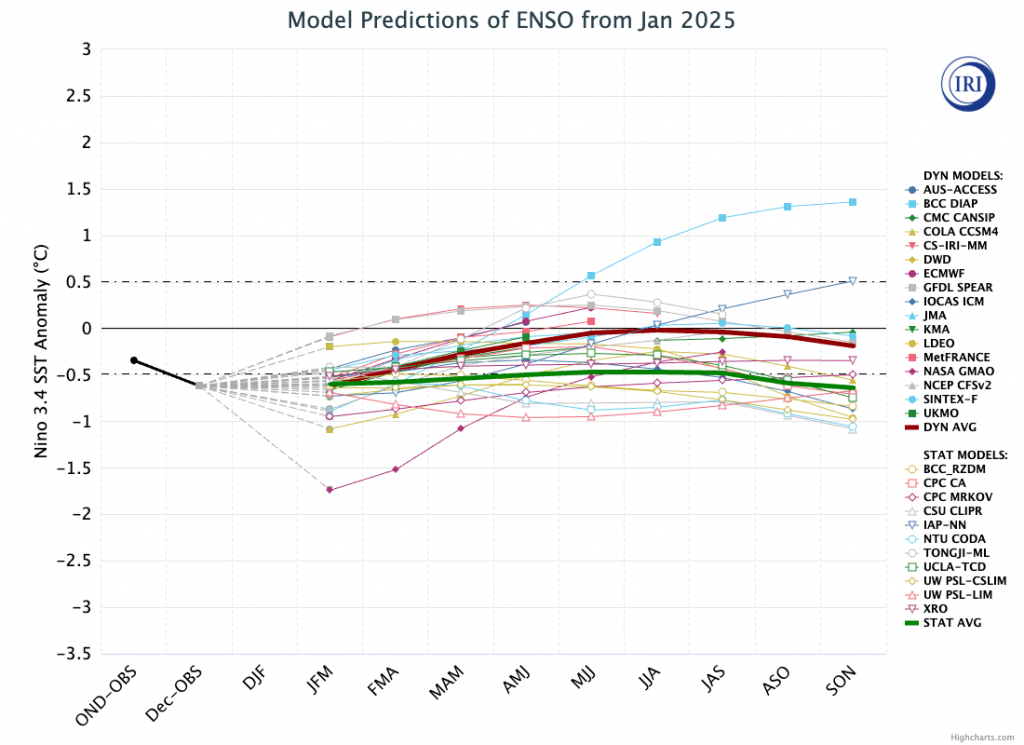
It is now considered likely that weak La Niña conditions will persist through at least the next few months, though there is large uncertainty due to the distribution of model simulations as shown in the figure below.
Rest of 2024
Due to warm January temperatures, our statistical outlook has calculated that 2025 has a 30% chance of being warmer than 2024, which would be the third consecutive warmest year on record.
Estimated Probability of 2025 Annual Average final rankings:
- 1st – 30%
- 2nd – 40%
- 3rd – 29%
This forecast probability of record warmth is substantially increased from the approximately 6% chance previously estimated at the start of the year, reflecting the effect of the unexpectedly high January global temperatures on the annual estimate. However, global temperatures have modestly cooled in reanalysis products in the first week of February and are projected to continue to decline, suggesting that January’s record warmth may prove anomalous relative to the remainder of the year.