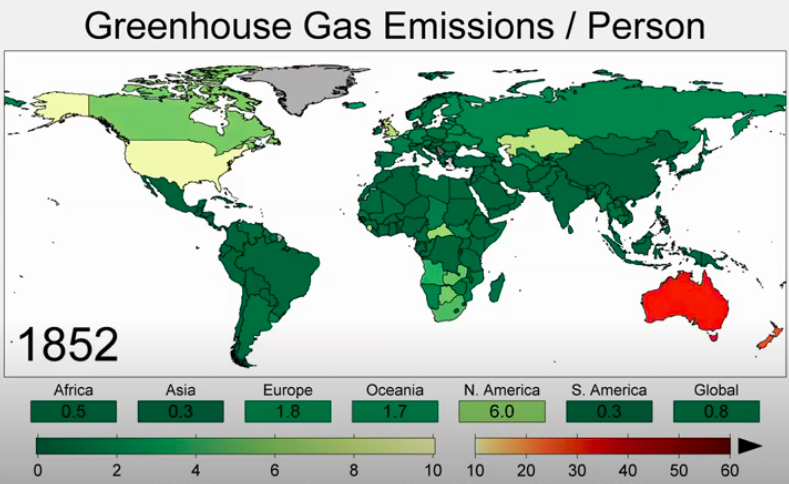
Animated map showing the changes in greenhouse gas emissions per person from 1850 to 2016.
Emissions data from PRIMAP-hist v2.0, population data fro HYDE v3.2. Both data sets were adjusted by their authors to redistribute historical data relative to current national boundaries. Different greenhouse gases are combined based on their 100-year global warming potential.SHOW LESS
Data visualization ©Dr. Robert Rohde