The following is a summary of global temperature conditions in Berkeley Earth’s analysis of March 2025.
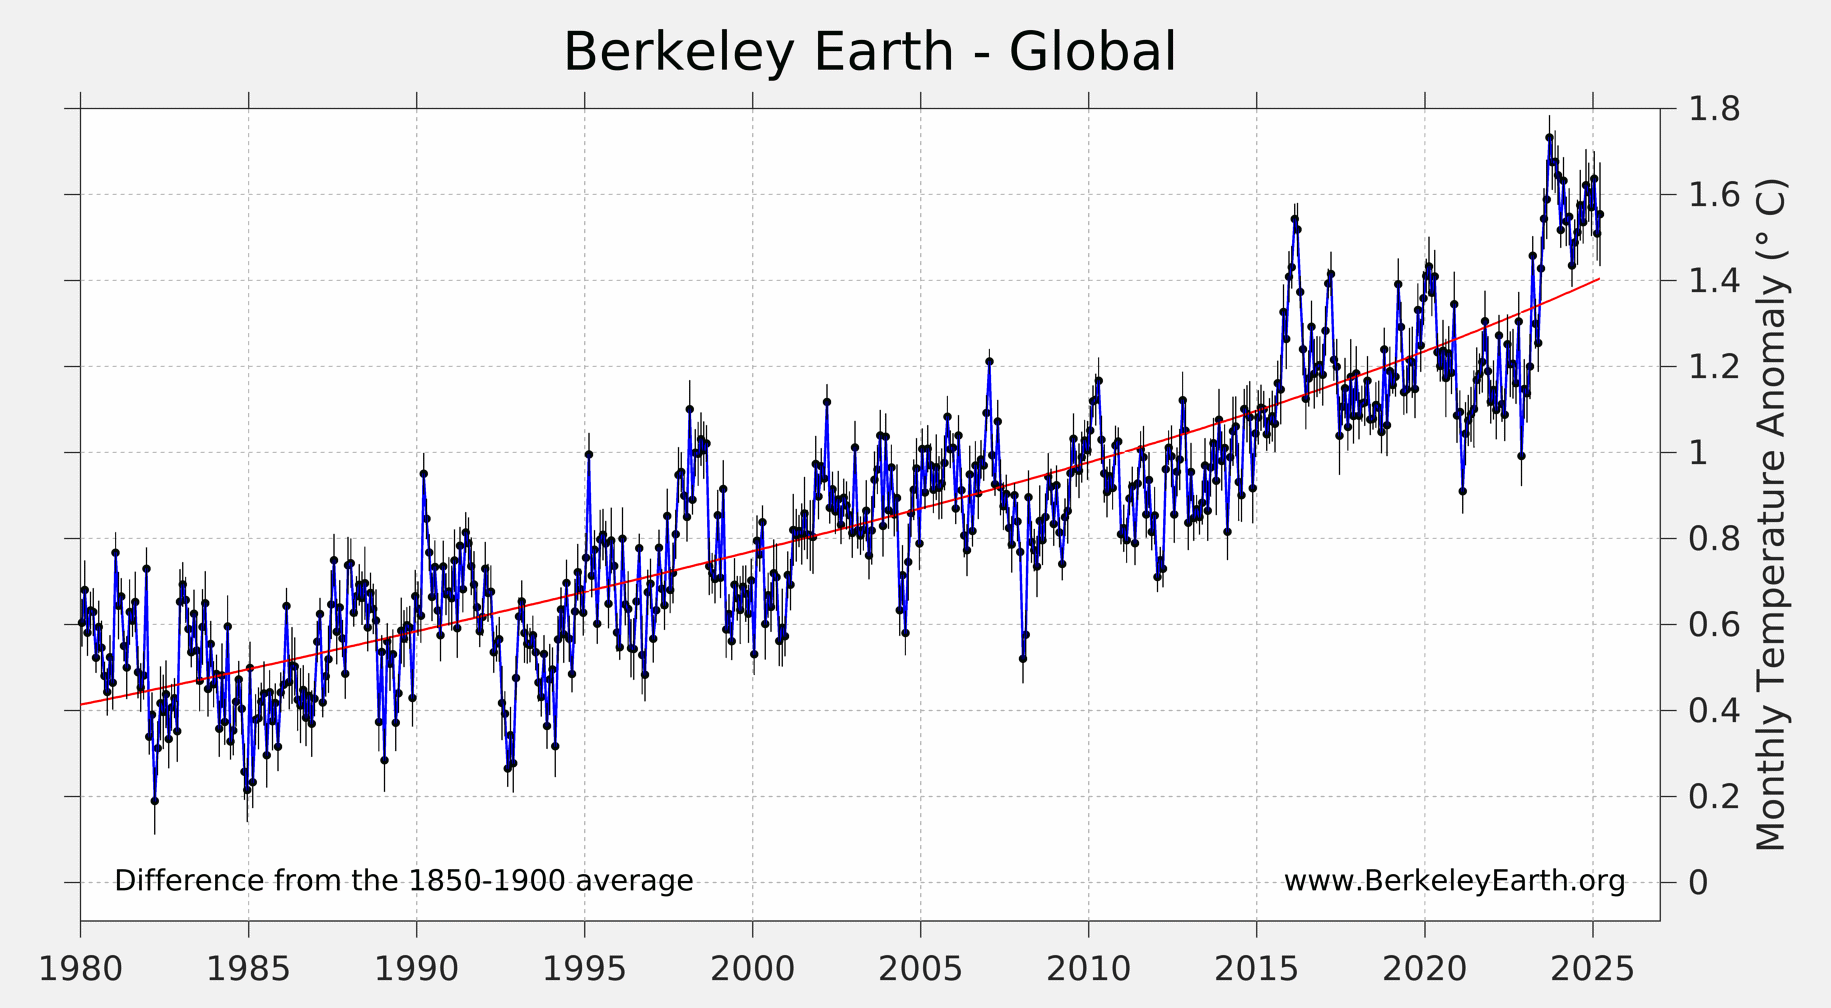
- March 2025 tied for the warmest March on record, with global average temperatures of 1.55 ± 0.15 °C (2.32 ± 0.22 °F) above the 1850-1900 average.
- Temperatures were nominally warmer than March 2024 and March 2016 by 0.02 °C and 0.04 °C, respectively. Due to the overlapping uncertainties, these temperatures are essentially equal.
- ENSO transitioned from La Niña to a neutral state. Neutral conditions will likely persist throughout the summer.
- Lowest Arctic sea ice extent in the 47-year satellite record, beating the previous low set in 2017 by 150,000 square kilometers (58,000 square miles).
- 2025 now has a 34% chance to be the warmest year and 46% chance to be the second warmest year on record.
Global Summary
According to Berkeley Earth’s high resolution temperature dataset, March 2025 was as the warmest March to have been directly observed with a monthly average of 1.55 ± 0.15 °C (2.32 ± 0.22 °F) above pre-industrial levels (1850-1900). However, temperatures were only nominally warmer than 2024 and 2016, and due to overlapping uncertainties these three months are essentially tied. While we measure March 2025 to be 0.02 °C and 0.04 °C warmer than 2024 and 2016, respectively, Copernicus ranked March 2025 as the second warmest March and NOAA reported the third warmest March.

While February dropped slightly below the 1.5°C threshold set by the Paris Agreement (with a global average of 1.49 °C), March promptly carried temperatures back across the threshold. And although temperatures remain slightly cooler than the warm conditions observed in 2023 and 2024, the global average remains significantly higher than the long-term trend.

We had been expecting that the cycle of short-term warming that brought records in 2023 and 2024 would likely have peaked following the dissipation of El Niño last year, and that some temporary relative cooling would follow in 2025. However, temperatures during the first three months have remained quite warm. As discussed below, a possibility remains that 2025 could be as warm or warmer than 2024.

Spatial Variation
In March 2025, elevated temperatures were present nearly everywhere. Particularly warm temperature anomalies occurred over Eastern Europe, Western Russia, the Arctic, North America, the Sahara and Australia. Cold anomalies were present in Northern Canada between Hudson Bay and Alberta.
Approximately 4.3% of the Earth’s surface experienced their locally warmest March on record (2.4% and 5.3% of land and ocean surfaces respectively). In our estimation, five countries set national average monthly records in March: Australia, Cyprus, Mali, Mauritius, Ukraine

Over land regions, 2025 was the second warmest March since 1850 (behind 2016), with a terrestrial average of 2.41 ± 0.23 °C (4.34 ± 0.41 °F) above the 1850 to 1900 average. After a temporary cooling in February, March temperature anomalies over land returned to a level similar to that seen in other recent months.


Average ocean temperatures in March 2025 were equal to 1.05 ± 0.13 °C (1.89 ± 0.23 °F) above the 1850 to 1900 average. This was the second warmest March for the ocean average, behind 2024. Overall, the ocean average trend continues to shows modest cooling following the dissipation of the 2023/2024 El Niño. However, ocean averages remain more elevated than one might have anticipated following the recent short-lived La Niña event, and have not broken below the long-term trend line.


The 12-month anomaly map continues to show warm temperatures in the Northern Hemisphere high latitudes, with extremes in Canada and Russia. Again, no regions have significant relative cooling compared to the 1951-1980 average.

Record breaking 12 month April – March averages have been observed in Eastern Europe and Russia, the southern United States and Mexico, the Caribbean, Central/East Asia, and Central/North Africa. Record breaking temperatures have also been recorded in each ocean basin.
Transition to ENSO Neutral
The brief period of La Niña conditions over the last few months have given way to an ENSO neutral state, which will likely last throughout August-October (greater than 50% chance). The forecast is less certain for next winter, with roughly equal probabilities of maintaining ENSO neutral and transitioning back to a La Niña state. A less likely chance, roughly 20%, exists of a return to El Niño later this year. Due to the nature of weather conditions in the Pacific, future El Niño/La Niña states are hard to predict in the early spring, but often become more clear in the summer.


Record Low Arctic Sea Ice Extent
The annual maximum extent of Arctic sea ice typically occurs in March near the end of Northern hemisphere winter. This year the extent of Arctic sea Ice at its annual maximum was the lowest since satellite tracking began in 1979, reaching only 14.14 million square kilometers (5.46 million square miles) which is lower than the previous record set in 2017 by 150,000 square kilometers (58,000 square miles).

On average, the March monthly average sea-ice extent has declined by approximately 2.5% per decade and has lost 1.71 million square kilometers (660,000 square miles) since 1979.

Rest of 2025
The rest of 2025 is more likely than not to cool slightly from the temperatures observed in January through March. If it does so, then 2025 will likely be slightly cooler than the record warmth observed in 2024. However, the possibility of unusual warmth or a return to El Niño conditions can not be ruled out. There is now a 34% chance that 2025 will be the warmest year on record. This is down only slightly from the 38% chance forecast at the end of last month. The current uncertainty surrounding the El Niño / La Niña state this fall and winter is the largest contributor to uncertainty in the annual average forecast.
Estimated Probability of 2025 annual average final rankings:
- 1st – 34%
- 2nd – 46%
- 3rd – 20%
- 4th or lower – < 1%
