This post was originally published in The Climate Brink newsletter.
It’s truly been a summer of extremes. Heat waves scorch multiple countries, the past 20 days have been the 20 warmest days on record for the planet, June shattered the past record and July is on track to do the same. Ocean sea surface temperatures are way above anything previously recorded, particularly in the North Atlantic. And Antarctic sea ice concentrations are shockingly far below normal for this time of year.
All of this raises the question: whats going on with the climate? Is this just the expected effect of a developing El Nino event on top of long-term human driven warming, or is something else at play. Is it a sign – as some more alarmed folks warn – of a climate quickly spiraling out of control?
The Earth is an incredibly complicated system, and scientists will have to spend time disentangling the different causes of this summer’s extreme temperatures. While its clear that long term human-driven warming set the stage for what we are seeing and a growing strong El Nino event is amplifying it, other factors such as the phaseout of sulphur in marine fuels and the large amount of water vapour injected into the stratosphere by the 2022 Hunga Tonga-Hunga Ha’apai volcano are likely contributing as well.
We know that climate change will continue as long as our emissions remain above (net) zero, and we even expect some acceleration in our models in scenarios where greenhouse gas emissions continue to increase and emissions of planet-cooling aerosols fall. So how can we find out if this summer is worse than we expected, or simply as bad as we expected? We can take a look at what our climate models told us to expect, and compare it to what actually happened.
Global surface temperatures
The latest generation of climate models (CMIP6) was developed in the lead-up to the recent IPCC 6th Assessment Report. We can look at what the models expected would happen in July 2023, and compared it to what we actually observed in the real world. Lets start with global surface temperatures.
The figure below shows the daily global surface temperature anomaly from ERA5, the most accurate and state-of-the-art reanalysis product thats available today. The black line shows the temperature anomaly (difference from a 1991-2020 baseline period) for each day in 2023, compared to the current warmest year on record (2016) in red and all other years between 1940 and 2022 in grey. Note that this data lags a bit behind present, and only currently goes through July 18th.
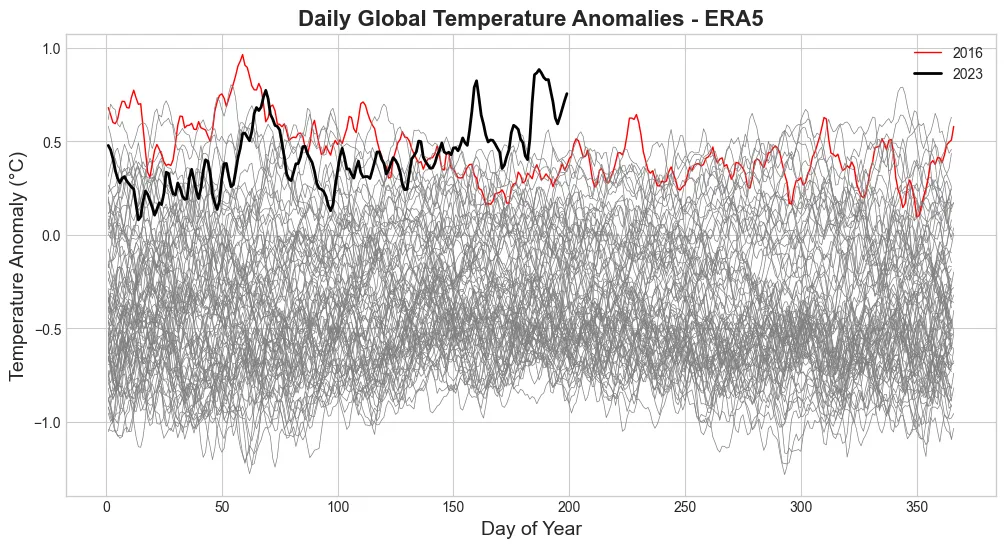
July 2023 has been exceptionally warm over the first 18 days, falling approximately 0.7C above the 1991-2020 baseline period used by the dataset. We can take the latest generation of climate models and look at how a temperature anomaly of 0.7C for July compares to the range of model projections (assuming the rest of the month stays similarly warm).
This is shown in the figure below: the dark blue line represents the multi-model mean (e.g. the average of all models), while the light blue are shows the 5th and 95h percentile range across all 40 model runs available for the current-policy-type SSP2-4.5 scenario.
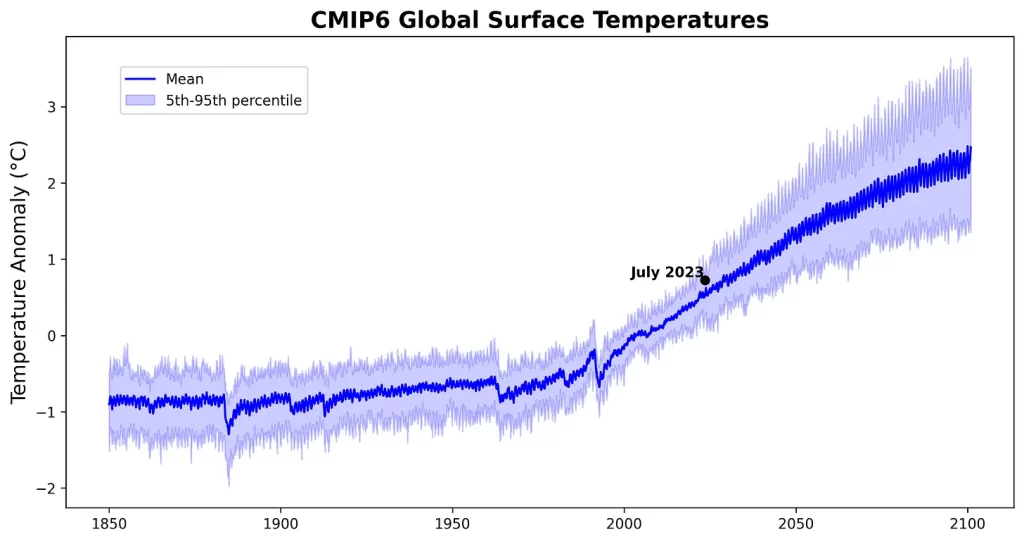
Here we see that while July 2023 is above the multimodel mean, it is well within the range of expected temperatures across all the participating models. This is not surprising, as we would expect observations to be above the multimodel mean during an El Nino event. If anything, CMIP6 models have been running a bit hot globally over the past decade, so we cannot make the case that the world as a whole is warming faster than projected based on these models.
Ocean temperatures
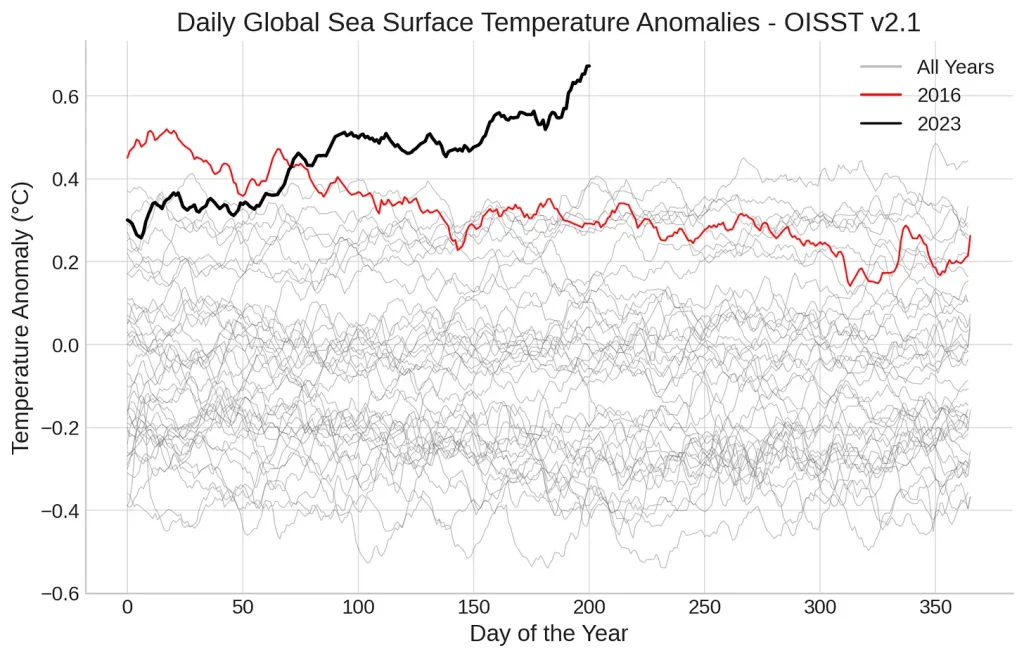
While global temperatures have been unusually warm compared to prior years, its been the oceans that have really shattered prior records for this time of year. The figure below shows the global mean sea surface temperatures between 60S and 60N from NOAA’s OISST v2.1 dataset. The black line shows 2023, the red line shows 2016, and the grey lines show all other years since the dataset began in 1981.
Now let’s compare these sea surface temperatures to what climate models project for the same region. Here we don’t have easy access to climate model SSTs, so I’m comparing the modeled surface air temperatures over the ocean to observed sea surface temperatures. This might introduce some slight biases, but should be generally similar.
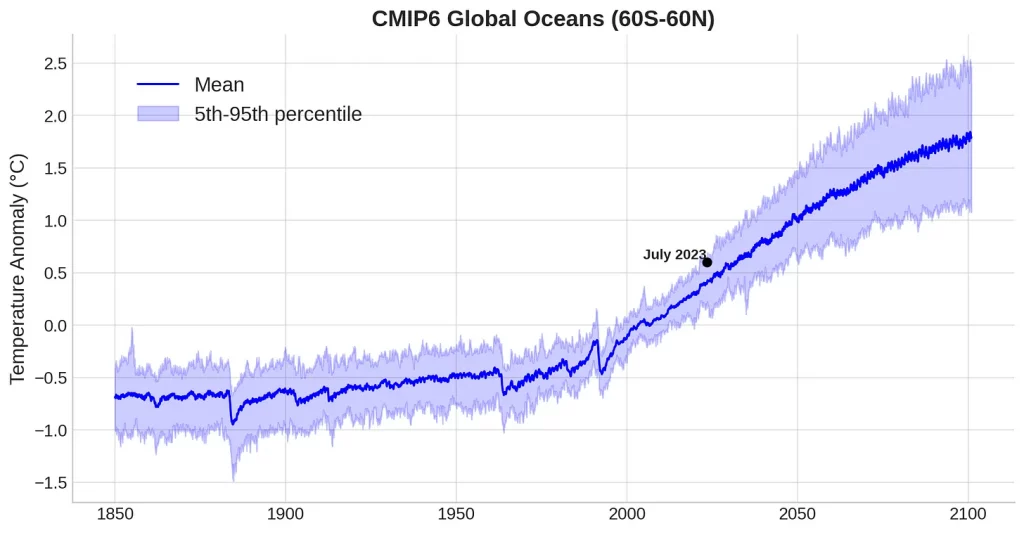
Here we see that while July 2023’s record ocean temperatures are well above the multi-model mean, they are solidly in the range of what we would expect across the 40 CMIP6 models. Again, its hard to say that this is necessarily worse than we expected, but rather is as bad as we expected during in the presence of a growing strong El Nino event.
North Atlantic temperatures
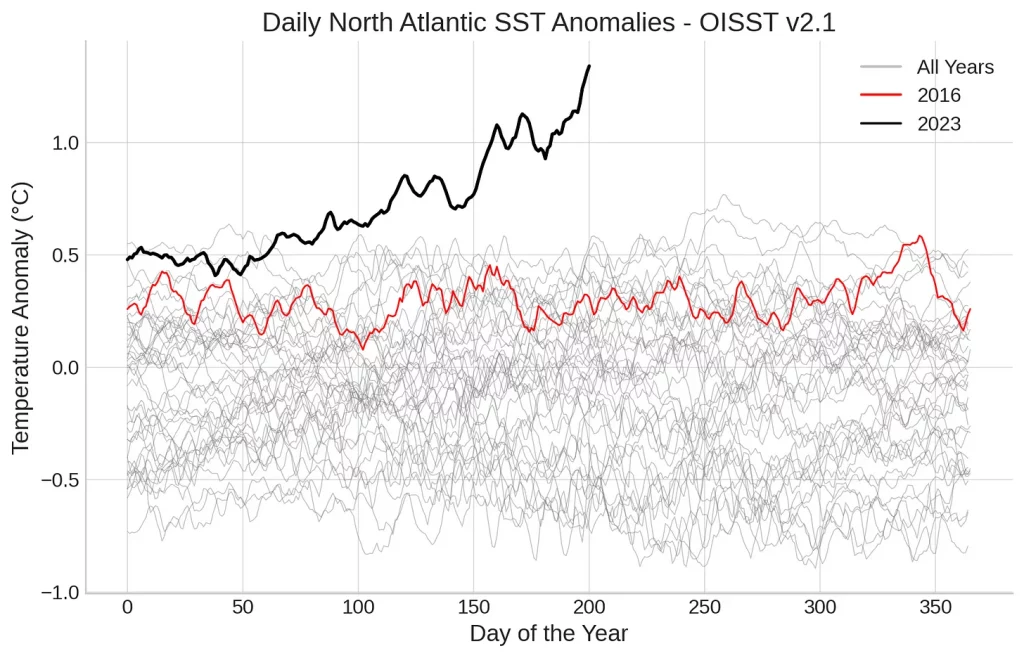
Finally, lets look at the North Atlantic which has been quite literally off the charts in July – in the sense that we’ve had to extend the y-axis of our charts to appropriately show the data.
The figure below shows sea surface temperatures from OISST v2.1 over the North Atlantic region (0-60N, 0-80W). July 2023 temperatures are in black, 2016 in red, and all other years in grey.
When we compare these to climate model projections, we see that July 2023 was slightly above the 95th percentile of model runs in the North Atlantic.
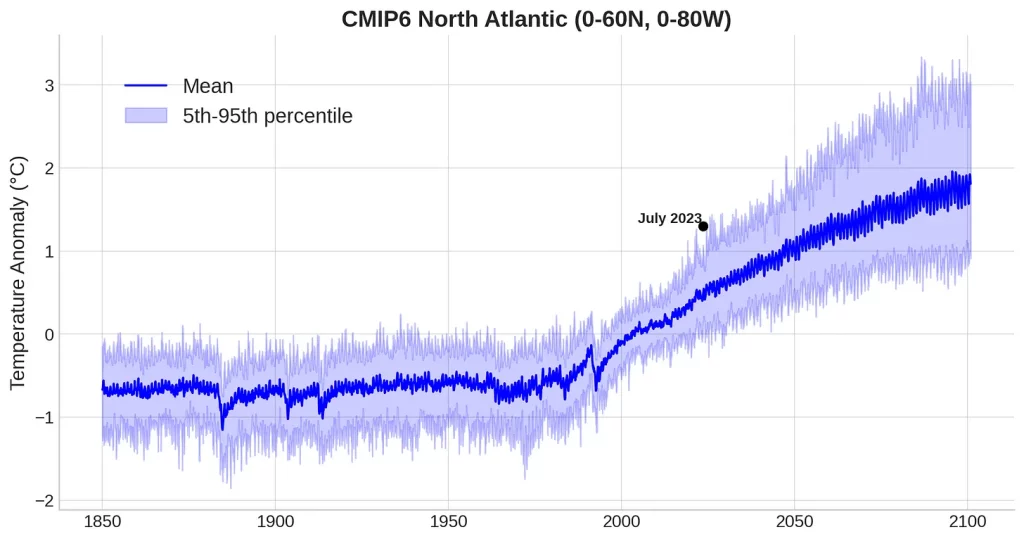
Here we do have some evidence that something exceptional is happening to North Atlantic sea surface temperatures, with anomalies in July outside the range of what was projected by CMIP6 models. The specific drivers of this anomaly (sulphur phaseout in fuels, dynamics around Saharan dust, or other factors) are still under investigation by scientists so it will be some time before we know for sure whats driving these regional extremes.
The takeaway
Climate change is real, caused by human activity, and is increasingly damaging to society. The world will not stop warming until our emissions of CO2 get down to (net) zero. We know its going to get worse as long as we keep emitting CO2 and other greenhouse gases. Just because things are not “worse than we thought” in terms of global temperatures does not mean that the problem is not severe and getting worse.
The fact that climate models capture the extremes we are seeing this summer (for the most part) is, ultimately, a good thing. There is no evidence that we are passing particular tipping points that are contributing to significant additional warming today. A climate we understand and can model is one where we can more effectively design policies to reduce emissions and limit warming to well-below 2C.

