The following is a summary of global temperature conditions in Berkeley Earth’s analysis of August 2025.
- August 2025 was the third warmest August on record behind 2023 and 2024, with a global average of 1.42 ± 0.14 °C (2.56 ± 0.25 °F) above the 1850-1900 average.
- Land temperatures averaged 1.85 ± 0.27 °C (3.33 ± 0.48 °F) above the 1850-1900 average, ranking as the 4th warmest August for terrestrial regions.
- Ocean temperatures were 1.08 ± 0.13 °C (1.94 ± 0.23 °F) above the 1850-1900 average, making it the third warmest August for ocean surfaces.
- The end of August also marks the end of the third warmest Northern Hemisphere Summer, with a 3-month global average of 1.36 ± 0.11 °C (2.44 ± 0.20 °F).
- ENSO-neutral continues, however, there is now a 71% chance for a La Niña transition between October – December.
- 4.6 % of Earth’s surface experienced a record high August monthly average (3.7% and 5.1% of land and ocean surfaces respectively).
- 2025 now has a 95% likelihood to be the third warmest year on record and a scant 1.2% chance to have an annual average above 1.5 °C.
Global Summary
August 2025 was the third warmest August on record, with a monthly global average of 1.42 ± 0.14 °C (2.56 ± 0.25 °F) above the 1850-1900 average. This places August 2025 about 0.2 °C lower than August 2023 and 2024, but still significantly above every other August.

Month-to-month temperatures tick upward markedly in August 2025 to match the long-term trend line, deviating the relative cooling trend observed during most of 2025.

This is the fourth consecutive month below 1.5°C, however monthly average temperatures for 2025 remain warmer than every year before 2023.

Even with the cooling over the past few months, the 12-month moving average remains well above the long-term trend line. However, it appears clear that the short-term natural variability contributing to anomalous warmth in 2023 & 2024 has peaked, and we expect the 12-month average will soon return towards the trend line, or even move somewhat below it. Short-term variability is an inherent part of the weather and climate and is to be expected even alongside persistent long-term global warming.

Spatial Variation
In August 2025, elevated temperatures were prevalent across Canada, parts of Antarctica, southern and western Europe, south and central Africa, as well as the North Pacific and the Arctic.

Approximately 4.6% of the Earth’s surface experienced their locally warmest August on record (3.7% and 5.1% of land and ocean surfaces respectively), with record warmth in the Northern ocean basins and Central Africa, and in the oceans near Australia.
Over land regions, August 2025 was the fourth warmest August since 1850, with a terrestrial average of 1.85 ± 0.27 °C (3.33 ± 0.48 °F) above the 1850 to 1900 average. This is sharply cooler than in 2023 and 2024 but close to the long-term trend line. On a month-to-month basis, August temperatures on land ticked up slightly from values seen in recent months.


Average ocean temperatures in August 2025 were equal to 1.08 ± 0.13 °C (1.94 ± 0.23 °F) above the 1850 to 1900 average. This was the third warmest August (again behind 2023 and 2024), and close to the long-term trend line. Like July, August temperatures in the ocean have warmed slightly prior months.


Northern Pacific Warming
Temperatures in the Northern Pacific are running at all-time records (for any month), and reaching temperature anomalies that are more typical of land areas than large oceanic basins. This warming continues a long-term trend over the last three decades, but which may have accelerated recently.

Compared to climate model expectations, the currently temperatures in the Northern Pacific would have a <1% chance of occurring in any single year. In addition, the divergence between the observed trend and the predicted climate model trend strongly suggests that these changes are not simply a short-term weather fluctuation. It appears more likely that recent Northern Pacific warming has been moving faster than models anticipated for this part of the world.

A likely explanation for faster than anticipated warming in the Northern Pacific is potential role of recent reductions in sulfur aerosol pollution. Beginning in 2020, new international regulations (IMO2020) mandated an ~80% reduction in the sulfur content of marine shipping fuels. When burned, sulfur creates aerosols that reflect sunlight and have a local/regional cooling effect. In regions like the North Pacific and the North Atlantic, where international shipping is the most prolific, such aerosols may have reduced local temperatures by a few to several tenths of a degree Celsius. Suddenly removing such aerosols would then have the potential to lead to additional short-term warming in those regions where shipping emissions have historically been the largest.

The effect of reducing sulfur aerosols in the North Pacific and North Atlantic could increase local temperatures. This is likely contributing in part to the current record warmth in the Northern Pacific and similar record warmth seen in 2023/2024 in the Northern Atlantic. The scale of the effect, expected to locally be a few to several tenths of a degree Celsius in shipping regions, does not seem large enough to explain the entire divergence between Northern Pacific temperatures and climate models, but may explain a significant part of it. We have discussed the potential impact of IMO2020 sulfur reductions in previous reports.
3-Month Average (N.H. Summer)
The 2025 Northern Hemisphere Summer (June, July, August) is the third warmest on record (behind 2023 and 2024), with a 3-month average equal to 1.36 ± 0.11 °C (2.44 ± 0.20 °F).

Input Data Issues
This month included unusual glitches in the input data reported via NOAA’s Global Historical Climatology Network. In particular, a network of approximately a dozen stations in northeast Russia reported erroneous record lows and a somewhat smaller network of stations in South Africa reported erroneous record highs. This was unusually problematic because Berkeley Earth usually relies on neighboring station consistency as the primary tool for assessing data quality and identifying outliers. Having a dozen stations all reporting similar errors can escape the initial quality screens.
We discussed this issue with colleagues at NOAA, who are investigating. We ultimately implemented additional outlier filtering in our analysis as applied to the August input data and reran the main analysis. The identified erroneous data is not otherwise included in this report.
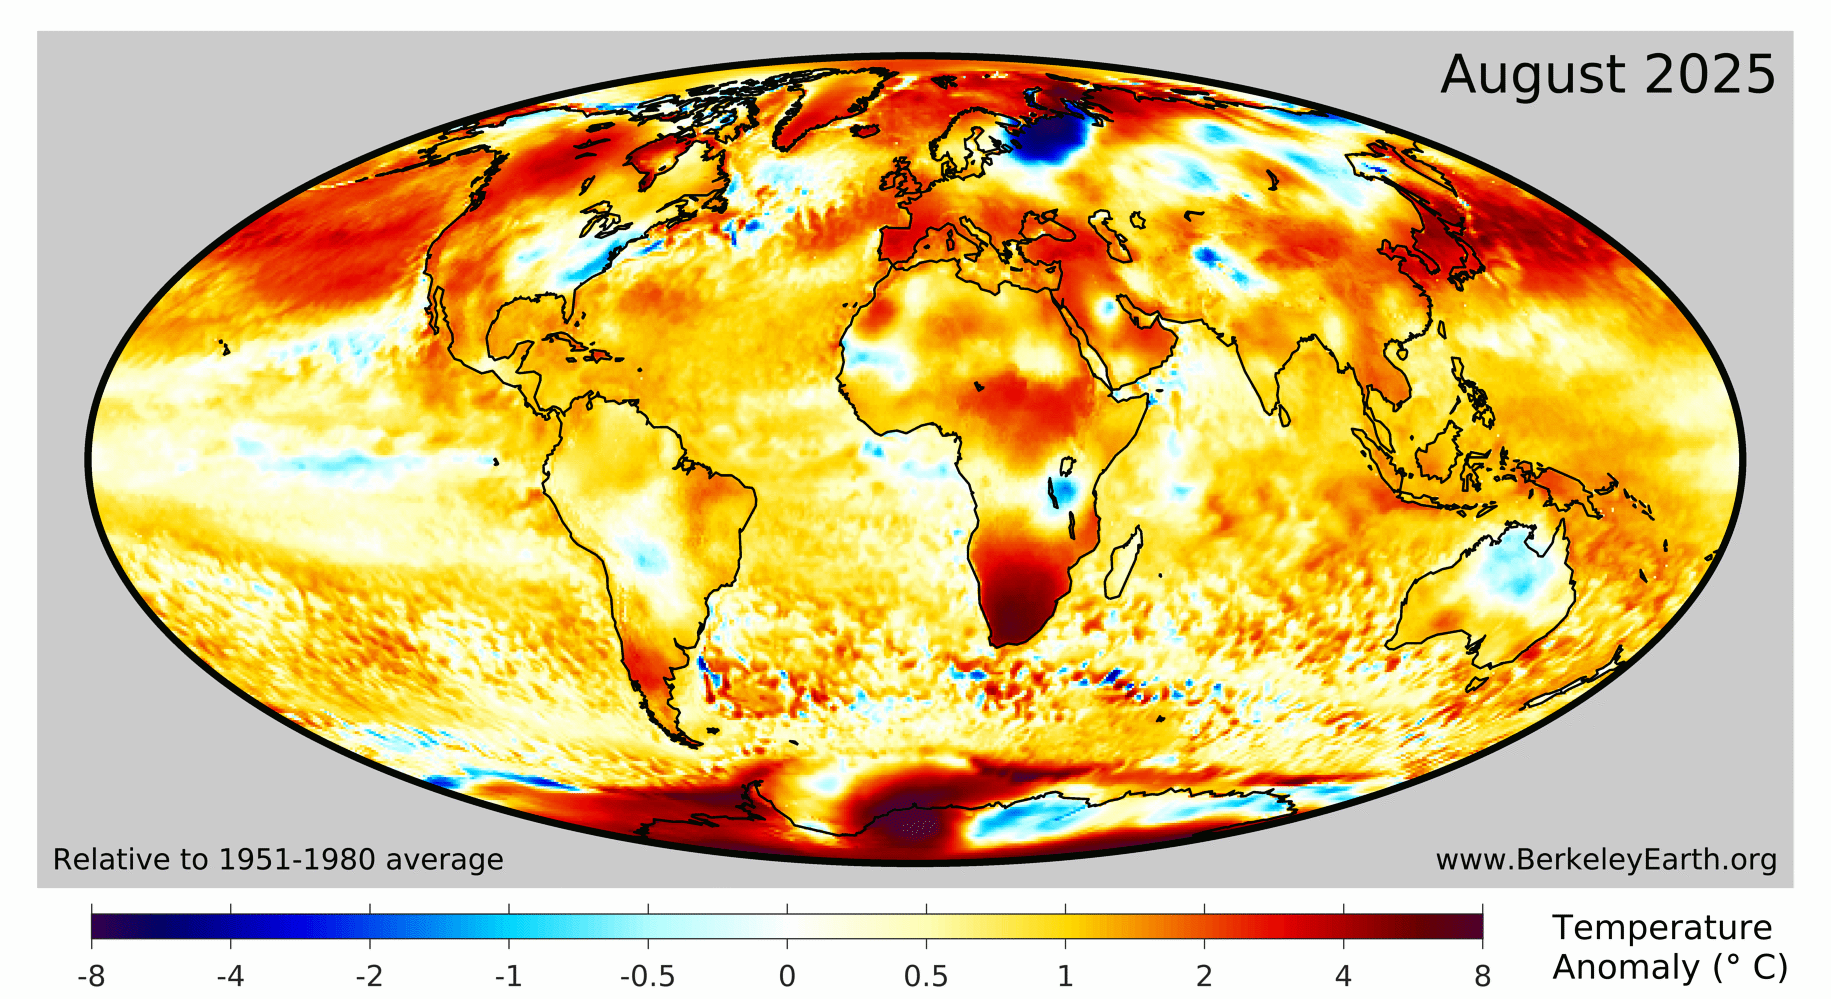 Initial analysis including erroneous data | 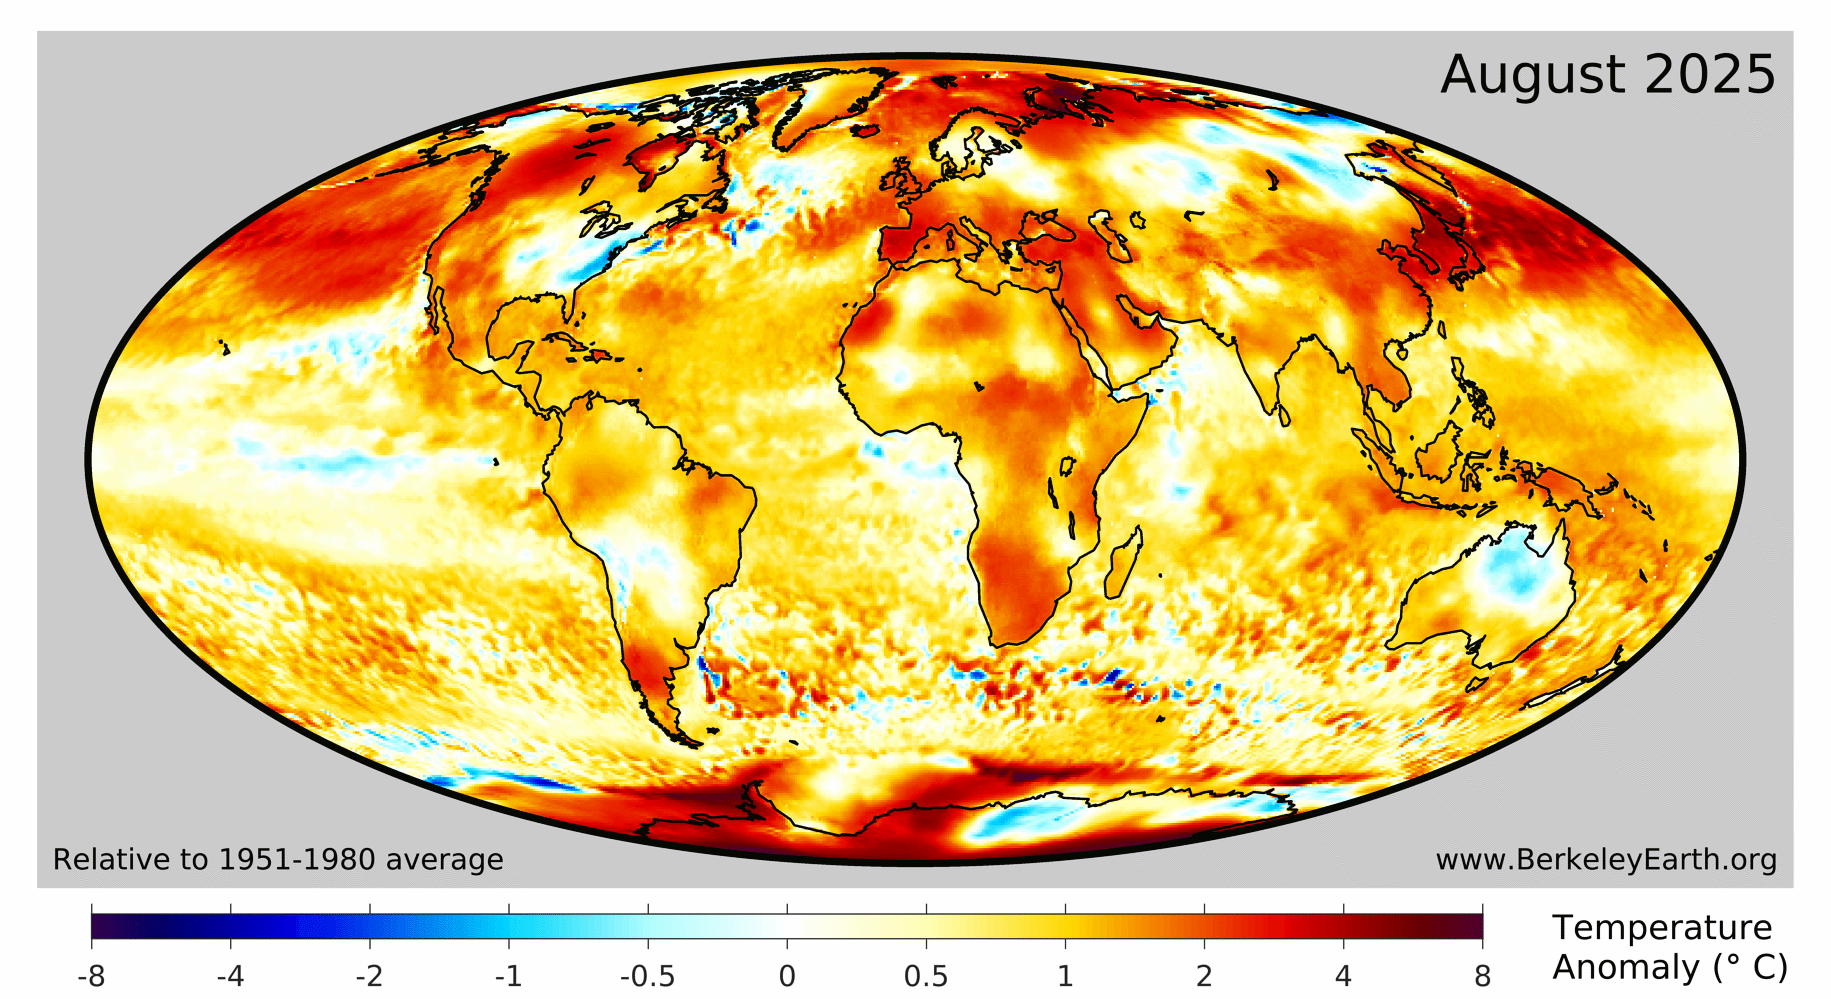 Final analysis after additional outlier filtering |
ENSO Neutral
The equatorial Pacific officially remains in an ENSO-neutral state with cooling indicating a likely return to La Niña conditions in the near future.
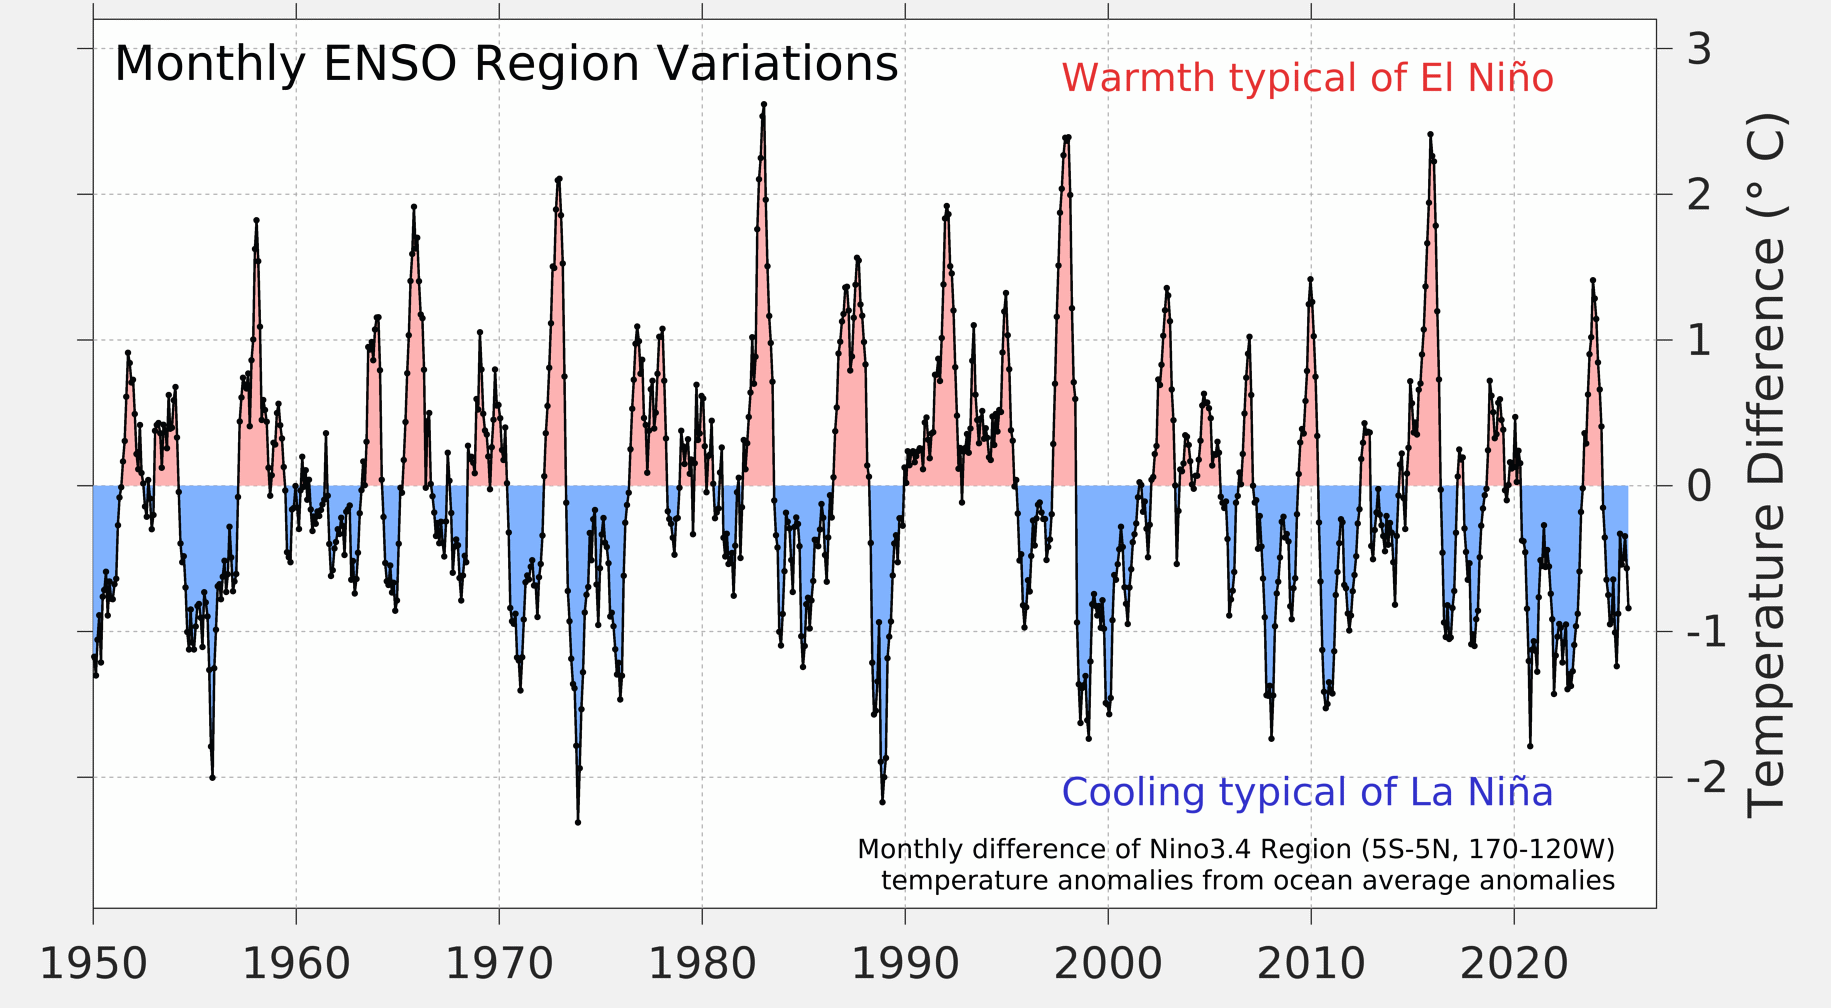
Forecast models suggest that ENSO-neutral conditions are likely to continue through the rest of the Northern Hemisphere summer. La Niña conditions now have a 71% of returning between October and November, 2025. For more information, see the Climate Prediction Center report here.


2025 Outlook
We now calculate a next-to-nothing chance that 2025 will be the warmest year on record. Furthermore, there is a 1.2% chance that global average temperature anomalies for 2025 exceed the 1.5 C (2.7 °F) benchmark above the 1850-1900 average.
Estimated Probability of 2025 annual average final rankings:
- 1st – < 1%
- 2nd – 4.7%
- 3rd – 95.2%
- 4th or lower – < 1%
