Berkeley Earth, a California-based non-profit research organization, has been preparing independent analyses of global mean temperature changes since 2013. The following is our report on global mean temperature during 2023.
We conclude that 2023 was the warmest year on Earth since 1850, exceeding the previous record set in 2016 by a clear and definitive margin.
The global annual average for 2023 in our dataset was estimated as 1.54 ± 0.06 °C (2.77 ± 0.11 °F) above the average during the period 1850 to 1900, which is traditionally used a reference for the preindustrial period. This is the first time that any year has exceeded the key 1.5 °C (2.7 °F) threshold. The significance of this is discussed below. Also, please note that given the uncertainties and differences in methodologies, other groups are expected to report 2023 as slightly less than 1.5 °C above preindustrial. The differences between Berkeley Earth’s analysis and that of other groups is discussed at the end of this report.
The last nine years have included all nine of the warmest years observed in the instrumental record.
The long-term trend towards higher temperatures is being driven by man-made global warming. However, year-to-year rankings are likely to reflect short-term natural variability. In 2023, an emerging El Niño event combined with other natural and man-made factors discussed below to create a record-breaking warm year. By contrast, 2021 and 2022 had somewhat lower temperatures due to a persistent a La Niña event. The cyclic warming and cooling due to El Niño and La Niña is one of the largest sources of year-to-year internal variability in the global average temperature, often adding or subtracting 0.1 °C from the global average.
2023 was a highly unusual year in several respects, including record warmth in most ocean basins and a large deviation from the historical trend. Warmth in 2023 greatly exceeded expectations, and was much stronger than normal this early in an El Niño. Some studies have recently argued that the pace of global warming may be accelerating, and some of the evidence for this is discussed below. However, given historical variability in surface temperatures, it still remains too early to conclude whether or not the pace of surface warming has increased.
During 2023, 17% of the Earth’s surface had a locally record warm annual average. By chance, these areas coincided with a number of major population centers. We estimate that 2.3 billion people — 29% of Earth’s population — experienced a locally record warm annual average in 2023. This includes half the population of China, and a majority of the populations of Bangladesh, Japan, Mexico, as well as much of South and Central America.
None of the Earth’s surface had a record cold annual average in 2023.
As discussed below, we believe there are slightly better than even odds that 2024 will be warmer than 2023.
In addition, 2023 was notable for:
- New national record high annual averages for an estimated 77 countries, including Bangladesh, Brazil, China, Germany, Japan, and Mexico
- Record annual average warmth in both the land-average and ocean-average
- Record warmth in most ocean basins, including once-in-a-century levels of warmth in the North Atlantic
- Record low Antarctic sea ice during the Antarctic winter
- An emergent strong El Niño event, contributing significantly to the record warmth
Annual Temperature Anomaly

In Berkeley Earth’s analysis the global mean temperature in 2023 is estimated to have been 1.54 ± 0.06 °C (2.77 ± 0.11 °F) above the average temperature from 1850-1900, a period often used as a pre-industrial baseline for global temperature targets. This is ~0.17 °C (~0.30 °F) warmer than the previous record high observed in 2016. As a result, 2023 is the warmest year to have been directly observed using thermometer measurements, and stands out well-above all previous years.
This is the first time that an annual average temperature has exceeded the pre-industrial baseline period by more than 1.5 °C (2.7 °F).
Under the Paris Agreement, many countries have set an aspirational goal of limiting long-term global warming to no more than 1.5 °C (2.7 °F). That target is based on the state of the climate averaged over many years, so it is not automatically considered to have been breached by a single year exceeding 1.5 °C of warming. However, a single year exceeding 1.5 °C is a stark warning sign of how close the overall climate system has come to exceeding this Paris Agreement goal. With greenhouse gas emissions continuing to set record highs, it is likely that climate will regularly exceed 1.5 °C in the next decade.
The last nine years stand out as the nine warmest years to have been directly observed.
| Year | Rank | Warming | Uncertainty (single year) | Uncertainty (incl. baseline) |
|---|---|---|---|---|
| 2023 | 1 | 1.54 °C / 2.77 °F | ± 0.04 °C | ± 0.06 °C |
| 2022 | 6 | 1.25 °C / 2.25 °F | ± 0.03 °C | ± 0.06 °C |
| 2021 | 8 | 1.20 °C / 2.17 °F | ± 0.03 °C | ± 0.06 °C |
| 2020 | 3 | 1.36 °C / 2.45 °F | ± 0.03 °C | ± 0.06 °C |
| 2019 | 4 | 1.33 °C / 2.40 °F | ± 0.03 °C | ± 0.06 °C |
| 2018 | 9 | 1.20 °C / 2.15 °F | ± 0.03 °C | ± 0.06 °C |
| 2017 | 5 | 1.27 °C / 2.29 °F | ± 0.03 °C | ± 0.06 °C |
| 2016 | 2 | 1.37 °C / 2.47 °F | ± 0.03 °C | ± 0.06 °C |
| 2015 | 7 | 1.23 °C / 2.22 °F | ± 0.03 °C | ± 0.06 °C |
| 2014 | 10 | 1.09 °C / 1.96 °F | ± 0.03 °C | ± 0.06 °C |
| 2013 | 14 | 1.01 °C / 1.83 °F | ± 0.03 °C | ± 0.06 °C |
| 2012 | 18 | 1.00 °C / 1.79 °F | ± 0.03 °C | ± 0.06 °C |
| 2011 | 20 | 0.98 °C / 1.76 °F | ± 0.03 °C | ± 0.06 °C |
| 2010 | 11 | 1.08 °C / 1.95 °F | ± 0.03 °C | ± 0.06 °C |
The temperature uncertainties can be visualized using the schematic below where each year’s temperature estimate is represented by a distribution reflecting its uncertainty. In the analysis that Berkeley Earth conducts, the uncertainty on the mean temperature of a single year is approximately 0.03 °C (0.05 °F) for recent years. The global mean temperature in 2023 lies far above the previous record high set in 2016 and all other years.

The last nine years have been part of a period of significant warmth well above all previous years since 1850. This reflects the long-term trend towards man-made global warming.
Seasonal Temperature Distribution
In 2023, the monthly-average temperature in January was similar to that in 2021 or 2022, but well below the previous record level. However, following the end of La Niña in the Pacific, record-breaking monthly-average warmth began in June and continued in every month through the rest of the year, often beating the previous monthly record by a large margin. September had the largest monthly anomaly ever observed, with December coming in as the second largest. Seven months in 2023 were at least 1.5 °C / 2.7 °F above their corresponding 1850-1900 average.

Land Average Temperature in 2023
On land, 2023 was also the warmest year directly observed, reaching 2.10 °C / 3.78 °F above the 1850 to 1900 average. This is the first year with a land-average of more than 2.0 °C, and beats the previous record set in 2020 by 0.13 °C / 0.23 °F.

As discussed below, many territories saw local record warm annual averages in 2023.
Ocean Average Temperature in 2023
On the ocean’s surface, 2023 was also the warmest year directly observed, reaching 1.10 °C / 1.98 °F. This is the first year with a ocean-average above 1.0 °C, and beats the previous record set in 2020 by a very large maring, 0.16 °C / 0.29 °F.

Berkeley Earth’s data for the oceans is adapted from the UK Hadley Centre’s HadSST4 data product after interpolation.
Temperature Distribution in 2023
This map shows how local temperatures in 2023 have increased relative to the average temperature in 1951-1980. Prominent warmth over Asia and South America is visible this year, as is El Niño associated warming in the Pacific.

As can be expected from the global warming caused by greenhouse gases, the temperature increase over the globe is broadly distributed, affecting nearly all land and ocean areas. In 2023, 95.5% of the Earth’s surface was significantly warmer than the average temperature during 1951-1980, 3.5% was of a similar temperature, and only 1% was significantly colder.
We estimate that 17% of the Earth’s surface set a new local record for the warmest annual average. This includes 23% of the land surface and 14% of the ocean’s surface. Particularly extreme conditions were observed over Central and South America, parts of Asia, and the North Atlantic. The warm El Niño pattern is clearly visible in the anomalies for the eastern tropical Pacific.
As discussed below, these locations with record warm annual averages are home to approximately 2.3 billion people, including particularly large population centers in Asia.
In 2023, no places on Earth experienced a record or near-record cold annual average.

As noted above, record warmth did not emerge until June. As a consequence, the second half of 2023 was particularly extreme for warmth in many regions, including Asia, South America, North Africa and Europe. Strong warmth anomalies are visible in the tropical Pacific (due to El Niño), as well as the North Atlantic and North Pacific.

Land areas generally show about twice as much warming as the ocean. When compared to the 1850-1900 averages, the land average in 2023 has increased 2.10 ± 0.07 °C (3.78 ± 0.13 °F) and the ocean surface temperature, excluding sea ice regions, has increased 1.10 ± 0.04 °C (1.98 ± 0.07 °F). Most of this warming has occurred since 1970.
Both land and ocean individually set new observational records in 2023. The following figure shows land and ocean temperature changes relative to the average from 1850 to 1900. The tendency for land averages to increase more quickly than ocean averages is clearly visible.

As in other recent years, 2023 also shows strong warmth over the Arctic that exceeds the Earth’s mean warming. Over the last 40 years, the Arctic has warmed at ~4 times the average global rate. This is consistent with the process known as Arctic amplification. By melting sea ice and decreasing snow cover, warming in the Arctic allows more sunlight to be absorbed, which in turn leads to additional local warming. However, 2023 was not as warm as other recent years, and is ranked only 7th overall in the Arctic, slightly ahead of 2022, but significantly cooler than 2020 or 2016. Similarly, Arctic sea ice melt in 2023 was less extreme than other recent years, though still well ahead on what was typical 30 years ago.

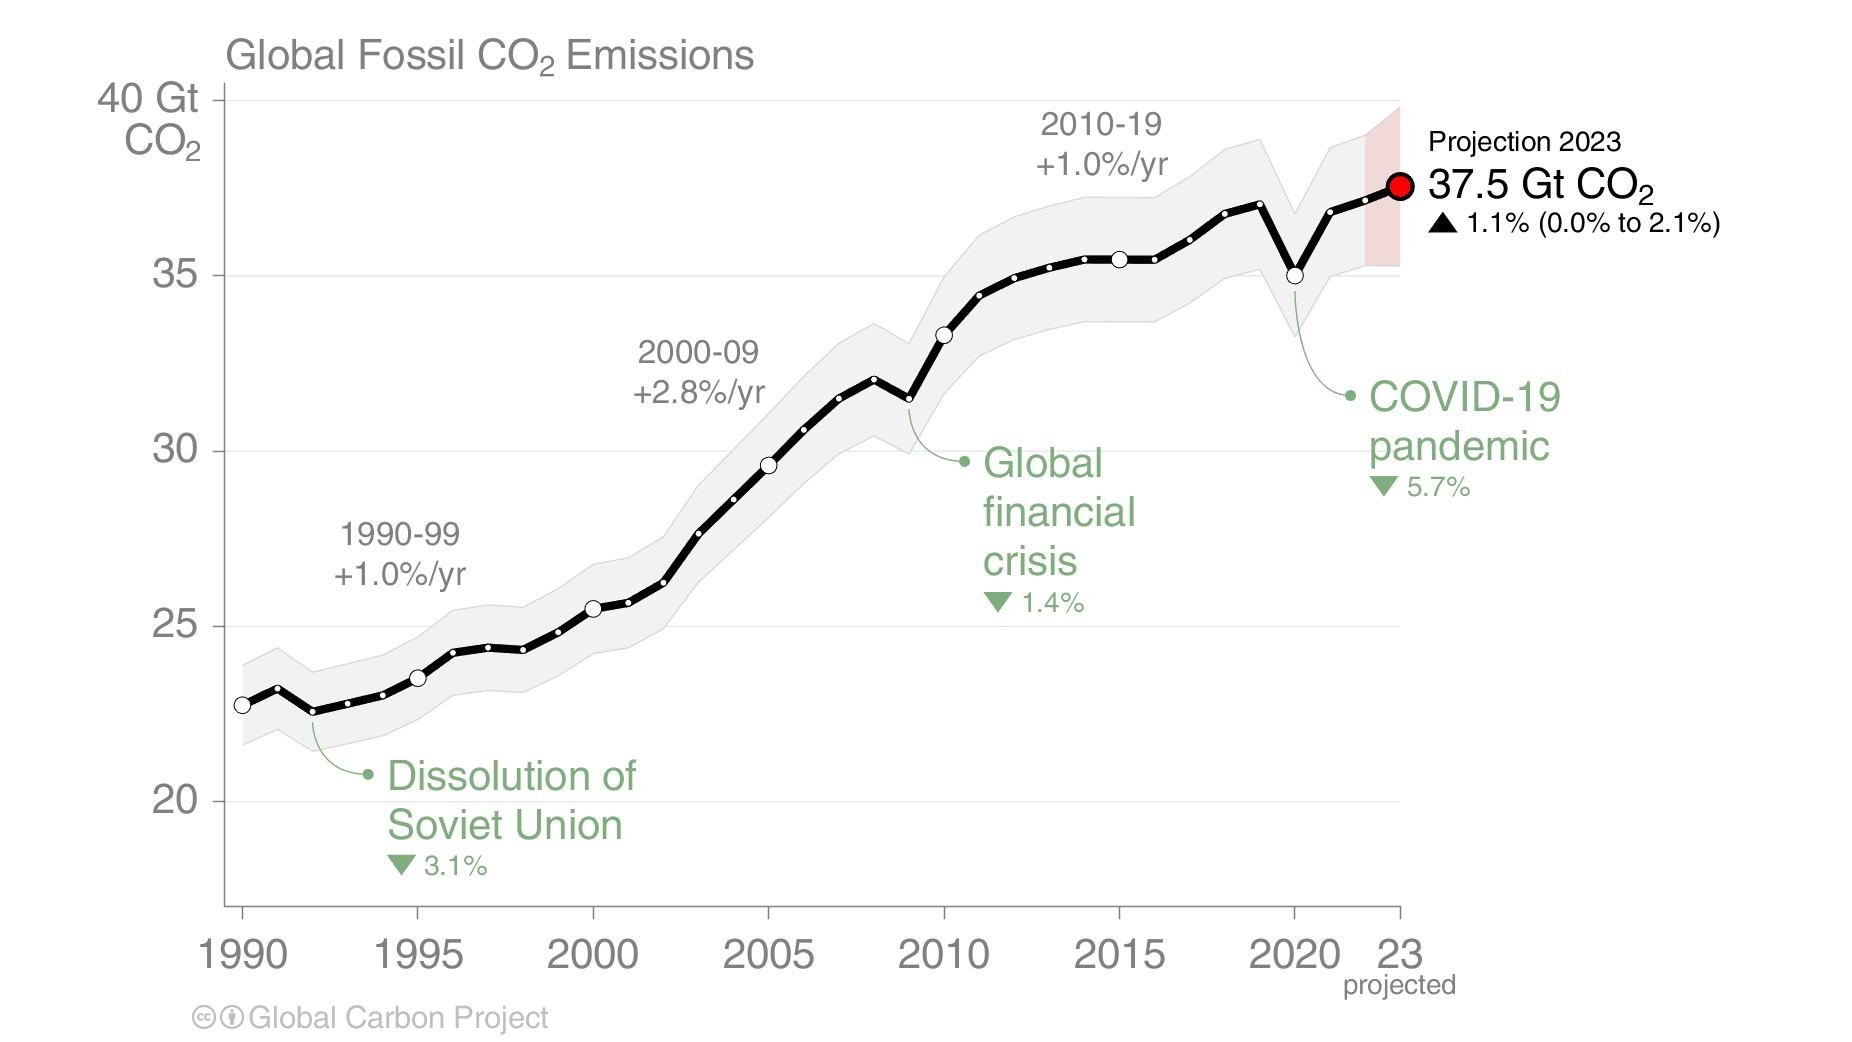
Both the tendency for land to warm faster than ocean and the higher rate of warming over the Arctic are expected based on the understanding of how increases in greenhouse gas concentrations will impact the Earth’s climate. As has been reported by the Global Carbon Project and other observers, 2023 saw a new record for the level of carbon dioxide in the atmosphere. This is due to the continued accumulation of carbon dioxide from human activities. The annual amount of carbon dioxide emitted in 2023 was 1.1% higher than 2022 and set a new all-time high.
Development of El Niño
The emergence of the El Niño weather phenomenon in the middle of 2023 had a significant influence on temperatures during the rest of the year.
El Niño is characterized by the emergence of a large area of relatively warm water in the eastern equatorial Pacific, as can be clearly seen in the anomaly maps above. In addition to the immediate warming in the Pacific, El Niño can have far-reaching effects on global circulation and weather patterns. This disruption of weather patterns tends to be associated with an extended period of somewhat increased global average temperatures that can last for months beyond the peak of the El Niño in the Pacific.
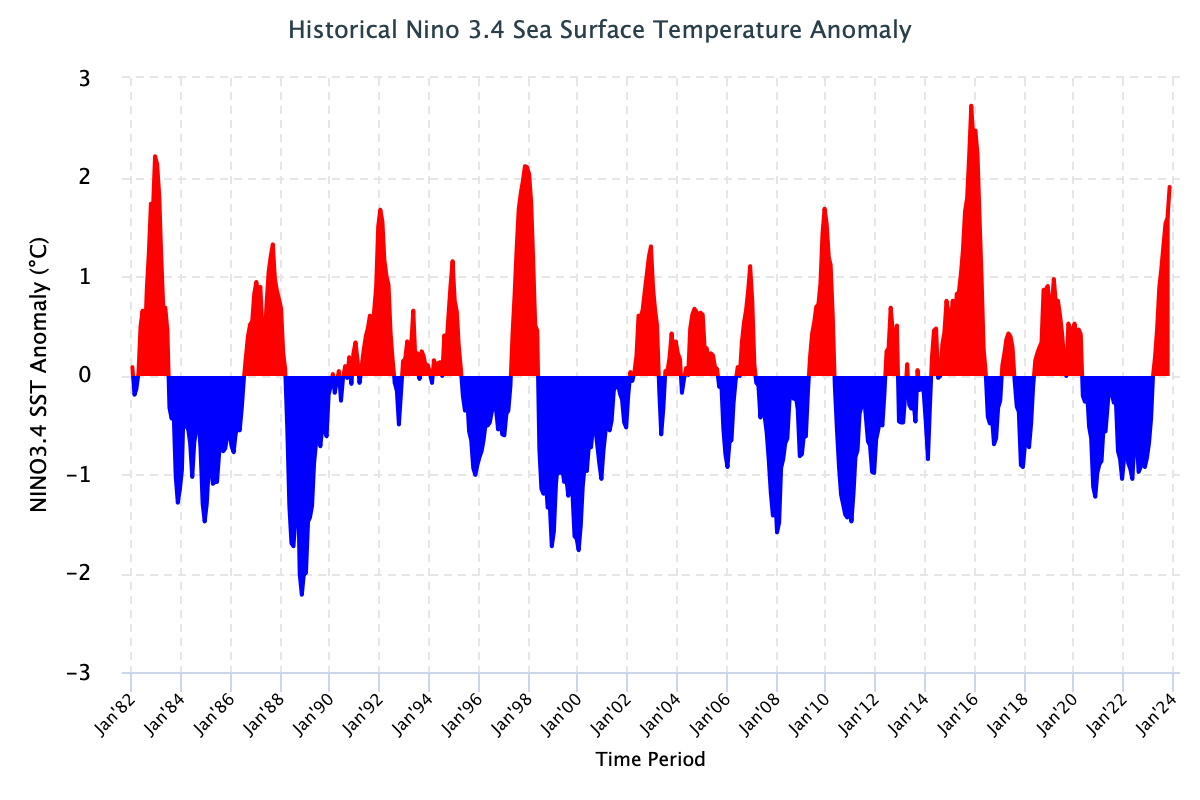
Notably, the monthly time series of ocean average temperatures shifted sharply higher in the middle of 2023 due to dissipation of La Niña and development of El Niño, and has remained well above all previous highs. As discussed below, this temperature excursion is not solely due to El Niño in the Pacific, but was also influenced by unusual warming in other ocean basins, especially the North Atlantic. It appears that the ocean-average temperature spike may have already peaked, which would be unusually early given ongoing El Niño conditions.

Prior to 2023, the equatorial Pacific maintained La Niña conditions since mid-2020. This long-lived La Niña contributed to making 2021 and 2022 relatively cooler than other previous years. By contrast, the rapid transition from a La Niña at the start on 2023 to a strong El Niño by the end of 2023, contributed to the temperature records observed in 2023. The current El Niño is expected to peak soon, and is forecast to dissipate by the middle of 2024. Nonetheless, its legacy is likely to contribute significantly to warm global average temperatures in 2024.
During La Niña conditions, the Eastern Equatorial Pacific Ocean is characterized by below normal temperatures, and increased downward transport of surface heat. As a result, global mean temperatures tend to be somewhat lower during La Niña years. During El Niño years, the opposite is present, as warm water in the Eastern Pacific releases extra heat into the atmosphere. This difference in heat transport plays a large role in El Niño / La Niña’s impact on global temperatures.

The current El Niño has been described as “strong” and approaching “very strong” based on the presence of temperatures in the Central Pacific nearly 2.0 °C above normal. However, if adjusted for the average level of ocean warming in 2023 (as shown above), the current El Niño might be considered more “moderate”. The large-scale weather changes associated with El Niño are driven by the contrast between the El Niño region and other regions, so the direct weather impacts of this El Niño may be somewhat less extreme than in 2016 or 1998.
Roughly speaking, we expect each 1 °C (2 °F) temperature shift in the main El Niño / La Niña region to drive a corresponding ~0.1 °C (~0.2 °F) variation in the global mean temperature, with a lag of 3-6 months. For example, we expect the effect of La Niña in 2022 was roughly to make the annual average ~0.1 °C (~0.2 °F) colder than it might otherwise have been. By contrast, rapidly transitioning into El Niño from an La Niña may have contributed ~0.2 °C (~0.4 °F) to the global average.
In general, we expect that the second year after an El Niño emerges will be warmer than the first. Historically, we observe an average of 0.08 °C additional warming in the second year, though with a wide range of variation. With the exception of El Niño years that were also perturbed by large volcanic eruptions, almost every moderate to strong El Niño since 1950 has warmed in the second year compared to the year that it began. However, no other El Niño since 1950 has been associated with as extreme an anomaly in its year of its emergence as 2023. The unusual characteristics of 2023 may make it difficult for 2024 to warm further.

North Atlantic Warmth
The Northern Hemisphere portion of the Atlantic Ocean experienced an extreme warming event during the summer and fall of 2023. Based on historical observations, a deviation from the long-term trend of the size observed in 2023 should occur less than once per century, with the last similar event reported during the super El Niño of 1877/1878.
The combination of extreme warmth in the North Atlantic and an El Niño in the Pacific, directly led to extreme weather in South America, including one the most severe droughts ever observed in the Amazon.

While North Atlantic warming can occur with El Niño, the event observed in 2023 appears to have occurred before El Niño was strongly developed, and is likely to be only weakly connected. The proximal cause of the extreme North Atlantic warmth in 2023 appears to have been unusually low amounts of dust coming off the Sahara. This reduction in dust cover allowed somewhat more solar energy to be absorbed than is typical.
 |  |
We believe that natural variability in the North Atlantic and other regions is largely responsible for the surge in global mean temperatures in the middle of the year, well before the 2023 El Niño event had gathered strength.
National Average Temperature
Though the focus of our work is on global and regional climate analysis, it is also possible to use our data to estimate national temperature trends.
In Berkeley Earth’s estimation, 2023 had the warmest annual average since instrumental records began in the following 77 countries:
Afghanistan, Albania, Antigua and Barbuda, Argentina, Austria, Azerbaijan, Bangladesh, Bhutan, Bolivia, Bosnia and Herzegovina, Brazil, Bulgaria, Cabo Verde, Cameroon, China, Comoros, Costa Rica, Croatia, Cuba, Czechia, Dominica, Dominican Republic, Ecuador, El Salvador, Federated States of Micronesia, Gambia, Germany, Greece, Grenada, Guatemala, Guinea, Guyana, Haiti, Honduras, Hungary, Ireland, Ivory Coast, Jamaica, Japan, Kazakhstan, Kiribati, Kosovo, Kyrgyzstan, Liechtenstein, Macedonia, Mexico, Moldova, Montenegro, Morocco, Myanmar, Netherlands, Nicaragua, Nigeria, North Korea, Oman, Panama, Paraguay, Peru, Republic of the Congo, Romania, Saint Kitts and Nevis, Saint Lucia, Saint Vincent and the Grenadines, San Marino, Senegal, Serbia, Slovakia, Slovenia, South Korea, Tajikistan, The Bahamas, Trinidad and Tobago, Turkmenistan, Ukraine, Uzbekistan, Venezuela, and Yemen
This list of countries having record warmth in 2023 is estimated from Berkeley Earth’s gridded temperature data set. Due to uncertainties and methodological differences, national weather agencies may give slightly different estimates of temperatures in 2023. In some cases, this may cause disagreements over whether a record national average was truly reached in 2023.
Looking at the specific sub-national locations where record annual averages occurred, we estimate that approximately 2.3 billion people — 29% of Earth’s population — live in places that observed their locally warmest year during 2023. This was concentrated in Asia, South and Central America, and includes half the population of China, as well as most of the population of Bangladesh, Japan, and Mexico. Portions of Europe and the Southern USA also saw their warmest annual average, though most of the USA had only more moderate warmth in 2023.
The following chart provides a summary of the warming that countries experienced in 2023 relative their 1951 to 1980 averages.

These estimates for the changes in national annual average temperatures are derived from our global temperature fields. Due to uncertainties in the analysis and the limits of our spatial resolution some national average estimates may differ slightly from the values reported by their respective national weather agencies.
It is also worth noting from the above chart that a majority of ocean basins set new records in 2023, with the exception of the Arctic Ocean and the North Pacific Ocean.
During 2024, Berkeley Earth will be transitioning to an updated high resolution analysis which will improve our ability to characterize such local, regional, and national changes, and reduce uncertainties associated with topography and small-scale weather variability.

Monthly Temperature Patterns
Every month in 2023 was at least 1.2 °C (2.2 °F) warmer than the corresponding 1850 to 1900 monthly average. 2023 started with temperatures relatively similar to those from 2021 and 2022. However, as La Niña dissipated, the patterns started to diverge with the new records becoming more extreme in the second half of the year alongside a growing El Niño event. The last 7 months of 2023 all provided new monthly records. July was also the month with the warmest absolute Earth-average temperature ever measured, while September provided the largest monthly temperature anomaly on record.

The September anomaly was particularly surprising as September is traditionally a time of the year with lower year-to-year variability. No previous year has seen a deviation in September even remotely similar to what was observed in 2023.


Causes of Warmth in 2023
The warming pattern in 2023 was extraordinary. It appears to have been caused by a combination of natural and man-made factors.
Over the long-term man-made global warming is responsible for gradually increasing temperatures at a rate of ~0.20 °C / decade. Greenhouse gas emissions, which are the underlying cause of global warming, reached record highs in 2023.
While global warming controls the long-term trend, it changes only gradually. Short-term fluctuations in global mean temperature are primarily driven by internal variations in the climate system, such as the state of the El Niño / La Niña oscillation. To a lesser extent, they can also by affected by external processes such as the solar cycle and volcanic eruptions.

The temperature change from 2023 to 2024, +0.29 °C (+0.52 °F) can largely be understood as the combined effect of the transition from La Niña to El Niño, alongside other sources of natural variability (e.g. the North Atlantic) and combined with modest warming from several additional factors.
The North Atlantic variations appear to be mostly a form of random natural variability. This is different from El Niño, which is a dynamical process with predictable seasonal variations that can be used for forecasting. However, it does appear likely that the inclusion unforced natural variability in the North Atlantic or elsewhere is necessary to explain the full magnitude of the warming observed in 2024.
Other factors likely influencing 2023 climate include the ~11-year solar cycle, which is nearing its expected peak in 2024 or 2025. The current solar cycle appears to be modestly stronger than the previous cycle, but is close to 20th century averages.
In addition, we consider it plausible that the 2022 Hunga Tonga eruption is contributing to unusual weather in 2024. Unlike most volcanoes, the eruption of Hunga Tonga was rich in water vapor and low in sulfur. Usually, a large eruption results in a temporary period of cooling due to excess sulfur in the atmosphere, but the Hunga Tonga eruption may have contributed warming instead due to its large water vapor contribution.
Hunga Tonga injected ~150 million tonnes of water vapor into the stratosphere. This is small compared to the atmosphere’s total water vapor content, but unusually large for the stratosphere. This eruption raised the water vapor content of the upper atmosphere by ~15%. This plume, which will take at least several years to dissipate, has been estimated by Jenkins et al. to warm the Earth by about +0.035 °C (0.063 °F). However, the magnitude of potential warming remains highly uncertain as does the possibility of more impactful regional variations.

The Hunga Tonga water vapor has been implicated in changes this year in the Antarctic Ozone Hole. We also note that Antarctic sea ice set an extreme record low during this year’s Antarctic winter. If this is not simply a coincidence, it may suggest that the Hunga Tonga eruption has had more complex dynamical and regional implications than have thus far been understood.

Another likely factor in the warmth witnessed during 2023 is the reduction in man-made sulfur aerosols. In 2020, new international rules governing heavy fuels for marine shipping abruptly reduced sulfur emissions from large ships by ~85%. This change was made to preserve human health, due to the toxic nature of sulfur aerosols. However, such aerosols also reflect sunlight, and as a result have a cooling effect. These sulfur aerosols are believed to have masked some of the effects of global warming, especially in the heavily trafficked North Pacific and North Atlantic regions. An analysis suggests that removing the sulfur aerosols may have added ~0.2 °C (~0.4 °F) to the North Atlantic region. This would not explain all of the recent North Atlantic temperature spike, but may have added to its severity.

The reduction in marine sulfur aerosols from shipping, though regionally significant in areas with high shipping volumes, has likely only added a few hundredths of a degree to the global average temperature.
Long-term Trend
Though it is interesting to understand the characteristics of individual years, global warming is ultimately about the long-term evolution of Earth’s climate. The following chart shows a ten-year moving average of the Earth’s surface temperature, plotted relative to the average temperature from 1850-1900, along with a simple extension of the recent trend.

Since 1980, the overall trend is +0.20 °C/decade (+0.36 °F/decade) and has changed little during this period. By continuing this trend, we can make a rough guess of how the near-future climate may develop if the forces driving global warming continue to progress at their present rate.
As shown in the chart, 2023 has become the first year in our dataset more than 1.5 °C (2.7 °F) above the average temperature from 1850-1900, often used as an estimate of the pre-industrial climate. In addition, several recent years have had temperatures more than 1.2 °C (2.2 °F). It is possible that 2023 is the beginning of an accelerated trend, but it is impossible to draw that conclusion from a single year.
The Paris Agreement on Climate Change aims to keep the long-term average global temperature rise to well below 2 °C (3.6 °F) and encourages parties to strive for warming of no more than 1.5 °C (2.7 °F). At the current rate of progression, the increase in Earth’s long-term average temperature will reach 1.5 °C (2.7 °F) above the 1850-1900 average by around 2032 and 2 °C (3.6 °F) will be reached around 2057. The increasing abundance of greenhouse gases in the atmosphere due to human activities is the direct cause of this recent global warming. If the Paris Agreement’s goal of no more than 2 °C (3.6 °F) warming is to be reached, significant progress towards reducing greenhouse gas emissions needs to be made soon.
Is Global Warming Accelerating? Maybe.
Based on the current trends in land and ocean surface temperatures, it is not yet necessary to assume that the pace of global warming has accelerated. In particular, the warming trend and interannual fluctuations appear largely uniform since 1980. The global temperature in 2023 is unusually warm and defied predictions, but excursions of nearly the same size have occurred in previous years (e.g. 1981, 1998, 2016), and a single anomalous year is not sufficient to demonstrate a change in the long-term global warming rate.
That said, there are other lines of evidence that suggest that global warming may be starting to accelerate, and recently arguments have been made that an accelerated warming rate is imminent.
The first line of evidence comes from observations of the Earth’s energy imbalance (EEI). The energy imbalance is a direct measure of how much extra energy is being trapped in the Earth system as a result of changes in greenhouse gases and other factors. It is the difference between how much energy the Earth absorbs from the Sun and how much subsequently escapes back into space as thermal radiation. As long as the energy imbalance is positive, we can expect the Earth to continue warming.

The CERES project uses satellites to estimate Earth’s energy imbalance. Their data suggests that the Earth’s energy imbalance has more than doubled since 2000, indicating an acceleration of global warming’s impact on the Earth system. However, we must also acknowledge that these are technically challenging measurements to make with considerable uncertainty and short-term variability, which may distort the true trend.
In their presented data, the apparent increase in the energy imbalance is primarily caused by increased absorption of solar radiation due to a corresponding reduction in the Earth’s albedo. Most climate models do expect absorbed solar radiation to increase as global warming progresses. This would be due to a reduction in low cloud cover, a reduction in snow and ice at the surface, and an increase in water vapor, all of which favor an increase in absorbed solar radiation. However, the observed changes indicated by the CERES program are far more rapid than typically expected by climate models given the current pace of global warming.
The rapid increase in absorbed solar radiation may be due, in large part, to a recent reduction is man-made sulfur and other aerosols that have historically served to block a portion of the incoming solar radiation. In essence, by recent efforts to reduce smog and other air pollution, humans may have inadvertently accelerated global warming.
A related line of evidence comes from in situ measurements of Earth’s heat content. The largest and most well-studied component of changes in Earth’s heat content is the ocean heat content. At present, the ocean takes up more than 80% of the excess energy trapped in the Earth system due to the increase in greenhouse gases.

It is generally agreed that the change in ocean heat content has accelerated since the 1980s. However, it is less clear if ocean heat content has accelerated over the last two decades. Multiple reconstructions of ocean heat content exist, and each is subject to a degree of noise and uncertainty on short time scales. Some estimates of Earth’s growing heat content are broadly consistent with the reported rapid increase in the recent Earth’s energy imbalance, though other heat content datasets show a nearly constant trend over the last 20 years with little evidence of acceleration.
Given the known reductions in man-made air pollution, and the plausible evidence of an increasing energy imbalance, it is reasonable to anticipate that global warming may accelerate. We don’t yet have convincing evidence of acceleration directly from surface temperature time series, though it makes sense to prepare for the possibility that global warming will become more rapid in the near future.
Global Mean Temperature Prediction for 2024
Based on historical variability and current conditions, it is possible to roughly estimate what global mean temperature might be expected in 2024. Our current estimate is that 2024 is likely to be similar to 2023 or slightly warmer. With the ongoing El Niño conditions, and the typical lag between peak El Niño and peak global temperature response, it is likely that 2024 remains relatively warm. However, a swing towards La Niña in late 2024 is possible and could ultimately serve to mitigate temperatures some. The swings from El Niño to La Niña and back again are the largest source of predictable interannual variability in the global temperature record.
We predict a 58% chance that 2024 is warmer than 2023 and 97% chance that it is at least as warm as 2016, making it very likely that 2024 will become either the warmest or 2nd warmest year on record.

A note regarding our prior forecast is also warranted. At the start of 2023, we foresaw only a 14% chance that 2023 would become a record warm year, and only a ~1% chance that 2023 would reach 1.5 °C. The actual evolution of 2023 appears to have been highly unlikely and unexpected given the conditions at the start of the year. Part of that is likely related to the highly anomalous North Atlantic warmth, which appears to be a once-in-a-century level of anomaly. To the extent that the 2022 Hunga Tonga eruption and/or the reduction in marine sulfur pollution also contributed some warmth (both discussed above), those factors would not have been included in the prior forecast, and may have also contributed to 2023 exceeding expectations.
Statistically, we expect global mean temperature to fall within the predicted forecast range 95% of the time. 2023 is definitely a major misfit for this predictive model, but it remains to be seen if 2023 is merely an unusual outlier or if it is an indication of unexpected changes ahead.
Comparisons with Other Groups
When preparing our year-end reports, Berkeley Earth traditionally compares our global mean temperature analysis to the results of four other groups that also report global mean surface temperature. The following chart compares Berkeley Earth’s analysis of global mean temperature to that of the NASA’s GISTEMP, NOAA’s GlobalTemp, the UK’s HadCRUT, and ECMWF‘s reanalysis. All of these groups produce a similar understanding of recent climate change.

All of the monitoring agencies with data available concur that 2023 is the warmest year in the observational record, and by a large margin.
In the modern period, slight disagreements between groups mostly reflect the uncertainty in these estimations and the differences in how various research programs look at the Earth. Each uses a somewhat different selection of source data and different methods of interpolation and correcting for measurement errors. Some methods are more limited than others. Berkeley Earth is notable for incorporating more weather station data than any other project.
Unfortunately, there are larger disagreements regarding the earliest part of the observational temperature history. If we align each time series for a preindustrial baseline, it becomes clear that some of the series imply a slightly larger or smaller change in the present day relative to their differing estimates of the pre-industrial period.

Smoothing each series makes this even clearer.

Estimating global mean temperature in the late 19th century is always going to be more challenging than during the recent period due to less data and the less reliable nature of the data that does exist. Much of the disagreement between analysis groups derives from the choice of ocean dataset employed. NASA and NOAA rely on NOAA’s ERSST data product, while Berkeley Earth and HadCRUT use the HadSST data set. These two data products are the only widely used instrumental reconstructions of the long-term changes in the ocean and they disagree to an appreciable degree.
The primary reason that ERSST and HadSST differ is due to different estimates of the biases introduced by changing methods and instrumentation over time. Early ocean temperature observations relied on hauling buckets of water onto the ship’s deck in order to be measured. Over time this was replaced, first with measurements at an engine cooling intake, and later with automated buoys. It is known that each of these processes measures the ocean slightly differently (e.g. sampling at slightly different depths), and will give slightly different answers at the level of a fraction of a degree Celsius. Untangling these differences and correcting the resulting biases is an important aspect of ocean temperature analysis. Unfortunately ERSST and HadSST disagree on the magnitude of these corrections. These problems are well-known and have led to calls for new approaches to understood past ocean biases. In the future, new efforts to analyze ocean temperature records and the associated biases may help to reduce this disagreement.

Smaller differences also arise from the handling of data on land, adjustments for its associated biases, and the interpolation methods used.
Ultimately, each research group strives to produce the best possible estimate, but these methodological differences make understanding of the changes since the preindustrial period more difficult. Different research groups disagree on the amount of warming that has occurred since the preindustrial by more than 0.1 °C (0.2 °F).
At present, Berkeley Earth shows the most warming of the major groups, estimating 2023 at 1.54 °C (2.77 °F) above our own 1850-1900 average. The ERA5 dataset produced by Copernicus is similar, with an estimate of 2023 at 1.48 °C. By contrast, NOAA, the group showing the least long-term warming, estimates 2023 as only 1.34 °C (2.41 °F) above their own 1850-1900 baseline. This is obviously a rather large 0.2 °C (0.36 °F) discrepancy.
| Dataset | Temperature in 2023 relative to the dataset’s own 1850-1900 average |
|---|---|
| Berkeley Earth | 1.54 °C / 2.77 °F |
| HadCRUT | 1.46 °C / 2.63 °F |
| NASA | 1.37 °C / 2.47 °F (Series starts in 1880, includes unofficial estimate of change from 1850-1800) |
| NOAA | 1.34 °C / 2.41 °F |
| EMCWF ERA5 | 1.48 °C / 2.66 °F (Series starts in 1940, includes official estimate of change from 1850-1940) |
| WMO Average | 1.45 °C / 2.61 °F (Combination of multiple data sets) |
This large difference is sometimes described as the “structural uncertainty” in the estimate of long-term temperature change, and limits humanity’s ability to say for sure how much warming has occurred. Each group generally provides an error estimate of how confidently climate can be reconstructed within their own set of bias and uncertainty assumptions. However, the structural disagreement between groups is often larger than the individual uncertainty estimates of the groups, indicating that disagreements about the underlying assumptions themselves are likely a significant source of uncertainty.
Berkeley Earth Methodology
In reconstructing the changes in global mean temperature since 1850, Berkeley Earth has examined 21 million monthly-average temperature observations from 50,706 weather stations. Of these 19,048 stations and 202,000 monthly averages are available for 2023.
The weather station data is combined with sea surface temperature data from the UK Met Office’s Hadley Centre (HadSST). This ocean data is based on 469 million measurements collected by ships and buoys, including 12.7 million observations obtained in 2023. We reprocess and interpolate the HadSST data to provide a more complete picture of the oceans. After combining the ocean data with our land data, we arrive at a global picture of climate change since 1850.
Uncertainties arise primarily from the incomplete spatial coverage of historical weather observations, from noise in measurement devices, and from biases introduced due to systematic changes in measurement technologies and methods. The total uncertainty is much less than the long-term changes in climate during the last 170 years.
This report is based on such weather observations as had been recorded into global archives as of early January 2023. It is common for additional observations to be added to archives after some delay. Consequently, temperature analysis calculations can be subject to revisions as new data becomes available. Such revisions are typically quite small and are considered unlikely to alter the qualitative conclusions presented in this report.
Copyright
This report was prepared by Berkeley Earth. The contents of this report, including all images not attributed to a specific third-party author, may be reused under the terms of the Creative Commons BY-NC 4.0 copyright license for any non-commercial purpose and in any forum, consistent with the terms of that license.
Members of the news media may also use the materials in this report for any news reporting purpose provided that Berkeley Earth is properly acknowledged, without concern for whether or not the CC BY-NC 4.0 license is followed.
For more information about licensing for commercial purposes, please contact admin@berkeleyearth.org.
Data
Updated data files will appear at our data page, and are updated monthly.
In particular, monthly and annual time series are available.