Source: The Washington Post
A new article published this week by the Washington Post highlights the ways in which the impacts of global warming are often unevenly distributed, using Berkeley Earth’s current temperature data to reveal how some regions are warming at a slower rate relative to the global average.
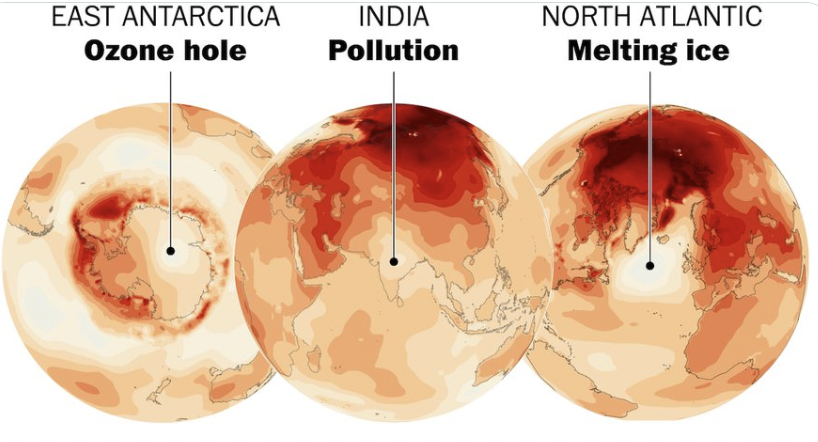
While the world has warmed an average of 1.3°C since the pre-industrial era, the article uses Berkeley Earth’s current Surface Temperature Data Set to identify regions such as India, the North Atlantic, and East Antarctica, that are warming at a slower rate compared to the global average due to causes such as air pollution and ozone depletion.
According to Berkeley Earth’s Zeke Hausfather, who was quoted in the article, aerosols, or the fine suspended particles of air pollution produced by the burning of fossil fuels, can have a cooling effect as they block and scatter sunlight and stimulate cloud formation.
Berkeley Earth currently offers the highest spatial resolution of any instrumental time-series available, allowing for the visualization of national variations in warming rates. An upgraded, high-resolution data set is scheduled for release in early 2023, which will allow for improved analysis of variable warming rates at the local and regional levels.
The full text of the Washington Post article is available here.