The following is a summary of global temperature conditions in Berkeley Earth’s analysis of February 2026.
- February 2026 was nominally the 2nd warmest February on record behind 2024, those with uncertainty that effectively leaves it tied with the third and fourth warmest Februarys. The global average was 1.55 ± 0.12 °C (2.78 ± 0.22 °F) above the 1850-1900 average.
- Land temperatures averaged 2.55 ± 0.30 °C (4.59 ± 0.55 °F) above the 1850-1900 average, ranking as nominally the 2nd warmest February for terrestrial regions.
- Ocean temperatures were 1.04 ± 0.17 °C (1.87 ± 0.30 °F) above the 1850-1900 average, making it nominally the 3rd warmest February for ocean surfaces.
- February temperatures were particularly unusual in the Middle East with Iran, Iraq, Kuwait and Saudi Arabia all setting monthly average records by large margin.
- As of February, the Pacific Ocean is in a declining La Niña state trending towards neutral. Many forecasts now expect a strong El Niño to develop in mid to late 2026.
- 3.9% of Earth’s surface experienced a record high February monthly average, with simialr contributions from land and ocean surfaces.
- 2026 now has a 16% likelihood to be the warmest year on record.
Global Summary
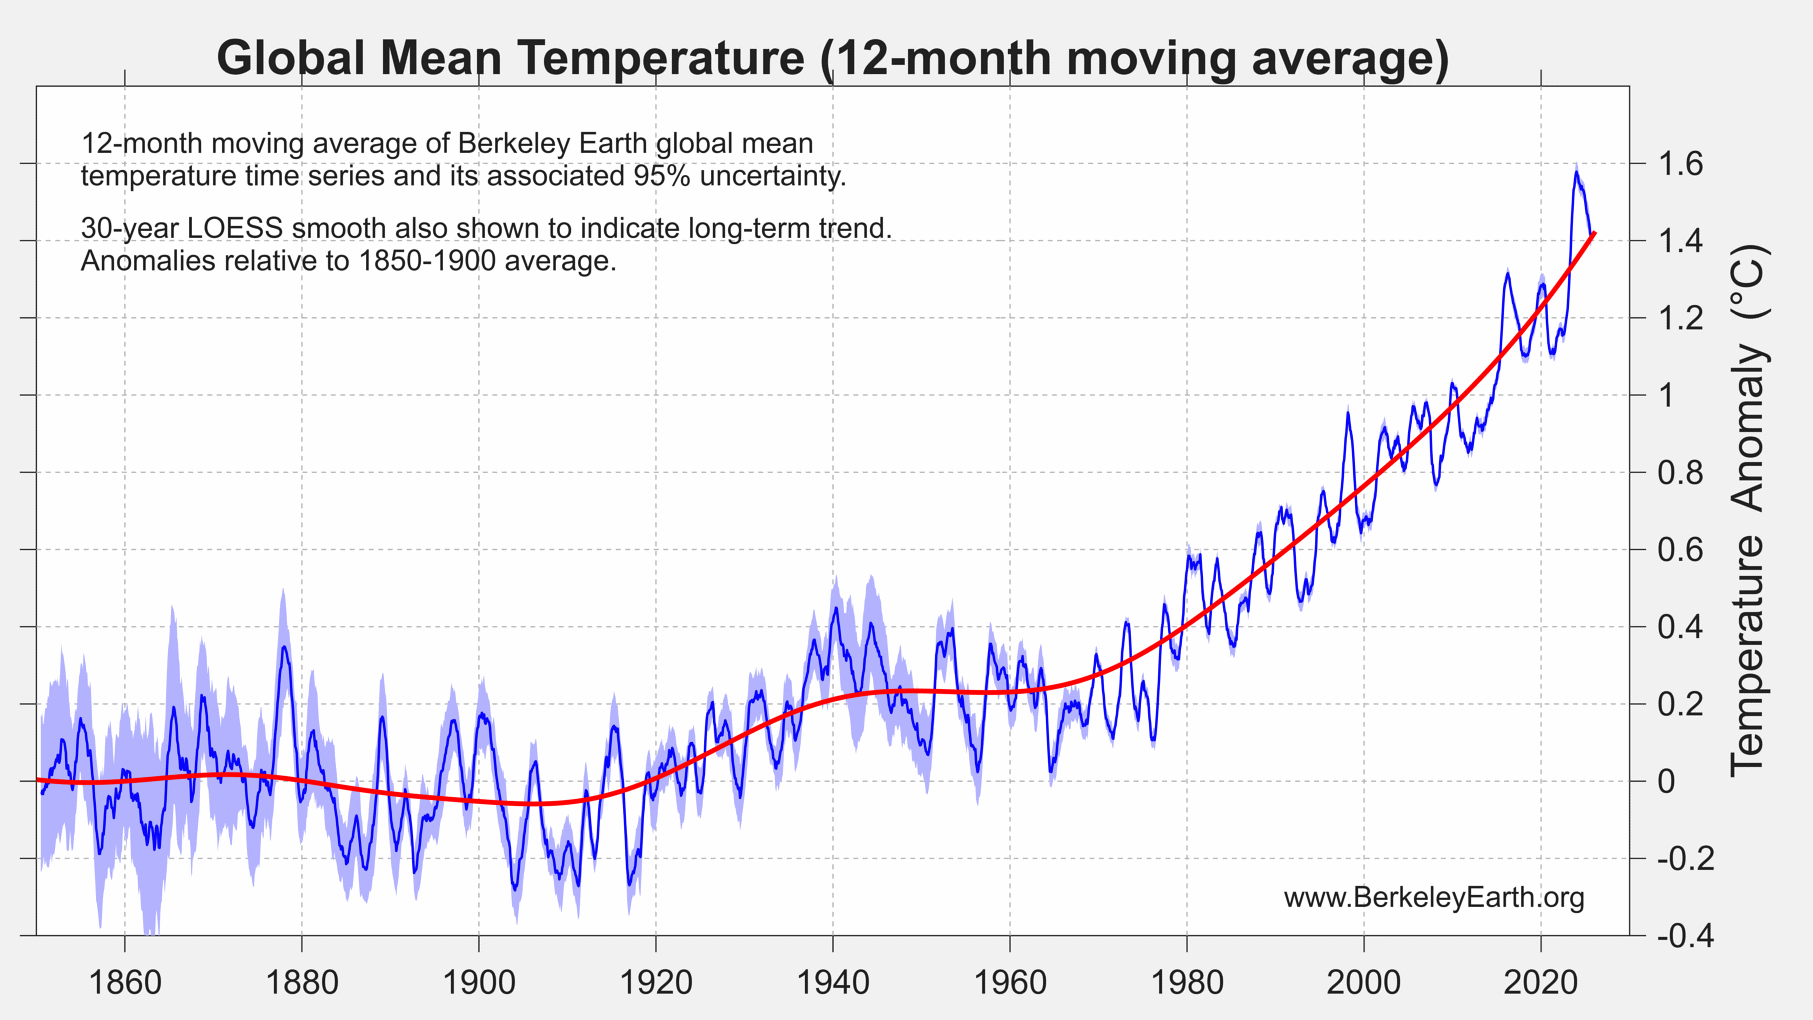
Febraury 2026 was nominally the 2nd warmest February on record, behind February 2024, with a monthly global average of 1.55 ± 0.12 °C (2.78 ± 0.22 °F) above the 1850-1900 average. However, it only marginally exceeded the conditions in February 2025 and 2016, and all three of these years could be considered tied.

Month-to-month temperatures ticked upward in February 2026, reaching a level not seen since early 2025. However, conditions remain modestly cooler than during the bulk of 2023 and 2024. February 2026 also has a somewhat larger uncertainty than we would prefer due to ongoing disruptions and delays from some upstream data providers.

February 2026 was cooler than 2024, but still at least 0.4 °C (0.7 °F) warmer than any February prior to 2016. February temperatures also exceed the 1.5 °C (2.7 °F) threshold for the first time since January 2025.

The 12-month moving average is approaching the long term trend line. The short-term natural variability contributing to anomalous warmth in 2023 & 2024 has dissipated, and historically we would usually see temperatures now temporarily dip below the long-term trend. Short-term variability is an inherent part of the weather and climate and is to be expected even alongside persistent long-term global warming.
Spatial Variation
In February 2026, elevated temperatures were present in most regions. These were especially prominent across North America, the Middle East, Central Asia, parts of Antarctica, and parts of both the Pacific and Atlantic. Cooler temperatures were present in parts on Scandinavia, Northern Asia, and Northern Canada.
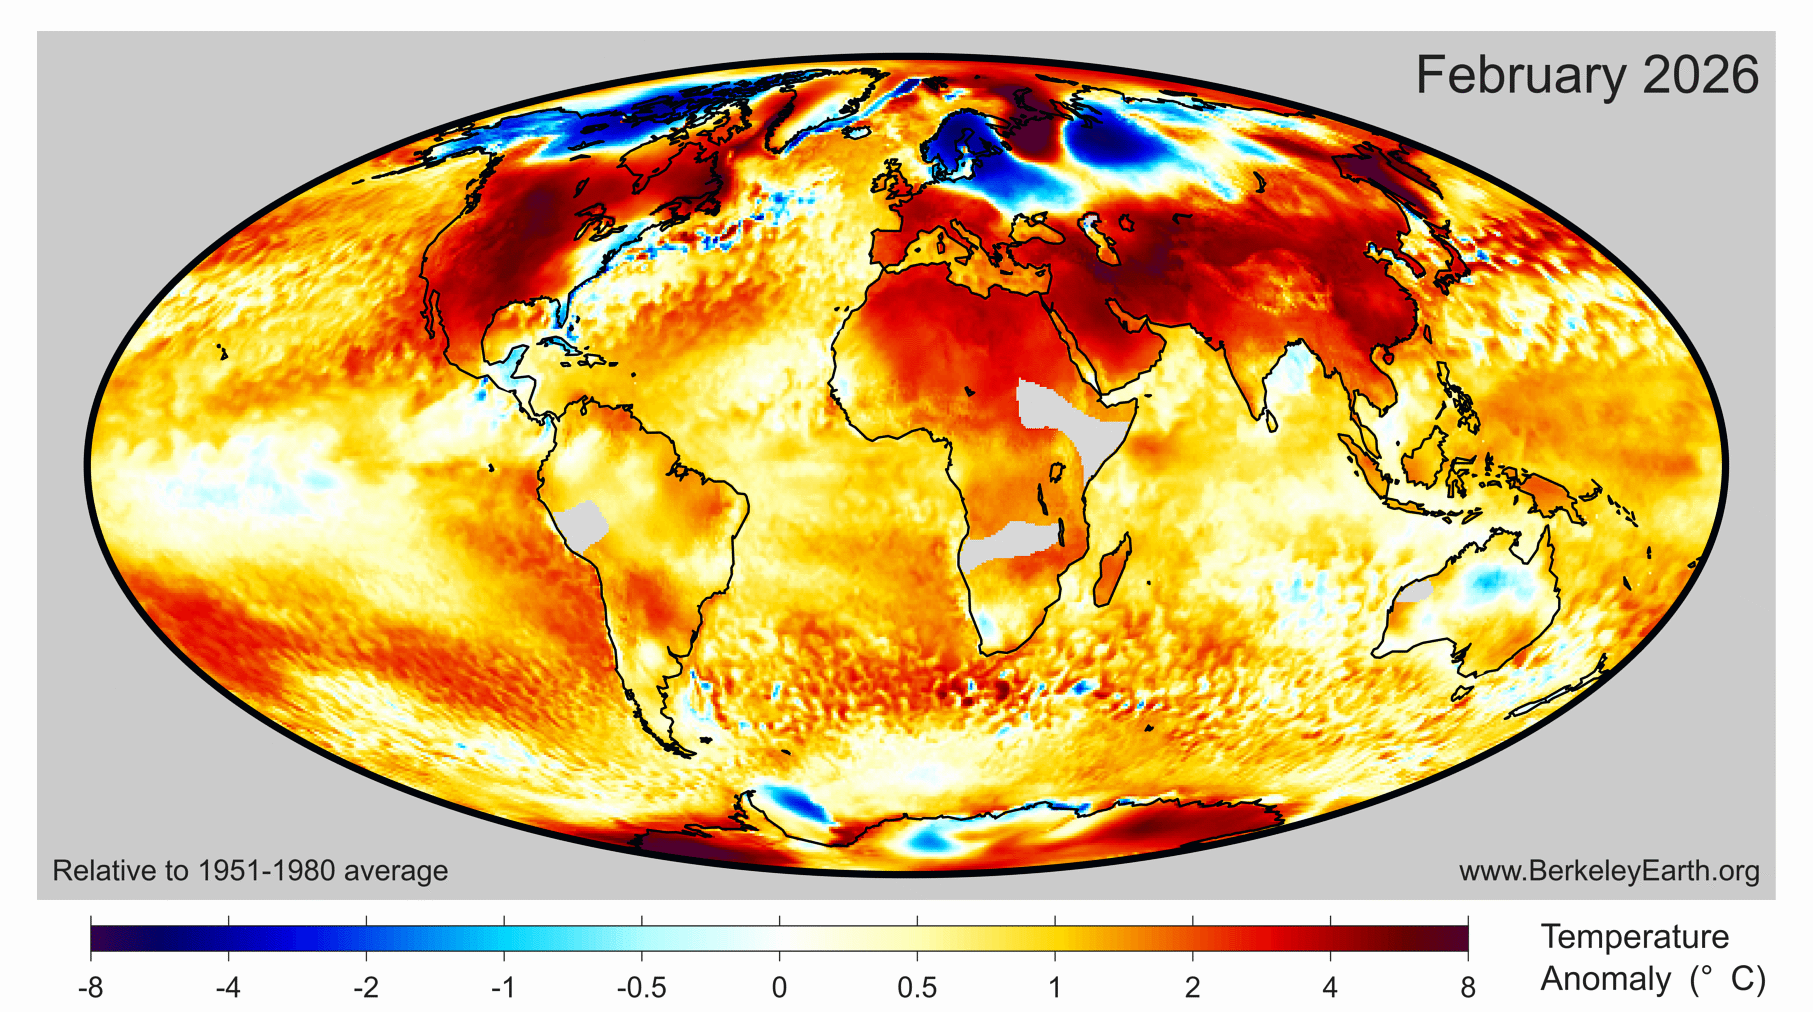
3.9 % of Earth’s surface experienced a record high February monthly average (3.9% of land and 4.0% of ocean surfaces), with record warmth in parts of the North Pacific Ocean, the Arctic Ocean, North East Canada, Southern and West Africa, South East Asia, and Indonesia/Papua New Guinea. No areas of record low monthly averages in February.
In Berkeley Earth’s estimation, 14 countries set record warm national averages in February, including: Azerbaijan, Bahrain, China, Iran, Iraq, Kuwait, Kyrgyzstan, Madagascar, Mauritius, Mexico, Qatar, Saudi Arabia, Tajikistan, and the United Arab Emirates.
These are most prominently concentrated in the Middle East and Central Asia. Iran, Iraq, and Kuwait were especially notable for each smashing previous February monthly average records by more than 1 °C (1.8 °F).

Over land regions, February 2026 was nominally the 2nd warmest February since 1850, with a terrestrial average of 2.55 ± 0.30 °C (4.59 ± 0.55 °F) above the 1850 to 1900 average. Given the uncertainties, this is essentially indistinguishable from the warmth on land in 2016 and 2020, such that all three years could effectively be considered tied for the record warmest.
On a month-to-month basis, February 2026 is sharply warmer than January 2026, in large part due to an unusual increase in warmth in Northern mid-latitude land areas.
We note however that February 2026 does have an unusually high uncertainty due to ongoing delays in weather station data availability. This also contributes to some unusual gaps in spatial coverage. As additional weather station data becomes available, this ranking may be modest revised higher or lower as appropriate.


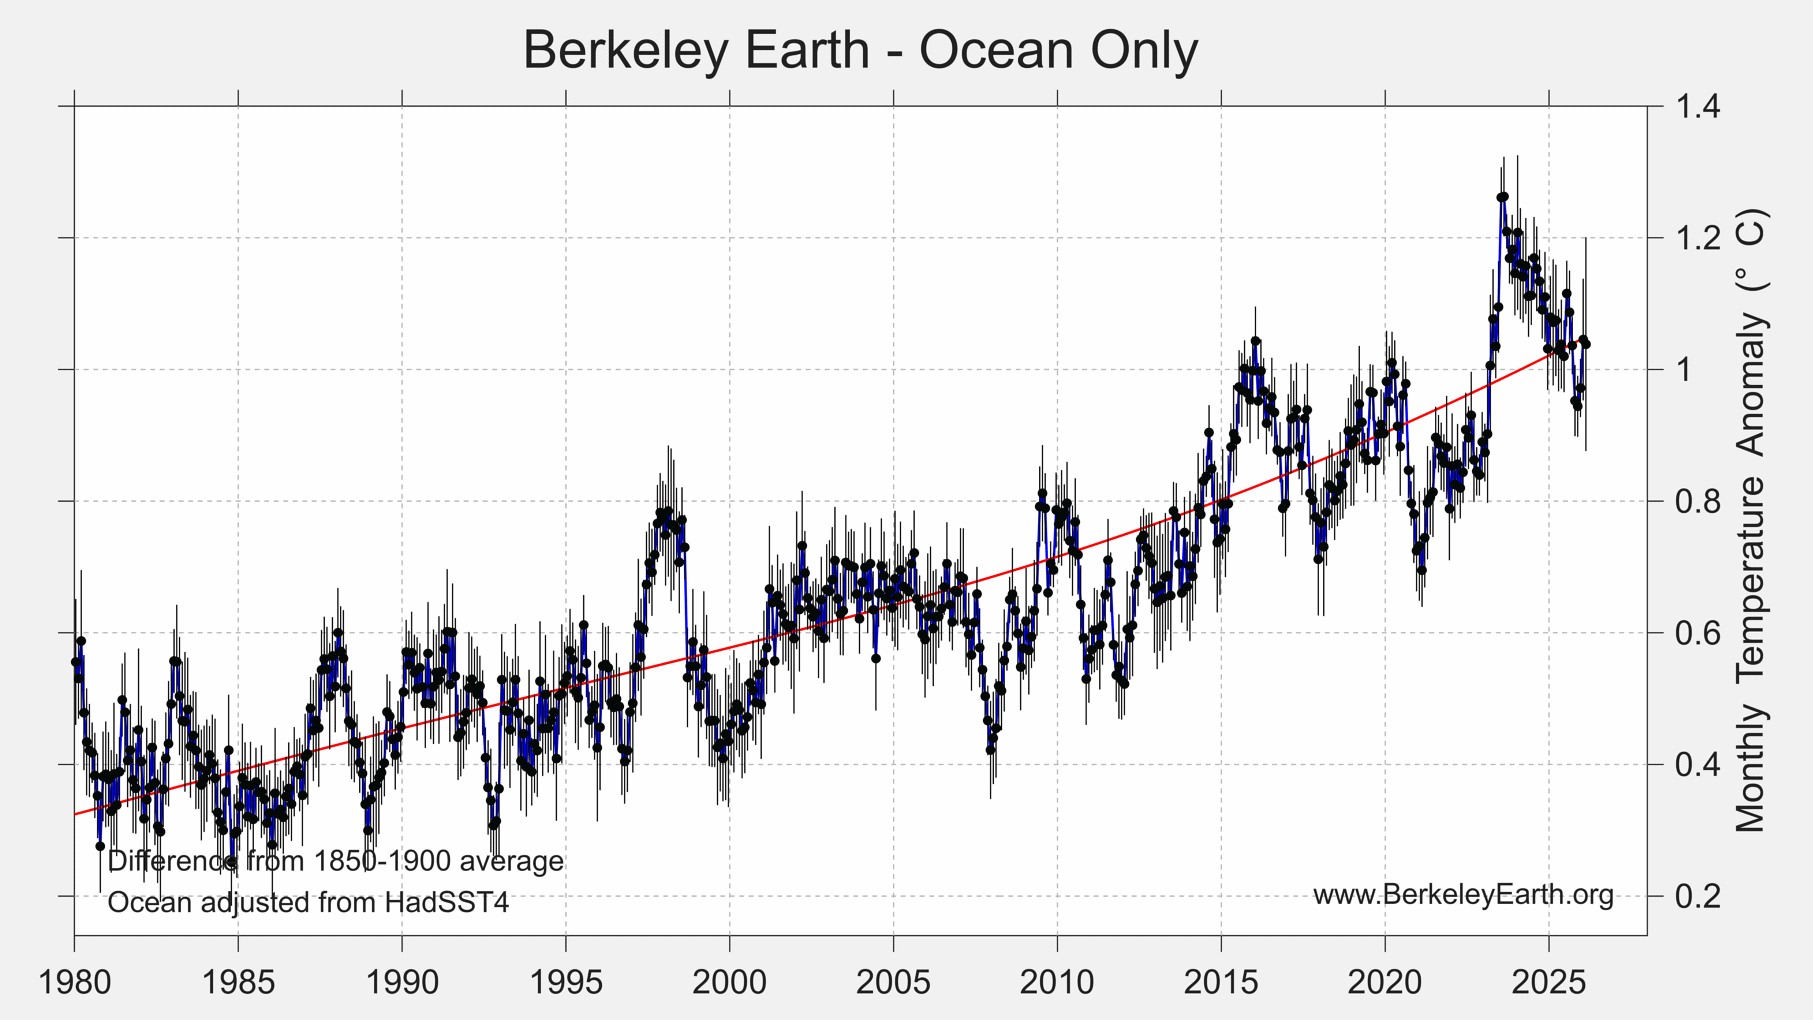
Average ocean temperatures in February 2026 were equal to 1.04 ± 0.17 °C (1.87 ± 0.30 °F) above the 1850 to 1900 average. This was nominally the 3rd warmest February on record (behind 2024 and 2025).
On a month-to-month basis the ocean average is similar to January 2026 and warmer than La Niña cooled values in late 2025.

Seasonal Results (December – February)
Seasonally the period December 2025 to February 2026 was globally the 4th warmest such period on record.


Continuing NOAA Data Problems
The current monthly report is prepared using data available to Berkeley Earth as of early March 2026. However, we are continuing to work around problems with NOAA input data. Since late August 2025, core NOAA climate archives, including the Global Summary of the Day, Global Historical Climatology Network – Daily, and Global Historical Climatology Network – Monthly (GHCN-M), have been either broken or in a degraded state. Because Berkeley Earth draws from multiple data sources, we are resistant to these problems but not entirely immune to them.
While we ordinarily expect to have weather data from ~20,000 weather stations per month in the modern period, the disruption to NOAA services has cut that number to ~15,000 during late 2025. Due to additional delays in reporting, the February data set is reduced even further to ~6,000 stations. This number of weather stations remains more than adequate for constraining the global average, but regional gaps have left unusual holes on our maps and increased the uncertainty.
We wish to note that this situation has been slowly improving with some of the missing stations having been restored in recent months. NOAA’s pending launch of the Synoptic Summary of the Day (a replacement for the Global Summary of the Day) should also help, though the expected timeline for that launch is unknown.

Drawing on alternative data sources allows us to fill some of the gaps created by degraded and missing NOAA data aggregation services, but we still have less data than we would ordinarily expect.
It is normal to encounter sporadic delays in weather station reporting, and as a result, it is also normal to revise the analysis as more data becomes available. However, the current disruption resulting from the loss of NOAA services is larger than the typical delays and more spatially clustered. We expect the problems with NOAA data aggregation will ultimately be temporary, as the underlying weather stations still exist, and it is simply a matter of getting suitable access. Future revisions, Incorporating additional data, should reduce the current uncertainties to a more normal level.
ENSO Conditions
The equatorial Pacific had a La Niña in early 2025, transitioned back to neutral conditions in mid-2025 before dipping back into a La Niña state in late 2025 that has continued into 2026. This second La Niña dip is expected to be short-lived and already shows signs of dissipating.
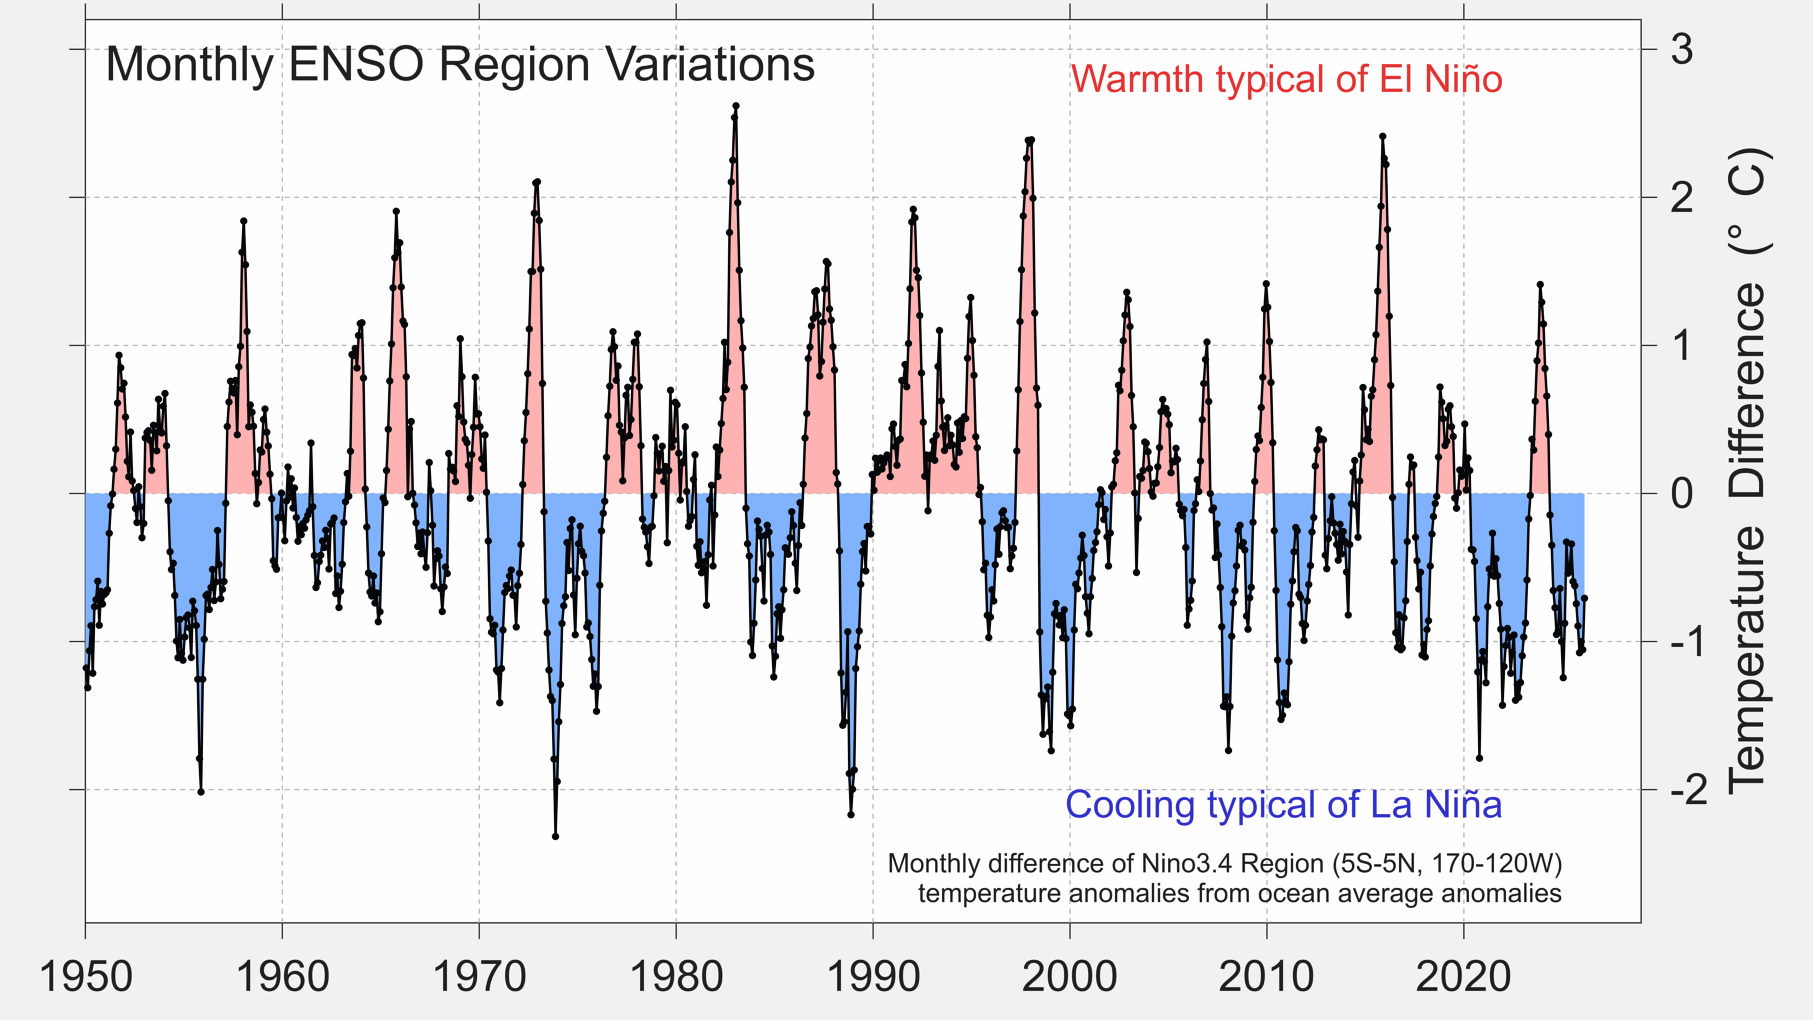
As of the most recent IRI CPC forecast a transition to El Niño conditions was considered likely in mid to late 2026. See the CPC report here.

However, even this forecast may understate the likely reality. Recent dynamical forecast models, not yet fully captured by the CPC, have been trending towards a strong to very strong El Niño developing in the second half of 2026. If this does occur, it would be expected to increased global average temperatures in 2026 and 2027.

2026 Outlook
With only two month completed, the forecast annual average of 2026 remains subject to considerable uncertainty. However, the increasing likelihood of a strong El Niño event has shifted the forecast range towards the higher end.
We now calculate a 16% change that 2026 will become the warmest year on record, up from a 10% chance at the start of the year. More likely it will become the 2nd warmest year (36% chance), 3rd warmest (20%) or 4th warmest (29%). The final ranking will likely depend strongly on the timing and strength of any El Niño event and the associated natural variability.
Additionally, there is a 30% chance that global average temperature anomalies for 2026 will exceed the 1.5 C (2.7 °F) benchmark above the 1850-1900 average.
Estimated Probability of 2026 annual average final rankings:
- 1st – 16%
- 2nd – 36%
- 3rd – 20%
- 4th – 29%
- 5th or lower – <1%
