Berkeley Earth, a California-based non-profit research organization, has been preparing independent analyses of global mean temperature changes since 2013. The following is our report on global mean temperature during 2022.
We conclude that 2022 was nominally the fifth warmest year on Earth since 1850. Our estimate of the global mean temperature in 2022 was slightly warmer than 2021 and similar to 2015. Given the uncertainties associated with temperature measurements, 2022 and 2015 are essentially tied, making 2022 consistent with either the fifth or sixth warmest year. .
The last eight years have included all eight of the warmest years observed in the instrumental record.
Year-to-year rankings are likely to reflect short-term natural variability. In 2021 and 2022, a persistent La Niña event has reduced temperatures somewhat compared to years without a La Niña event. Overall, the long-term trend remains consistent with an ongoing pattern of global warming. The cyclic warming and cooling due to El Niño and La Niña are one of the largest sources of year-to-year internal variability in the global average temperature, often adding or subtracting 0.1 °C from the global average. It is fairly likely that once El Niño related warming returns, that we will also see a new record warm year.
While not a record warm year overall, 8.5% of the Earth’s surface did have a record warm annual average locally in 2022. By chance, these areas coincided with a number of major population centers, including in Western Europe. We estimate that 850 million people experienced a record warm annual average in 2022. None of the Earth’s surface had a record cold annual average in 2022.
In addition, 2022 was notable for:
- New national record high annual averages for 28 countries, including the UK, Spain, France, Germany, New Zealand, and China
- Record warmth in Western Europe, including the first ever 40 °C day in the United Kingdom
- Ongoing long-lived La Nina event, providing a extended period of slightly reduced temperatures
- March heatwave in Antarctica that produced the highest temperature excursion above normal ever measured anywhere on Earth
- Droughts affecting Europe, China, and US Southwest. Floods in Pakistan.
- Nominally the 7th warmest year on land and the 6th warmest year in the oceans.
Annual Temperature Anomaly

The global mean temperature in 2022 is estimated to have been 1.24 °C (2.24 °F) above the average temperature from 1850-1900, a period often used as a pre-industrial baseline for global temperature targets. This is ~0.03 °C (~0.05 °F) warmer than in 2021. As a result, 2021 is nominally the fifth warmest year to have been directly observed, though the years 2015, 2017, 2018, 2021, and 2022 all cluster closely together relative to their uncertainty estimates. In particular 2022 and 2015 are essentially tied, and 2022 could just as easily be regarded as the 6th warmest year.
This global mean temperature in 2022 is equivalent to 0.91 °C (1.64 °F) above the 1951-1980 average, which is often used as a reference period for comparing global climate analyses.
The last eight years stand out as the eight warmest years to have been directly observed.
| Year | Rank | Warming in °C | Warming in °F |
| 2022 | 5 | 1.24 ± 0.03 | 2.24 ± 0.05 |
| 2021 | 7 | 1.21 ± 0.03 | 2.17 ± 0.05 |
| 2020 | 2 | 1.36 ± 0.03 | 2.45 ± 0.06 |
| 2019 | 3 | 1.33 ± 0.03 | 2.40 ± 0.06 |
| 2018 | 8 | 1.20 ± 0.03 | 2.16 ± 0.05 |
| 2017 | 4 | 1.27 ± 0.02 | 2.29 ± 0.04 |
| 2016 | 1 | 1.37 ± 0.03 | 2.46 ± 0.05 |
| 2015 | 6 | 1.23 ± 0.03 | 2.22 ± 0.05 |
| 2014 | 9 | 1.09 ± 0.03 | 1.96 ± 0.05 |
| 2013 | 13 | 1.02 ± 0.03 | 1.83 ± 0.05 |
| 2012 | 16 | 1.00 ± 0.04 | 1.79 ± 0.06 |
| 2011 | 19 | 0.98 ± 0.03 | 1.76 ± 0.06 |
| 2010 | 10 | 1.09 ± 0.03 | 1.96 ± 0.05 |
The temperature uncertainties can be visualized using the schematic below where each year’s temperature estimate is represented by a distribution reflecting its uncertainty. In the analysis that Berkeley Earth conducts, the uncertainty on the mean temperature is approximately 0.03 °C (0.05 °F) for recent years. The global mean temperature in 2022 fell squarely between those observed in 2015 & 2017. These three years have substantially overlapping uncertainties, leading to an associated uncertainty in the true relative rankings of these years.

The last eight years have been part of a period of significant warmth well above all previous years since 1850. This reflects the long-term trend towards global warming. Though 2022 is cooler than some of the other recent years, its overall temperature remains consistent with the long-term warming trend.
Land Average Temperature in 2022
On land, 2022 was nominally the seventh warmest year observed, and is effectively tied with 2021 and 2015.

In 2022, the land average temperature was 1.70 ± 0.04 °C above the average temperature from 1850 to 1900. As discussed below, though it was only the fifth warmest year globally, some territories saw record warm annual averages in 2022.
Temperature Distribution in 2022
The following map shows how local temperatures in 2022 have increased relative to the average temperature in 1951-1980. Prominent warmth over Europe and Asia is visible this year, as is La Niña associated cooling in the Pacific.

As can be expected from the global warming caused by greenhouse gases, the temperature increase over the globe is broadly distributed, affecting nearly all land and ocean areas. In 2022, 88% of the Earth’s surface was significantly warmer than the average temperature during 1951-1980, 7% was of a similar temperature, and only 5% was significantly colder.
We estimate that 8.5% of the Earth’s surface set a new local record for the warmest annual average. As discussed below, these locations with record warm annual averages are home to ~850 million people.
In 2022, no places on Earth experienced a record cold annual average.

Land areas generally show more than twice as much warming as the ocean. When compared to the 1850-1900 averages, the land average in 2022 has increased 1.70 ± 0.04 °C (3.07 ± 0.07 °F) and the ocean surface temperature, excluding sea ice regions, has increased 0.86 ± 0.04 °C (1.55 ± 0.06 °F).
2022 is nominally the 7th warmest year on land, though the difference between 5th, 6th, and 7th is negligible. For the ocean surface, we find that 2022 nominally ranks as the 6th warmest year. However, the differences between the 5th, 6th, 7th and 8th warmest years in the ocean are all small compared to the measurement uncertainty. The following figure shows land and ocean temperature changes relative to the average from 1850 to 1900. The tendency for land averages to increase more quickly than ocean averages is clearly visible.

As in other recent years, 2022 also shows strong warming over the Arctic that exceeds the Earth’s mean rate of warming. Over the last 40 years, the Arctic has warmed at ~4 times the average global rate. This is consistent with the process known as Arctic amplification. By melting sea ice and decreasing snow cover, warming in the Arctic allows more sunlight to be absorbed, which in turn leads to additional warming. However, 2022 was not as warm as other recent years, and is ranked only 10th overall, slightly ahead of 2021, but significantly cooler than 2020 or 2016. Similarly, Arctic sea ice melt in 2022 was less extreme than other recent years, though still well ahead on what was typical 30 years ago.

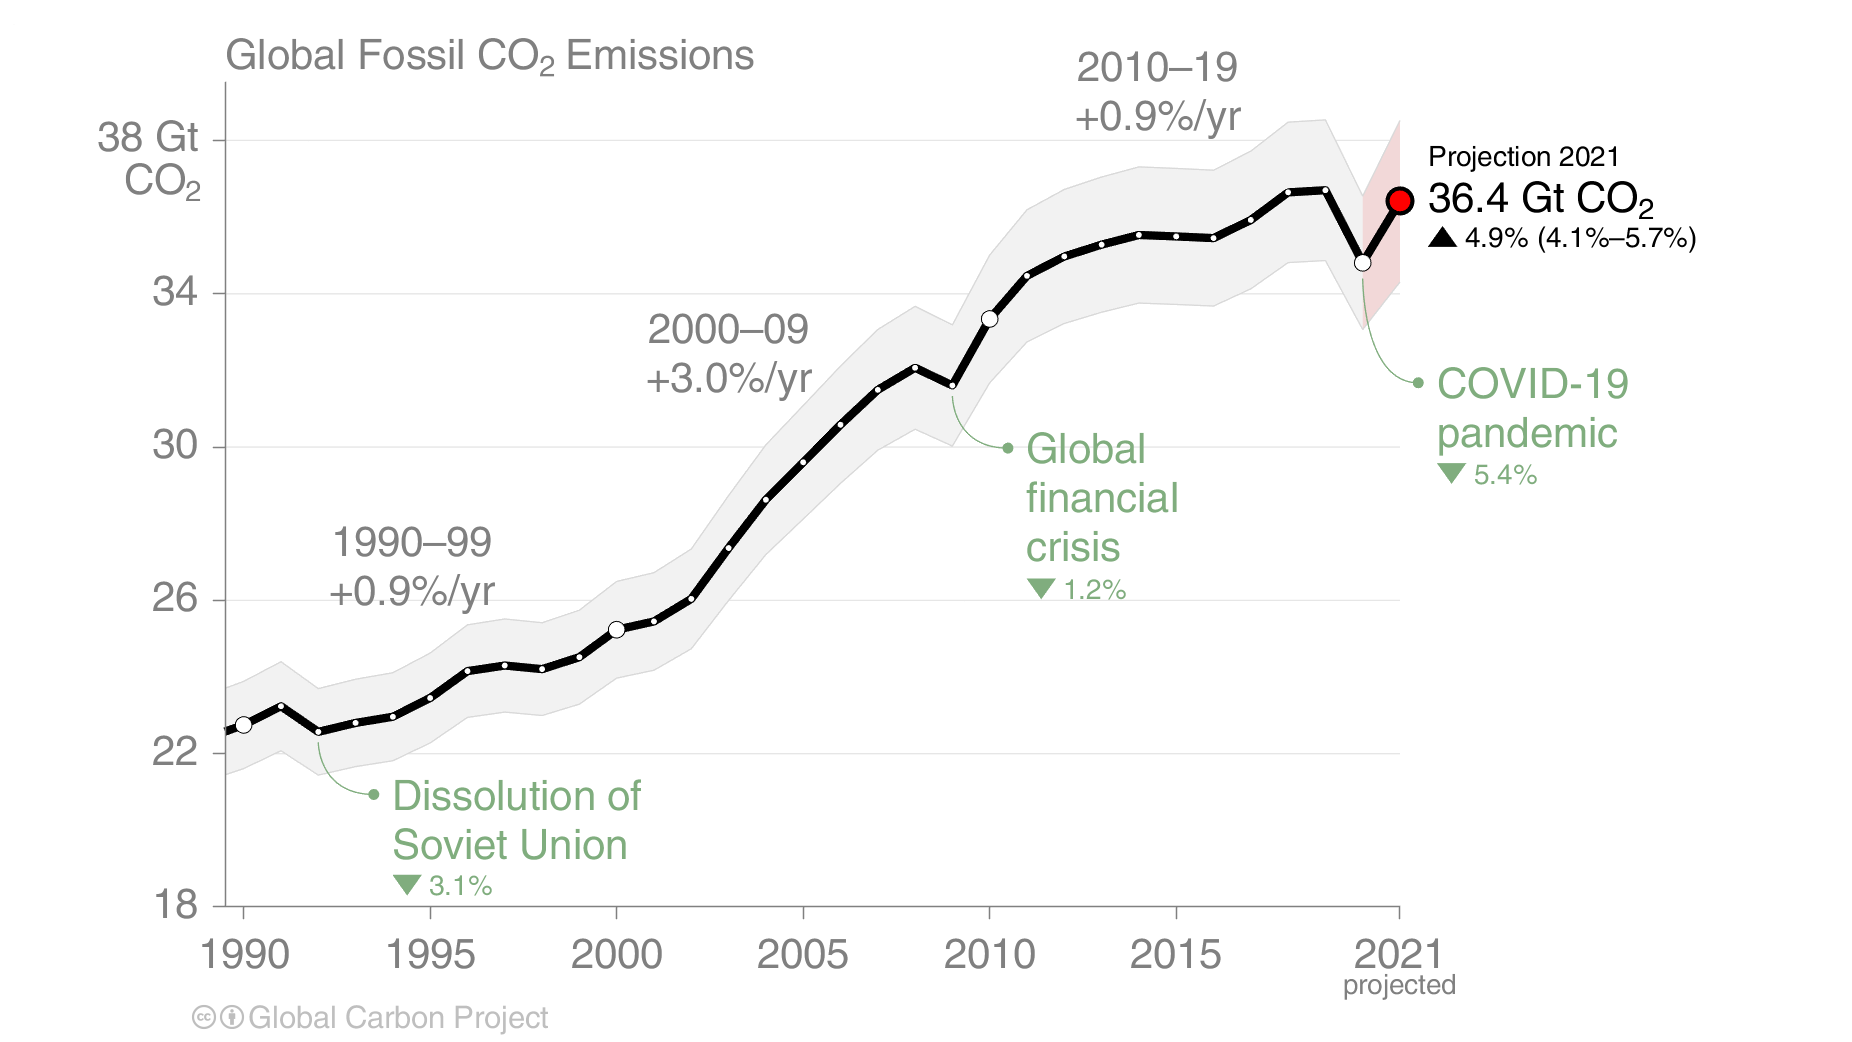
Both the tendency for land to warm faster than ocean and the higher rate of warming over the Arctic are expected based on our understanding of how increases in greenhouse gas concentrations will impact the Earth’s climate. As has been reported by the Global Carbon Project and other observers, 2022 saw a new record for the level of carbon dioxide in the atmosphere. This is due to the continued accumulation of carbon dioxide from human activities. The annual amount of carbon dioxide emitted in 2022 was 1.0% higher than 2021 and set a new all-time high. The previous record high for carbon dioxide emissions occurred in 2019 before a brief decline due to the COVID-19 pandemic.
Development of La Niña
The emergence of the La Niña weather phenomenon in the latter half of 2020 had a substantial influence on temperatures at the end of 2020, and an even larger impact on 2021 and 2022.
La Niña is characterized by the emergence of a large area of relatively cool water in the eastern equatorial Pacific, as can be clearly seen in the annual average map above. In addition to the immediate cooling in the Pacific, La Niña can have far-reaching effects on global circulation and weather patterns. This disruption of weather patterns tends to be associated with an extended period of somewhat reduced global average temperatures that can last for months beyond the peak of the La Niña in the Pacific.
Notably, the monthly time series of ocean average temperatures shifted sharply lower at the end of 2020 due to La Niña, and has remained below the highs seen in 2016 and 2020. These somewhat reduced ocean temperatures helped to keep the global average temperature in 2022 lower than in other recent years.

Ocean temperatures in the equatorial Pacific have maintained their La Niña conditions throughout 2022. The current La Niña began in 2020 and is expected to continue into early 2023, making it relatively long-lived. During La Niña conditions, the Eastern Equatorial Pacific Ocean is characterized by below normal temperatures, and increased downward transport of surface heat. As a result, global mean temperatures tend to be somewhat lower during La Niña years. During El Niño years, the opposite is present, as warm water in the Eastern Pacific releases extra heat into the atmosphere.

Roughly speaking, we expect each 1 °C (2 °F) temperature shift in the main El Niño / La Niña region to drive a corresponding ~0.1 °C (~0.2 °F) variation in the global mean temperature, with a lag of 3-6 months. In other words, we expect the effect of La Niña in 2022 was roughly to make the annual average ~0.1 °C (~0.2 °F) colder than it might otherwise have been.
When the variability in the Pacific inevitably shifts back towards an El Niño — as appears likely in mid-to-late 2023 — the additional 0.1-0.2 °C (0.2-0.4 °F) of warmth expected to be released by El Niño will greatly increase the odds that the following year will be a new record for global average temperature (i.e. a possible 2024 record, if El Niño does return in mid/late 2023).
National Average Temperature
Though the focus of our work is on global and regional climate analysis, it is also possible to use our data to estimate national temperature trends.
In Berkeley Earth’s estimation, 2022 had the warmest annual average since instrumental records began in the following 28 countries:
Afghanistan, Andorra, Belgium, Bosnia and Herzegovina, China, Croatia, Fiji, France, Germany, Ireland, Italy, Kyrgyzstan, Liechtenstein, Luxembourg, Malta, Monaco, Morocco, New Zealand, Papua New Guinea, Portugal, San Marino, Spain, Switzerland, United Kingdom, Tajikistan, Tonga, Tunisia, and Vanuatu
This is similar to 25 countries that set national average records in 2021 and significantly fewer than the 45 countries that experienced record warming in 2020. However, it still represents a substantial fraction of the world’s population that has just lived through the warmest year in their local history. Looking at the specific sub-national locations where record annual averages occurred, we estimate that approximately 850 million people live in places that observed their locally warmest year during 2022.
The following chart provides a summary of the warming that countries experienced in 2022 relative their 1951 to 1980 averages.

These estimates for the changes in national annual average temperatures are derived from our global temperature fields. Due to uncertainties in the analysis and the limits of our spatial resolution some national average estimates may differ slightly from the values reported by their respective national weather agencies.
During 2023, Berkeley Earth will be launching an updated high resolution analysis which will improve our ability to characterize such local, regional, and national changes, and reduce uncertainties associated with topography and small-scale weather variability.

Temperatures in Europe
Western Europe was particularly noteworthy for extraordinary warmth in 2022, with many countries setting new national records, including, Spain, France, Germany, Italy, and the United Kingdom.
Governments in Europe attributed more than 26,000 deaths to summer heat waves, though this may be an underestimate as 53,000 excess deaths were reported in July alone. The summer heat waves included the first ever 40 °C (104 °F) day in the UK, a milestone that would be virtually impossible without global warming and was also met with an outbreak of wildfires.
The associated summer drought was one of the worst in Europe during the last 500 years. Warm weather in Europe continued all the way into winter, and has resulted in unusually low levels of snow in the Alps.

Considered as a whole, the European continent experienced it’s second warmest year on record in 2022.

Weather station chart showing the July heat wave that ultimately pushed multiple UK weather stations above 40 °C for the first time since observations have begun, greatly exceeding previous measurements at this site and setting a new all-time record in the process.

Antarctic Heatwave
One of the most remarkable weather events in 2022 was the March heatwave impacting Antarctica.

An intrusion of an atmospheric river into the Antarctic plateau briefly pushed local temperatures at the manned Vostok station +38.5 °C (+69.3 °F) above normal for this time of year.
This is the largest temperature excursion above normal ever measured at any weather station anywhere on Earth.
Monthly Temperature Patterns
Every month in 2022 was at least 1.0 °C (1.8 °F) warmer than the 1850 to 1900 average. However, the first several months of the year were relatively cool compared to other recent years, partly due to the effects of La Niña. June was the only month in 2022 that set a record high average for the month. The relatively coldest month was November which ranked 13th in 2022.


Long-term Trend
Though it is interesting to understand the characteristics of individual years, global warming is ultimately about the long-term evolution of Earth’s climate. The following chart shows a ten-year moving average of the Earth’s surface temperature, plotted relative to the average temperature from 1850-1900.

Since 1980, the overall trend is +0.19 °C/decade (+0.34 °F/decade) and has changed little during this period. By continuing this trend, we can make a rough guess of how the near-future climate may develop if the forces driving global warming continue to progress at their present rate.
As shown in the chart, several recent years have had temperatures more than 1.2 °C (2.2 °F) above the average temperature from 1850-1900, often used as an estimate of the pre-industrial climate. The Paris Agreement on Climate Change aims to keep global temperature rise to well below 2 °C (3.6 °F) and encourages parties to strive for warming of no more than 1.5 °C (2.7 °F). At the current rate of progression, the increase in Earth’s long-term average temperature will reach 1.5 °C (2.7 °F) above the 1850-1900 average by around 2034 and 2 °C (3.6 °F) will be reached around 2060. The increasing abundance of greenhouse gases in the atmosphere due to human activities is the direct cause of this recent global warming. If the Paris Agreement’s goal of no more than 2 °C (3.6 °F) warming is to be reached, significant progress towards reducing greenhouse gas emissions needs to be made soon.
Global Mean Temperature Prediction for 2023
Based on historical variability and current conditions, it is possible to roughly estimate what global mean temperature might be expected in 2023. Our current estimate is that 2023 is likely to be similar to 2022 or slightly warmer. With the current continuation of La Niña conditions, it is likely that 2023 remains relatively cool. The swings from El Niño to La Niña and back again are the largest source of interannual variability in the global temperature record, with La Niña associated with cooler conditions. However, there remains a modest chance (14%) that 2023 could end up as a new warmest year if the El Niño / La Niña system swings back to warmth early in 2023.
It is nearly certain (>99% likelihood) that 2023 will remain within the top-ten warmest years; however, there is a ~50% chance that 2023 will rank no higher than the 5th warmest year.

Though 2023 is expected to be somewhat cool, that does not mean that global warming has stopped. Like 2022, the central estimate for 2023 remains close to the long-term trend. Minor year-to-year fluctuations are entirely natural and may provide the world with a year of slightly less exceptional weather, but over the long-term temperatures are expected to continue along a warming trend as long as humans continue to add additional greenhouse gases to the atmosphere.
A potential shift towards El Niño in mid-to-late 2023 would likely push 2024 towards record warmth.
Comparisons with Other Groups
When preparing our year-end reports, Berkeley Earth traditionally compares our global mean temperature analysis to the results of four other groups that also report global mean surface temperature. The following chart compares Berkeley Earth’s analysis of global mean temperature to that of the NASA’s GISTEMP, NOAA’s GlobalTemp, the UK’s HadCRUT, and ECMWF‘s reanalysis. All of these groups produce a similar understanding of recent climate change. As of the time this document was being finalized, 2022 values for HadCRUT were not available.

While Berkeley Earth and ECMWF view 2022 as nominally the 5th warmest year, NASA and NOAA place 2022 as nominally the 6th warmest year. Given the tiny margin of difference between the 5th and 6th warmest years, we don’t consider these differences between analysis groups to be significant.
Slight disagreements in the ranking are common and reflect both the uncertainty in these estimations and the differences in how various research programs look at the Earth. Each uses a somewhat different selection of source data and different methods of interpolation and correcting for measurement errors. Some methods are more limited than others. For example, NOAA omits most of the polar regions when estimating mean temperature changes. As a result, it is not surprising to see small disagreements among the groups.
Methodology
In reconstructing the changes in global mean temperature since 1850, Berkeley Earth has examined 21 million monthly-average temperature observations from 50,498 weather stations. Of these 18,460 stations and 168,000 monthly averages are available for 2022.
The weather station data is combined with sea surface temperature data from the UK Met Office’s Hadley Centre (HadSST). This ocean data is based on 456 million measurements collected by ships and buoys, including 13 million observations obtained in 2022. We reprocess and interpolate the HadSST data to provide a more complete picture of the oceans. After combining the ocean data with our land data, we arrive at a global picture of climate change since 1850.
Uncertainties arise primarily from the incomplete spatial coverage of historical weather observations, from noise in measurement devices, and from biases introduced due to systematic changes in measurement technologies and methods. The total uncertainty is much less than the long-term changes in climate during the last 170 years.
This report is based on such weather observations as had been recorded into global archives as of early January 2022. It is common for additional observations to be added to archives after some delay. Consequently, temperature analysis calculations can be subject to revisions as new data becomes available. Such revisions are typically quite small and are considered unlikely to alter the qualitative conclusions presented in this report.
Copyright
This report was prepared by Berkeley Earth. The contents of this report, including all images may be reused under the terms of the Creative Commons BY-NC 4.0 copyright license for any non-commercial purpose and in any forum, consistent with the terms of that license.
Members of the news media may also use the materials in this report for any news reporting purpose provided that Berkeley Earth is properly acknowledged, without concern for whether or not the CC BY-NC 4.0 license is followed.
For more information about licensing for commercial purposes, please contact admin@berkeleyearth.org.
Data
Updated data files will appear at our data page, and are updated monthly.
In particular, monthly and annual time series are available.