On March 18th, 2022, a remote site on the Antarctic plateau known as “Dome C”, located at 3,233 meters above sea level, recorded a daily high temperature of -10.1 °C (+13.8 °F). Using Berkeley Earth’s historical temperature record, we calculated that the typical high temperature on March 18th is -48.6 °C (-55.5 °F). Hence, this reading was 38.5°C (69.3°F) warmer than the historic average temperature for this day — more degrees above average than most places in the Northern Hemisphere are above zero.
At 38.5°C (69.3°F) above normal, this appears to be a new world record for the largest temperature excess above normal ever measured at an established weather station.
Weather and climate are not the same, but global warming can affect the frequency of extreme events. Hence, it is useful to characterize such events and attempt to understand possible relationships to man-made warming. Such work is necessary to craft effective global warming mitigation policies and adaptation strategies. Attribution of extreme events to climate change — or not — is an emerging field in climate science that uses historical temperature records such as Berkeley Earth’s, along with in-depth statistical analysis and modeling, to assess the probability of an extreme weather event occurring with and without the contribution of anthropogenic warming.
Below is a step-by-step breakdown of Berkeley Earth’s preliminary rapid analysis of the Dome-C heatwave. This analysis was originally published as a Twitter thread by Berkeley Earth Lead Scientist Dr. Robert Rohde.
World Record Temperature Anomaly

The heat wave on the Antarctic plateau lasted ~8 days and peaked at nearly nearly 40 °C above average. This above measurement from near the manned research station at Dome C is supported by a wealth of corroborating evidence. It was widely predicted in weather forecasts and was seen at both manned and unmanned weather stations.

Most significantly, temperature measurements from the manned station at Vostok, 560 km away from Dome C, also registered an extraordinary heatwave at the same time as the observers on the ground at Dome C.

This Antarctic heatwave appears to have set a new world record for the largest temperature excess above normal.
There is no international agency that officially tracks records for temperature increases above normal. Hence it was necessary to independently review all available station data. Berkeley Earth, which already aggregates weather data from many sources, was well-placed to do this analysis. We screened historical temperature data from ~50,000 weather stations. Of these, approximately ~20,000 had a long enough history of daily high temperatures to establish expected normals for comparison. From these, 440 stations have ever observed a temperature above normal greater than 30 °C (54 °F). Only a handful of locations, all at high northern latitudes, had previously reported an excess as large as 35 °C (63 °F). All of these were manually reviewed, and no plausible prior measurements as high as 37 °C (67 °F) above normal were identified. A similar search conducted by Maximiliano Herrera also failed to identify any previous temperature excess events as high as 37 °C (67 °F) above normal. Further, inquiries to other colleagues identified no other known occurrences of heatwaves reaching more than 37 °C (67 °F) above normal.
Consequently, the 38.5°C (69.3°F) above normal observed at Dome C appears to be a new world record.
Due to the physical processes involved, heatwaves of this magnitude would only really be possible in extreme north or south latitudes during periods when very cold air is normally expected. At lower latitudes with warmer climates, the higher heat capacity of warmer air would likely prevent anomalies greater than 35 °C.
As a point of comparison, the stunning record high temperature of 112°F (44.4°C) recorded in Portland, Ore, on June 27, 2021, during the historic Pacific Northwest heatwave, was “only” approximately 20°C above average.
Indeed, of the few examples that do exist of plausible high temperatures in excess of 35°C above average, five sites are located in Siberia and three are found in Canada, all on land located near or above the Arctic Circle.
The peak reading from Vostok Station, Antarctica would also have been a world record if the Dome C measurement had not occurred on the same day. The Vostok high temperature of -17.7 °C (+0.1 °F), is 37.2 °C (67.0 °F) in excess of expected temperature at this time of year.
Can we conclusively rule out that a higher excess record has never been set elsewhere? No, we cannot. But based on the data available to us, this Antarctic heatwave would appear to have produced the most extreme excess that humans have ever directly measured.
Improving the instrumentation network by having additional long-duration temperature stations in these extreme latitudes in both Antarctica and above the Arctic Circle would provide valuable data, and might possibly identify more similar events.
Ensuring adequate funding for both the hardware installation and subsequent maintenance of meteorological stations in these extreme environments has historically been challenging, even though climate change in the polar environments is extremely important with respect to sea level rise and other risks.
Let’s talk about the weather…
The Antarctic heatwave was the result of a confluence of complex physical processes, and scientists will be working for some time to fully understand how these processes interacted to create this particular heat event. However, what we do know is that a number of meteorological phenomena were present around the Antarctic continent, all of which contributed in some way to creating the conditions for this record-breaking event
1. Atmospheric circulation brought air from the Southern Ocean into Antarctica
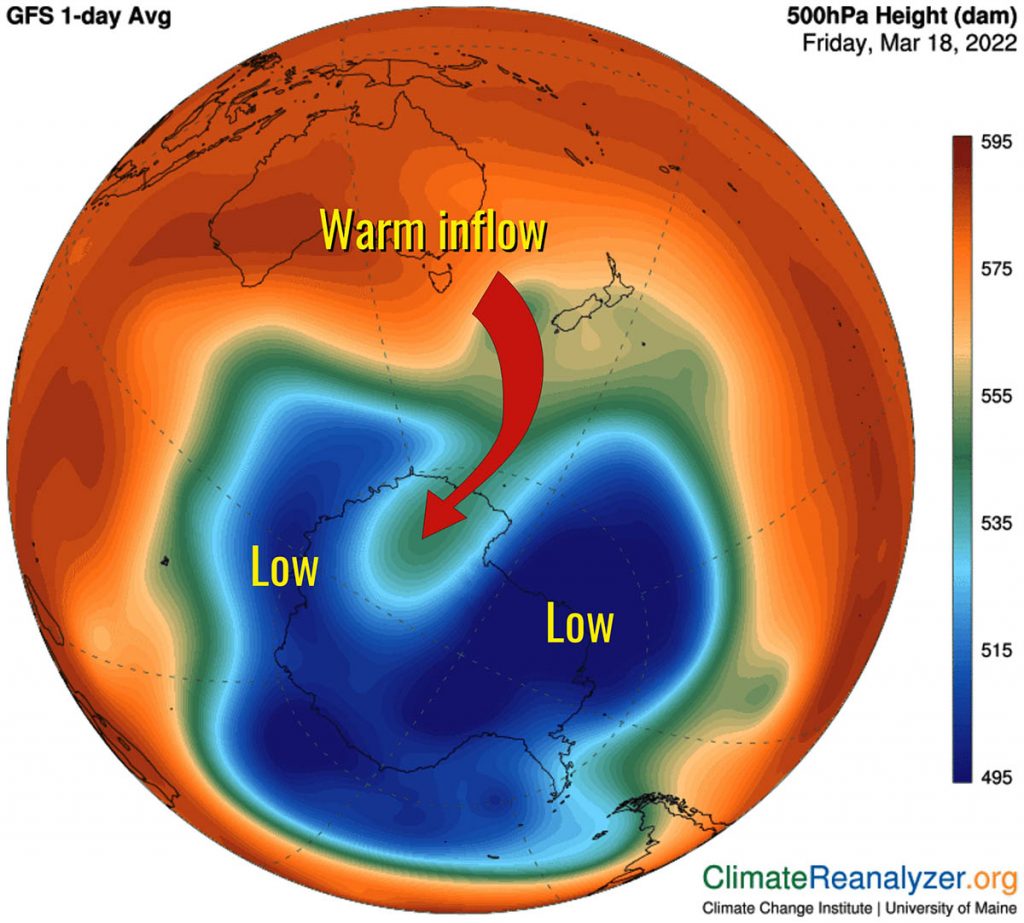
This particular heat wave was initially triggered by a fluctuation in large-scale atmospheric circulation that redirected warm air from the Southern Ocean onto the Antarctic plateau. Such conditions, reflecting a wavy or unstable jet stream, happen from time to time and in this context would frequently be associated with heatwaves.
2. The warm air brought with it an “atmospheric river”
An atmospheric river is a long and relatively narrow band of moisture-saturated air. They often form over oceans and are likely to bring high levels of precipitation when they interact with land. Atmospheric rivers are well-characterized weather phenomena, but are still relatively rare. At any given location over the Southern Ocean, an atmospheric river is present only ~1% of the time.
The presence of such an atmospheric river in the air that was redirected to Antarctica played an essential part in achieving the observed record. Moist air has a far higher heat capacity than dry air, meaning it has far greater potential to transfer warmth.
3. A “heat dome” stalled this warm, moist air over the continent.
After moving the warm, moist air mass to the Antarctic plateau, large-scale circulation patterns changed again. This caused the air mass to stall over the Antarctic plateau. A strong blocking high-pressure system formed over East Antarctica, preventing the heat and moisture from escaping. This pause allowed the heat from the atmospheric river — which was initially mostly at higher altitudes — the time it required to mix down to the surface, leading to significant surface-level temperatures.
4. Dry, cold air has low thermal conductivity
The Antarctic plateau has cold, bone dry air and low thermal conductivity at its surface. This means that it generally requires less energy input to “heat” than in other parts of the world, and large temperature swings occur more easily here. Similar temperatures swings would not be possible in most parts of the world.
5. March madness
March is Antarctica’s autumn; during this time of year temperatures generally fall rapidly. However, the water temperature of the Southern Ocean is still near its maximum end-of-summer warmth at this time. This creates an extremely large natural temperature contrast between ocean and continent. During this time of year, a movement of air from the Southern Ocean to the Antarctic plateau has near the maximum possible potential for warming.
6. Record sea ice minimum: observed, but causal relationship unclear at this time…
One other feature present, or rather absent, during this heatwave: The sea ice in Antarctica was near its record minimum low, having reached its all-time record low less than a month prior. These abnormally low sea ice conditions may have affected ocean temperatures or circulation patterns contributing to the formation of this particular heat wave, although more work is needed to fully understand these dynamics.

Historical data and preliminary statistical analysis
Accurate historical temperature records are indispensable to studying the nature of extreme events, a necessary first step in determining the impacts of climate change on extreme weather patterns.
To analyze the extreme nature of this event, we can start by evaluating the March temperature anomaly distribution relative to the historic averages. Longer historical records would be beneficial for this analysis, but using the ~30 years of historical temperature data available from Dome C, we are able to produce the following:

The distribution was already asymmetrical to the high side, an effect which gets really extreme if you include 2022 temperature observations. If you pretended this is a normal distribution, the standard deviation is about 5.5, and the 2022 peak would be a 7-sigma event. (Again for comparison, the record high temperatures recorded in Lytton, BC and Portland, OR during last summer’s Pacific Northwest heatwave were estimated to be 4- and 5-sigma events, respectively.)
But even before the 2022 Antarctic heatwave, this distribution was somewhat skewed on the high side, so additional analysis is helpful. Instead of looking at the whole distribution, we will consider each year’s highest March anomaly through the lens of extreme value theory.
Extreme value theory or extreme value analysis is a statistical technique that evaluates the extremeness of extremes; given an ordered set of data, extreme value theory can help us estimate the probability of events that are more extreme than any previously observed.
Using this approach, a plot of annual peak temperature anomalies in March vs occurrence frequency gives us a different way of understanding the likelihood of the March 2022 observed temperature anomaly.

In this case, the 30 previous years at Dome C suggest a warming event like the one we just saw might naturally occur every 200 years (with large uncertainty).
A once-in-200-years event would still be quite rare and unexpected, but not impossibly so. To what extent this event was a product of chance, or made more likely due to climate change, or a product of other factors at play, we can’t really say at this time just based on statistical analysis.
Climate models, while imperfect tools, can also help provide some insight.
An initial analysis of a large ensemble of climate simulations conducted by climate scientist Dr. Flavio Lehner did return a few events of similar behavior, suggesting that models may be a useful tool in understanding the likelihood and mechanics of such atmospheric river heatwave events. More work will be needed to establish that the models really do capture similar dynamics and establish their frequency, though it appears that the rate of occurrence is no more than once in at least several hundred simulated years.
Connection to global warming
The heatwave in Antarctica was an extraordinary event, setting a new apparent record for the most excessive warming above normal ever observed, and redefining what we understand is possible on the Antarctic continent. It might simply be a once-in-a-lifetime event, a statistical anomaly given the limited historical record of verified temperature data available from the polar regions. But it might also be influenced by climate change in ways climate scientists will seek to understand in the coming weeks and months.
To understand the extent to which anthropogenic climate change was involved in creating this record-setting heatwave, scientists will likely conduct an in-depth evaluation using climate models and other statistical analyses to estimate the likelihood that this event could have occurred with or without the contribution of warming due to greenhouse gasses. From there they will determine whether or not the Antarctic heatwave can be attributed to global warming, or whether it’s more likely to be a statistical anomaly. This analysis will take some time.
While the relationship between this particular heat event and anthropogenic warming remains under investigation, the correlation between global warming and the loss of sea ice in the polar regions is clearly defined and well understood. Moreover, at approximately the same time as this heatwave, an ice shelf in East Antarctica the size of New York City collapsed. This is first time that an ice shelf has collapsed in the previously stable region of East Antarctica. This ice shelf, which has likely been stable for thousands of years, had already been declining due to global warming. However, the heatwave may have been the final trigger to cause its demise.
As a continent, the average temperature in Antarctica has been increasing at approximately one half the rate of the global land average, making it the slowest warming continent. In addition, year-to year variability still plays a large role in Antarctic dynamics. Notably, the South Pole station recorded its coldest winter on record only a year ago. This contrasts with the rapid warming (and subsequent loss of Arctic sea ice) observed north of the Arctic Circle, where temperatures are rising at approximately four times the rate of the global average. While the situation in Antartica is complex, the long-term trend is towards warming. In particular, some areas like the Antarctic peninsula have seen quite rapid warming.

Of all extreme weather phenomena, heatwaves are understood to be the most closely correlated with global warming because high temperatures often directly track increases in average temperatures. Attribution analysis conducted by the World Weather Attribution group determined that the Pacific Northwest heatwave in June 2021, and the Siberian heatwave in June 2020, would have been virtually impossible were it were not for the contributions of anthropogenic warming. At first glance, the relationship to the Antarctic heatwave appears less clear due to the complicated dynamics involved, though further study is clearly warranted.
Of all the environments on Earth, Antarctica is among the least accessible to study. The recent heatwave has redefined our sense what is possible in Antarctic weather. Whether it is a once-in-a-lifetime fluke or a sign of things to come, we don’t really know. However, we certainly need to be paying attention to what is happening in Antarctica and investing the resources to maintain long-term climate records in that environment.
Additional Media Coverage of the Antarctic Heatwave
Bloomberg – Antarctica heatwave brings alarming temperature jump
CNN – Extraordinary Antarctica heatwave, 70 degrees above normal, would likely set a new world record