
The following is a summary of global temperature conditions in Berkeley Earth’s analysis of June 2026.
- June 2026 was nominally the 2nd warmest June on record, with a global average of 1.49 ± 0.10 °C (2.67 ± 0.19 °F) above the 1850–1900 average, behind only June 2024.
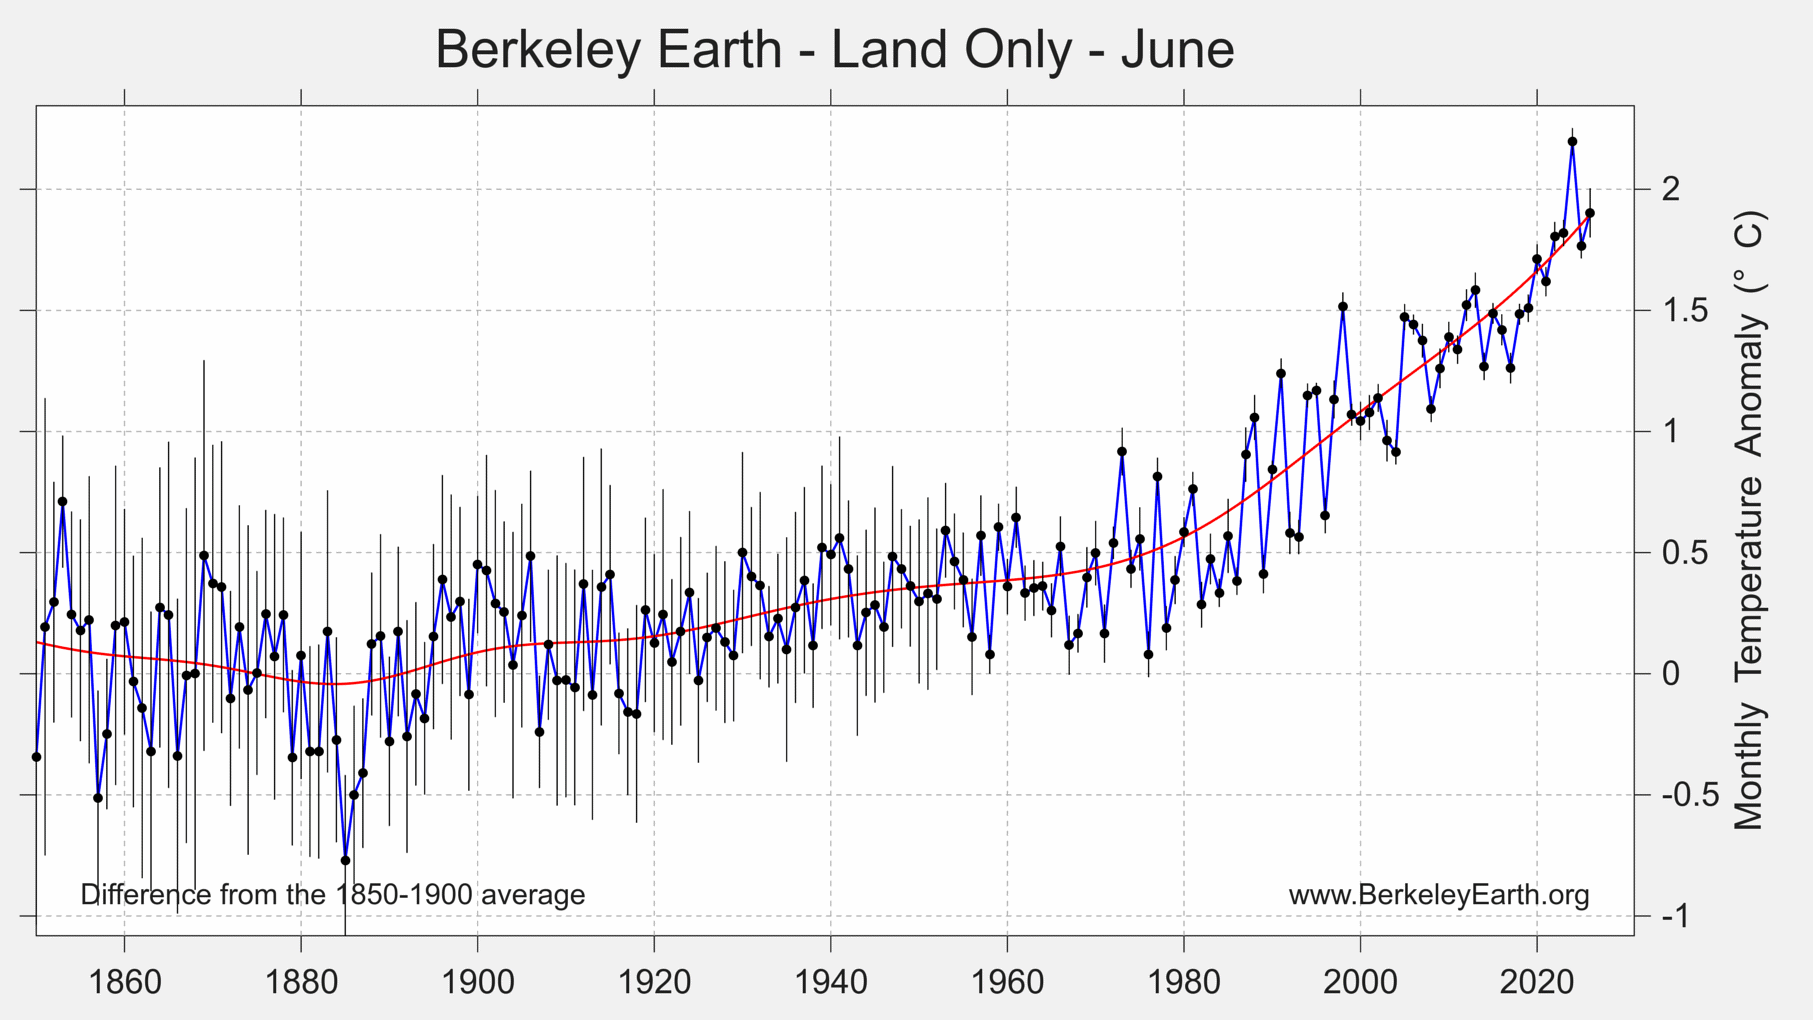
- Land temperatures averaged 1.90 ± 0.15 °C (3.42 ± 0.27 °F) above the 1850–1900 average, nominally the 2nd warmest June for terrestrial regions.
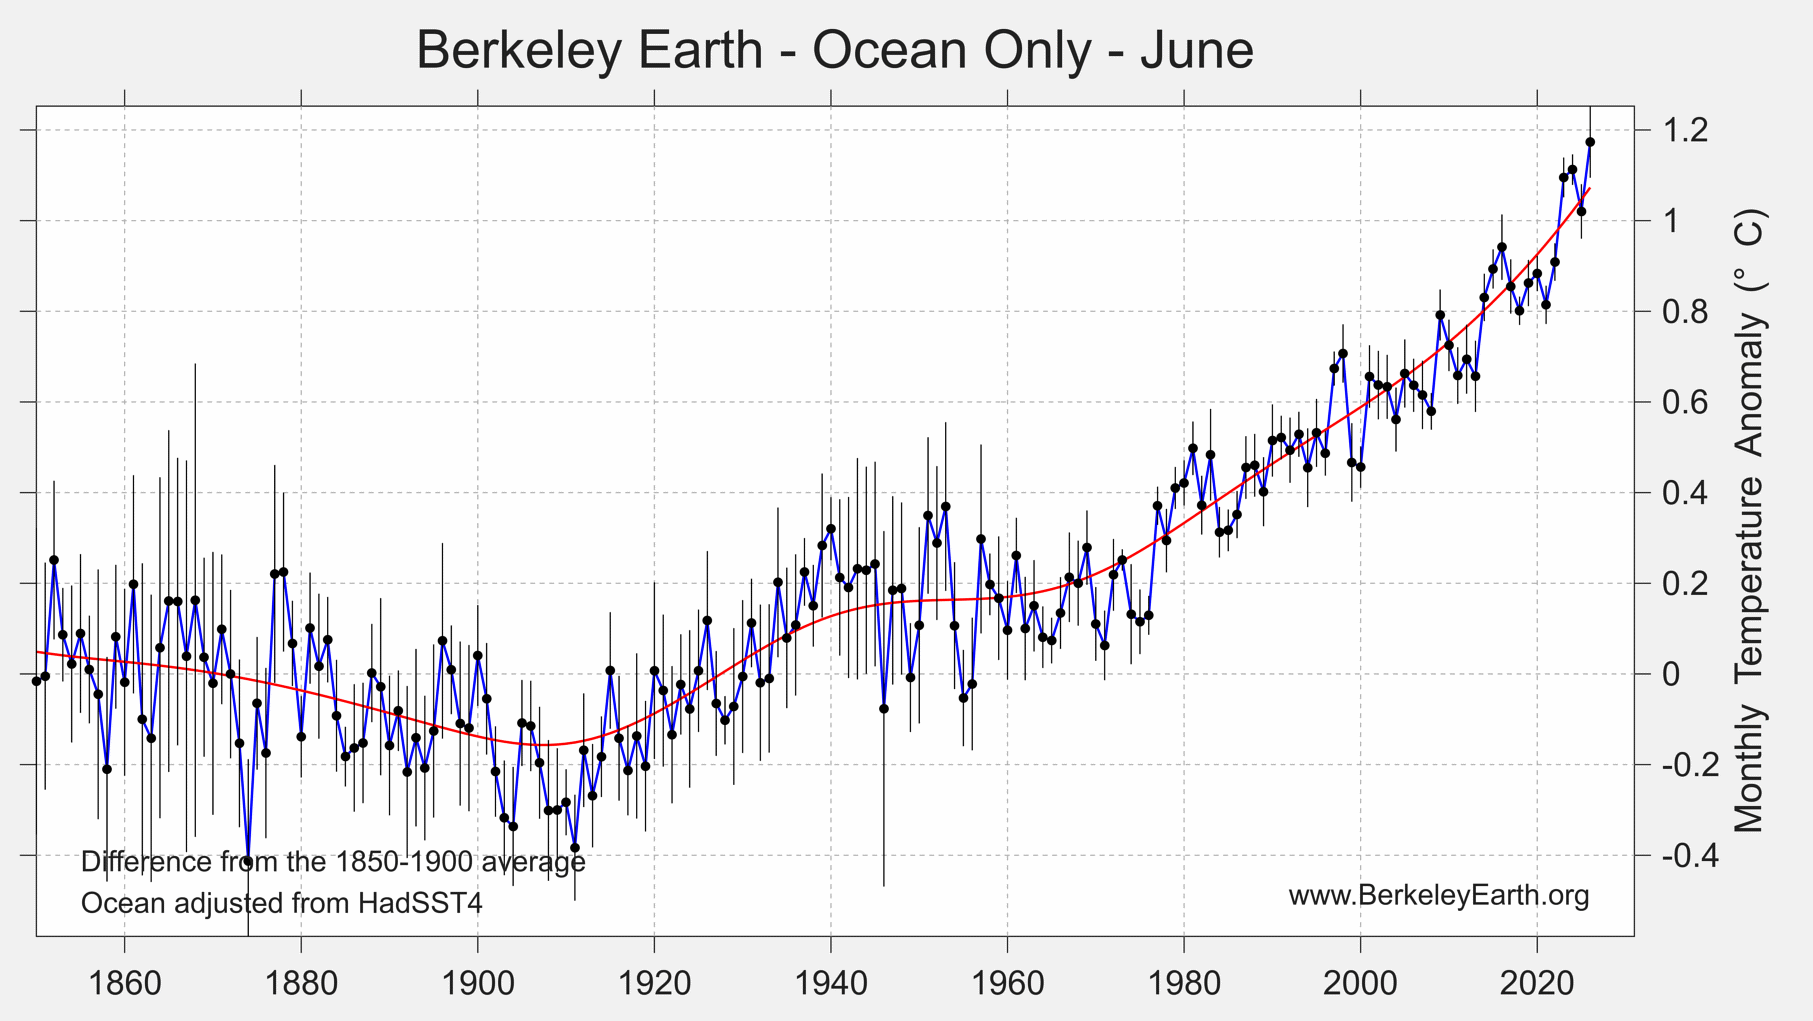
- Ocean temperatures were 1.17 ± 0.09 °C (2.11 ± 0.16 °F) above the 1850–1900 average — the warmest June on record for ocean surfaces.
- A new El Niño has strengthened rapidly. Forecasts now favor it becoming the strongest El Niño on record, peaking late in 2026.
- Roughly 5.0% of Earth’s surface experienced its warmest June on record (4.6% of land and 5.3% of ocean surfaces). At least 24 countries set national June records.
- 2026 now has about a 12% chance of becoming the warmest year on record, with a 2nd-place finish the single most likely outcome and roughly a 72% chance the annual average exceeds 1.5 °C.
Global Summary
According to Berkeley Earth’s high-resolution temperature dataset, June 2026 was nominally the 2nd warmest June since records began in 1850, with a monthly global average of 1.49 ± 0.10 °C (2.67 ± 0.19 °F) above the 1850–1900 (pre-industrial) average. This places June 2026 behind only June 2024. June is nominally slightly ahead of June 2023, though these two years are similar within error margins. All other Junes measured prior to 2023 are clearly not as warm as June 2026.
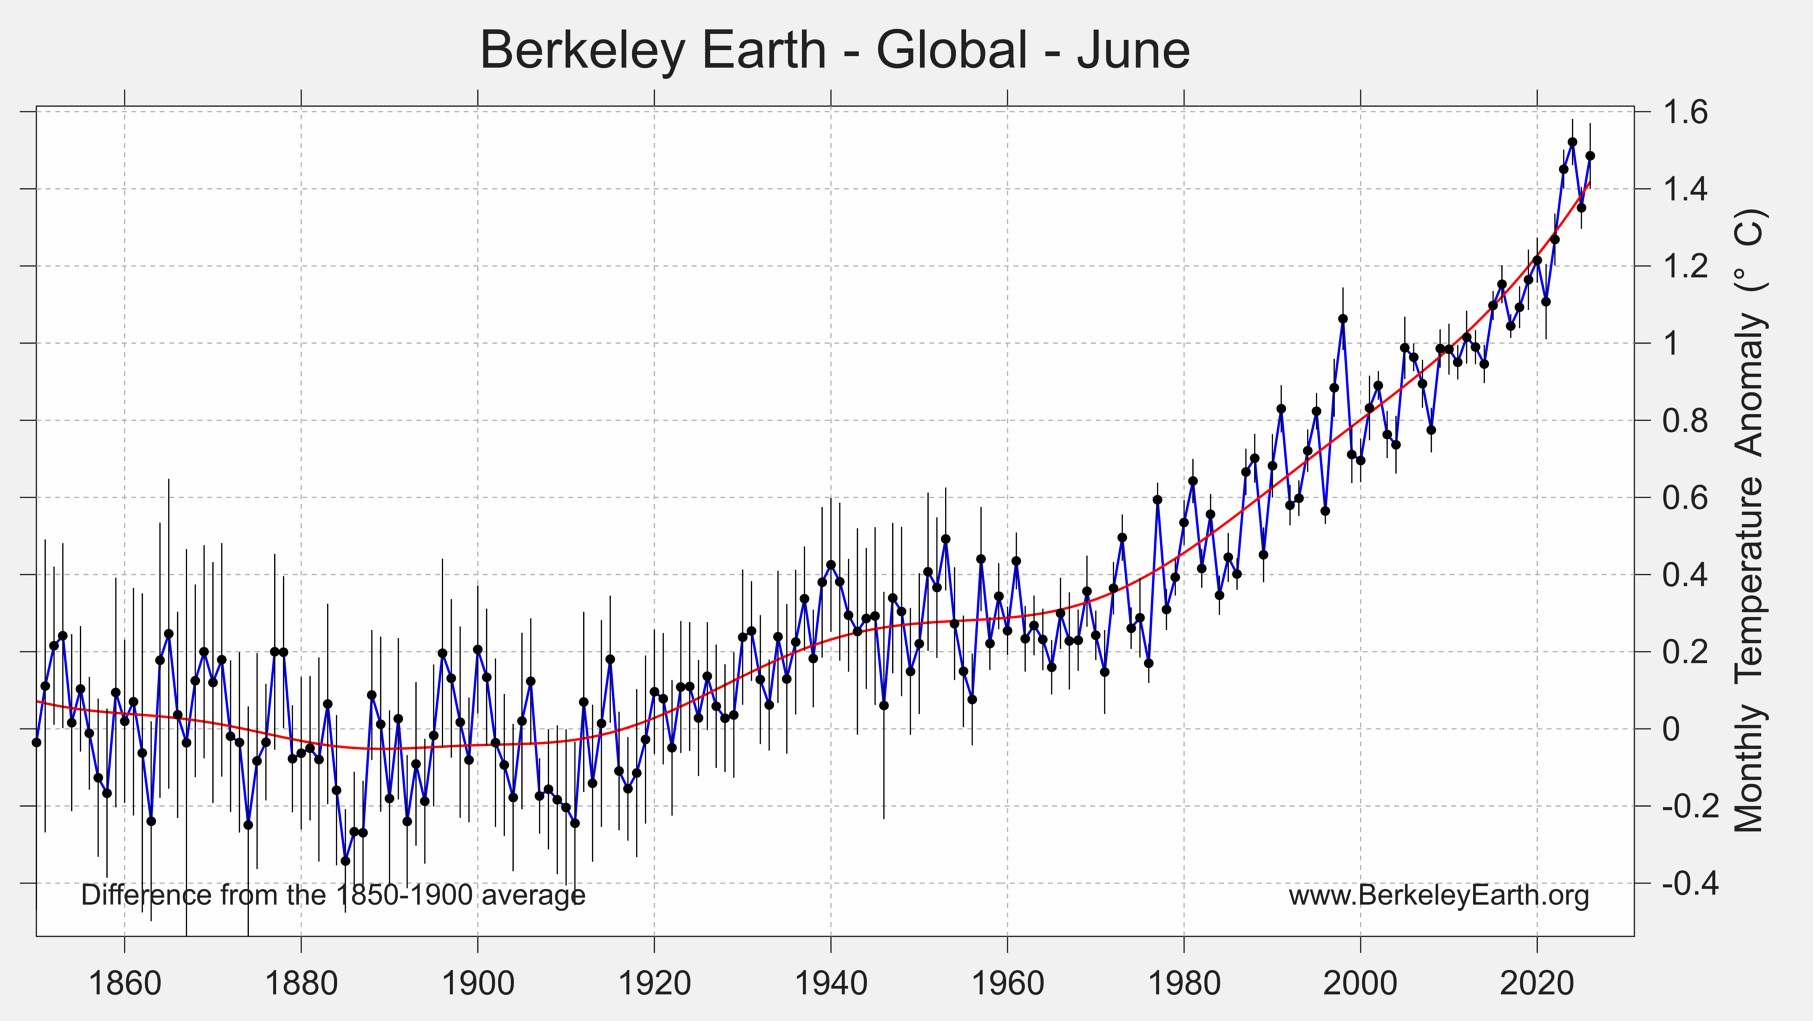
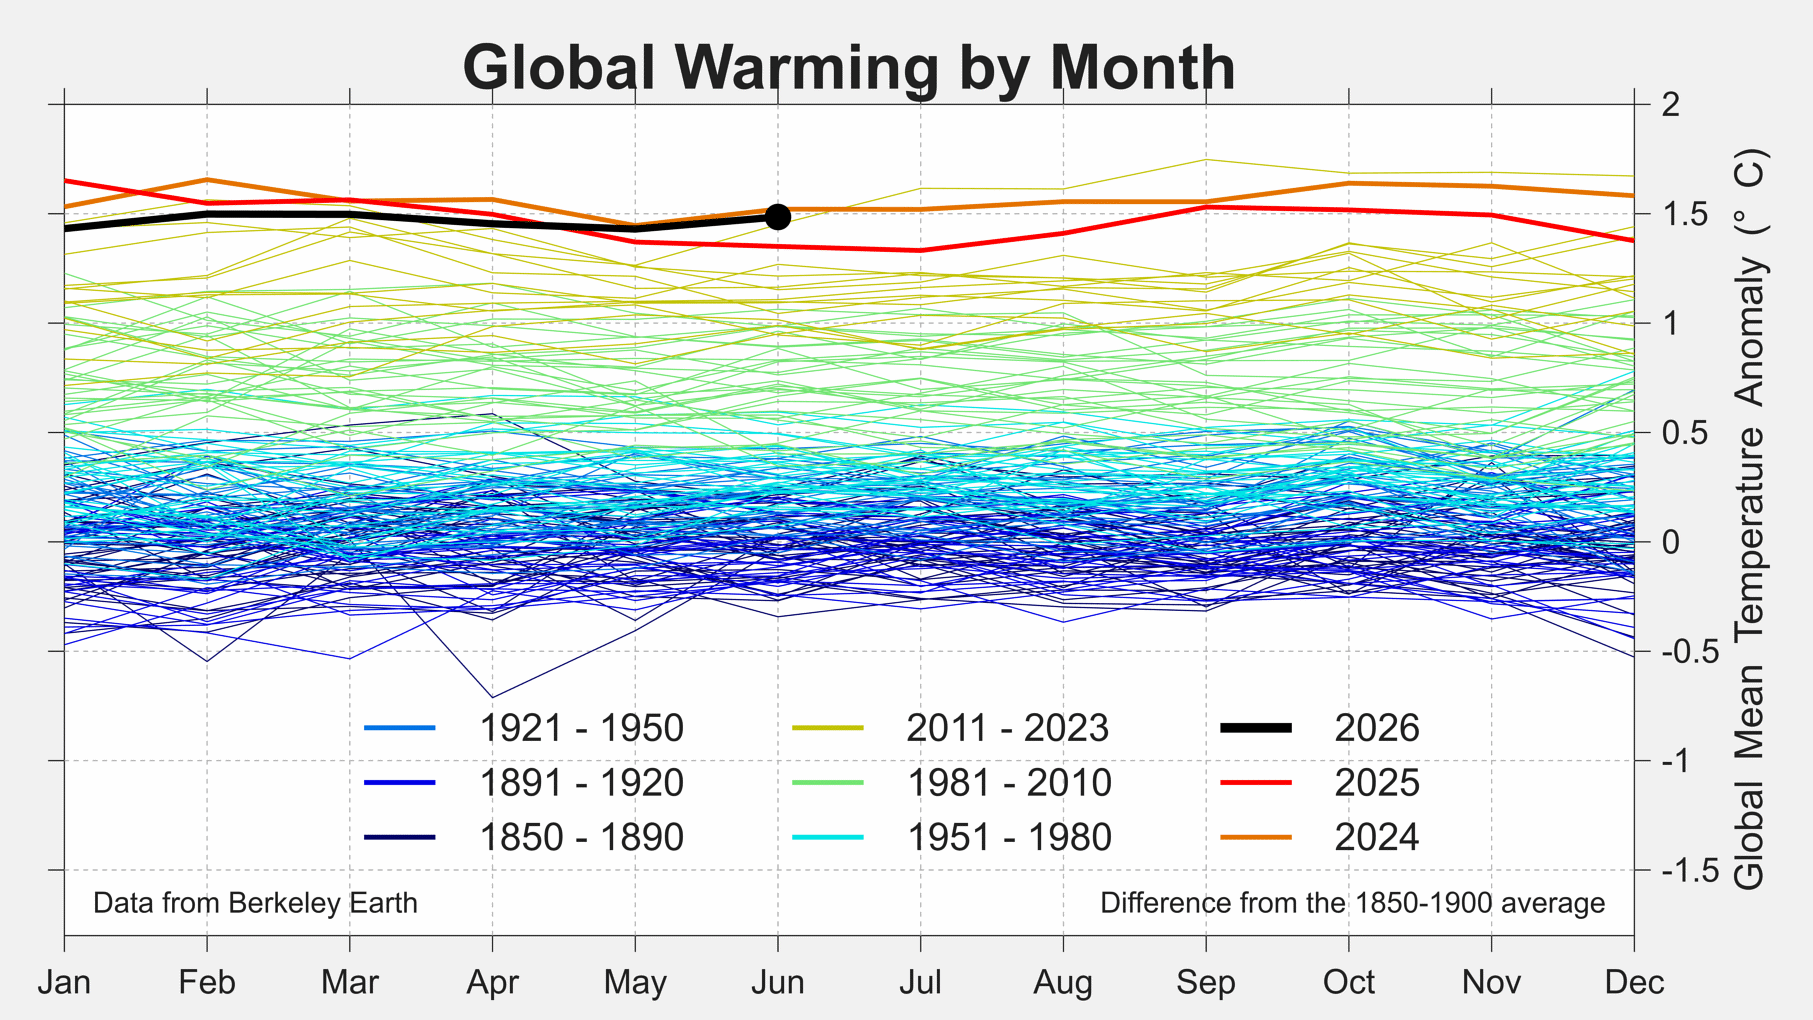
On a month-to-month basis, June 2026 was warmer than May 2026, but similar to other preceding months of 2026. Temperatures have risen back to just below the 1.5 °C (2.7 °F) Paris-aligned benchmark and now sit just above the long-term trend line as the developing El Niño begins to push conditions warmer. However, these conditions remain notably cooler than the record warm months in 2023 and 2024. So far, no month of 2026 has set a new monthly record average, with most lying between the 2nd warmest and 42 warmest.

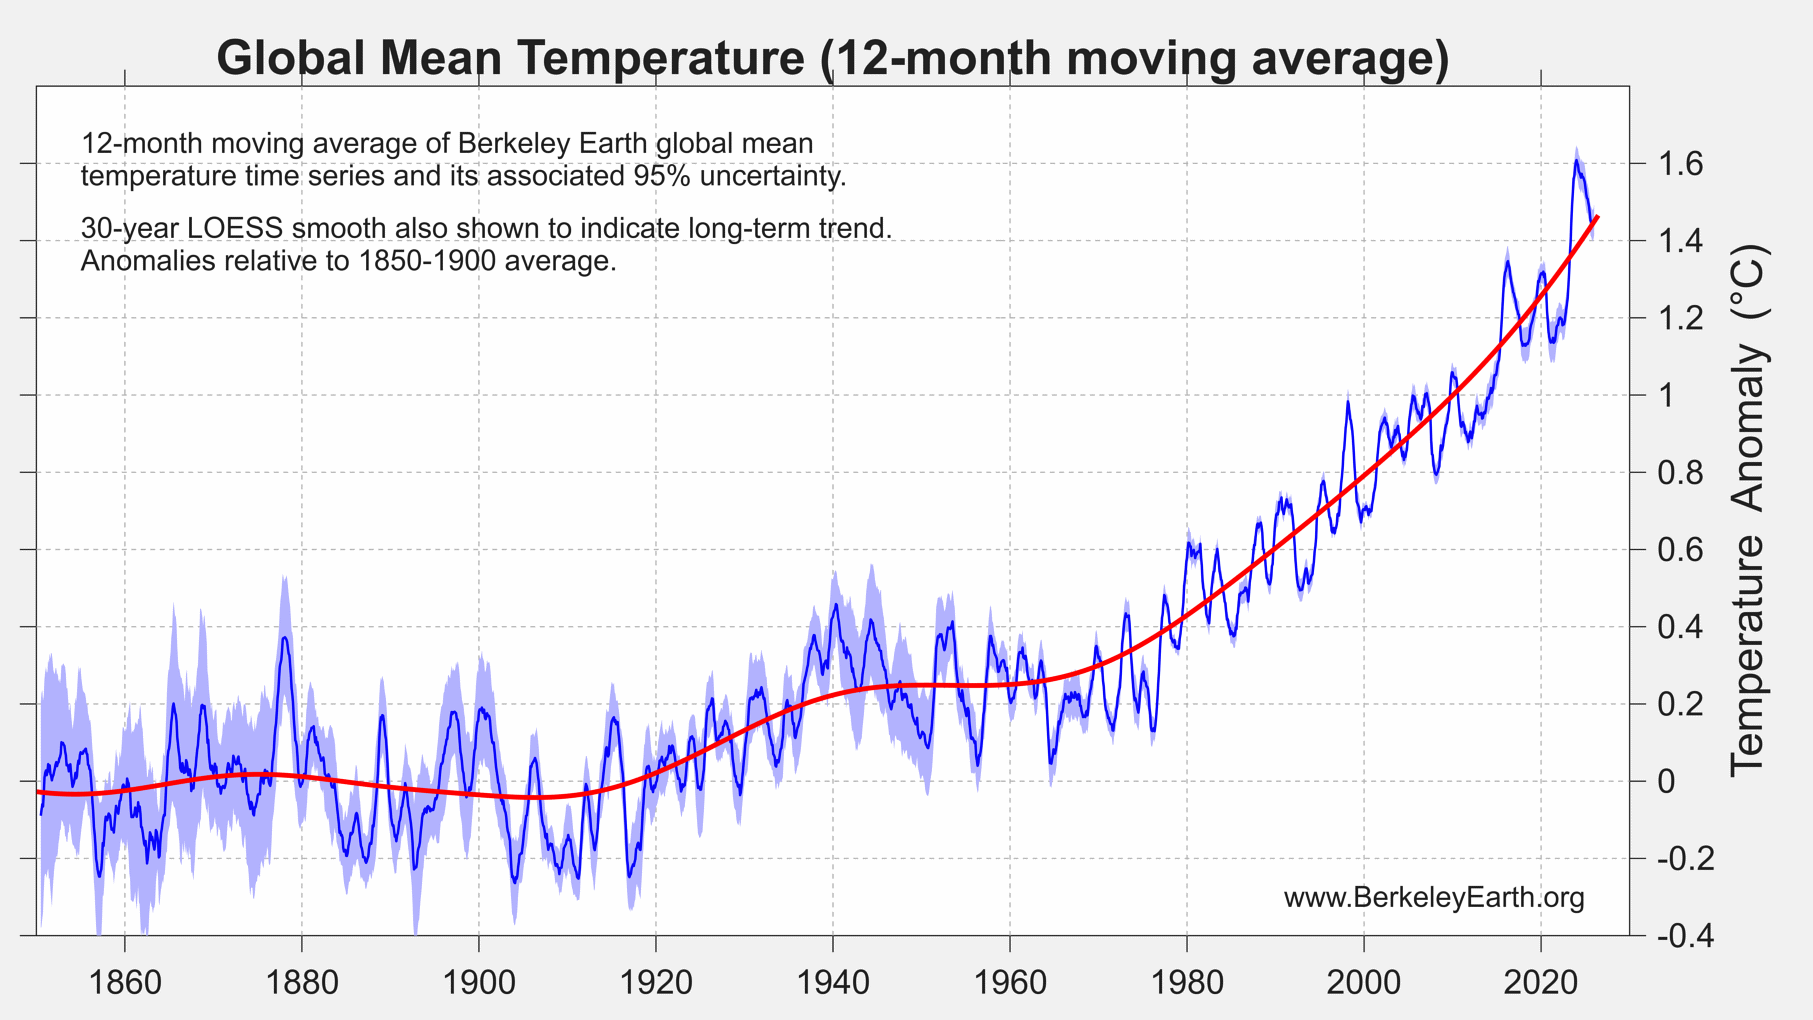
The 12-month moving average is now running close to the long-term trend line. The short-term natural variability that drove the exceptional warmth of 2023 and 2024 has dissipated, and after such an event we would ordinarily expect temperatures to dip temporarily below the trend. However, the arrival and rapid strengthening of a new El Niño, makes such a dip unlikely and we instead expect to see the moving average lift higher over the coming months. This short-term variability is an inherent part of the climate system and is expected even alongside persistent long-term global warming.
Spatial Variation
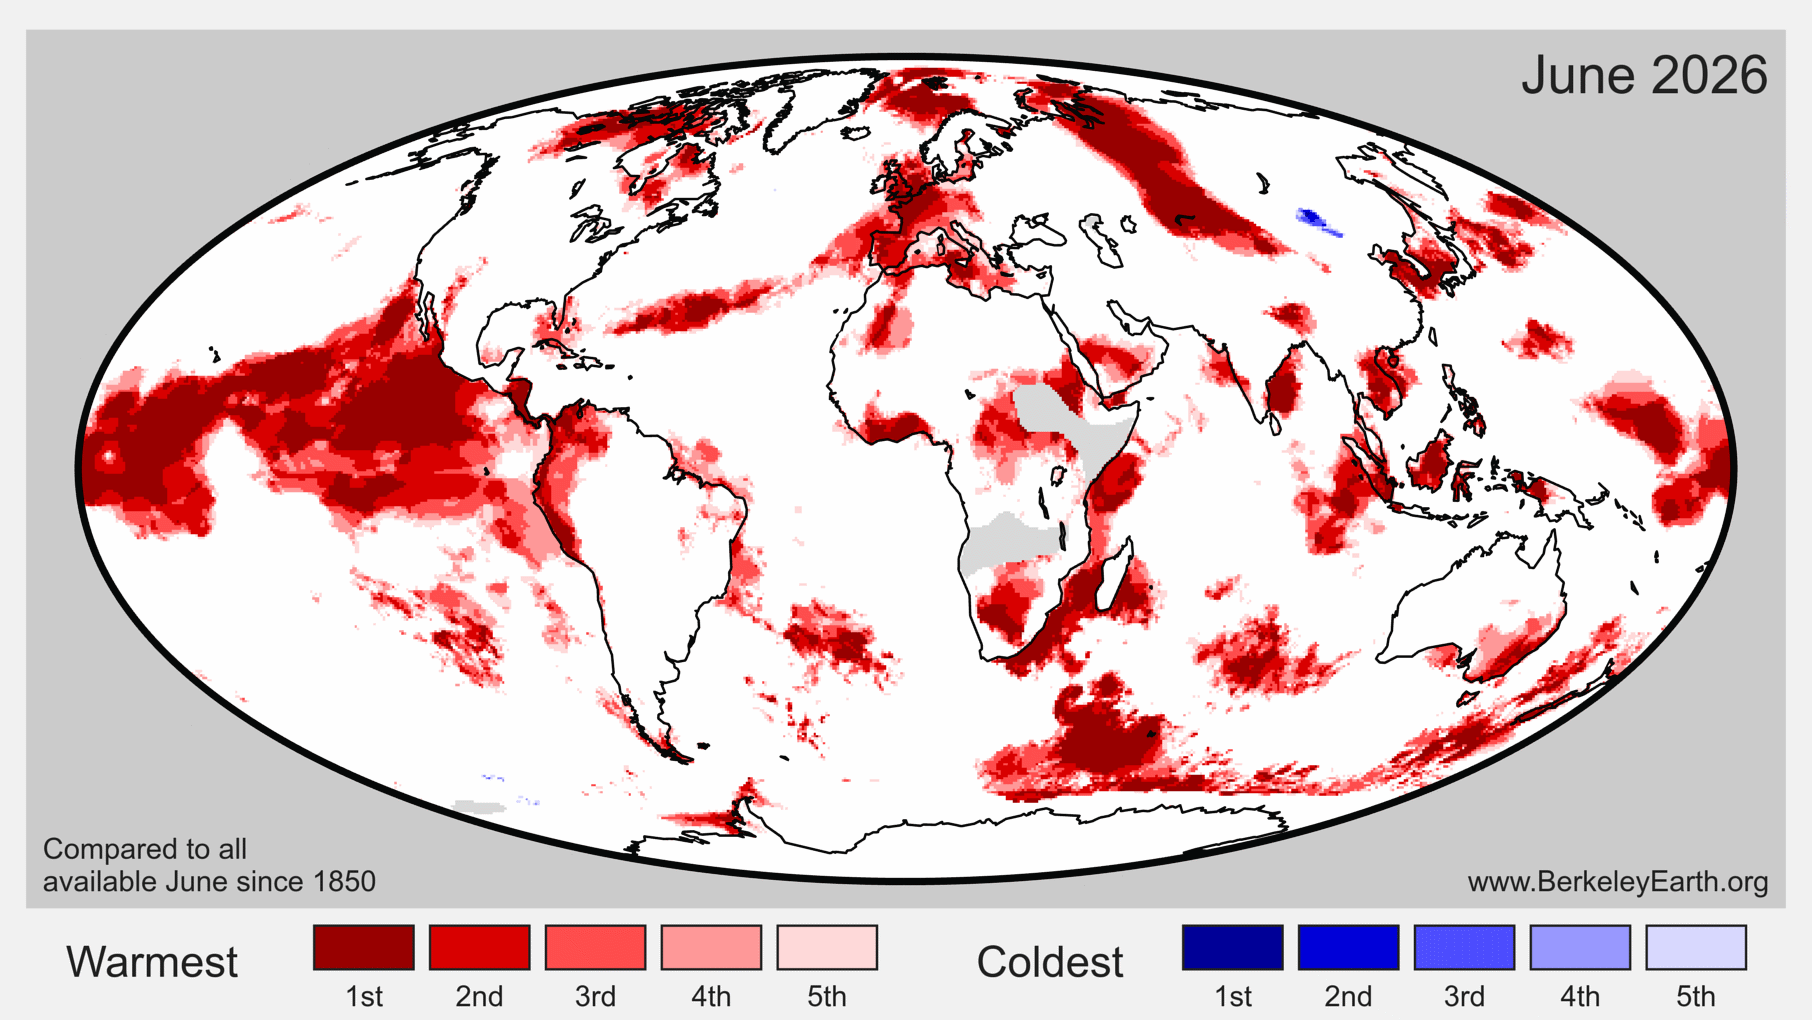
In June 2026, warmer-than-average temperatures were present across the overwhelming majority of the globe. They were especially prominent over Western Europe, the Mediterranean, north central Asia, and the central and eastern tropical Pacific, where the signature of the strengthening El Niño is now clearly visible. The most pronounced cool anomalies were confined to a portion of China and Antarctica.
In the northern mid-latitudes, June temperatures were shaped by a persistent quasi-stationary Rossby way pattern that gave rise to alternating warm and cool regions. This was likely anchored by the persistent warmth in the North Pacific and cool blob in the North Atlantic, and contributed to June’s record breaking heatwave in Western Europe.
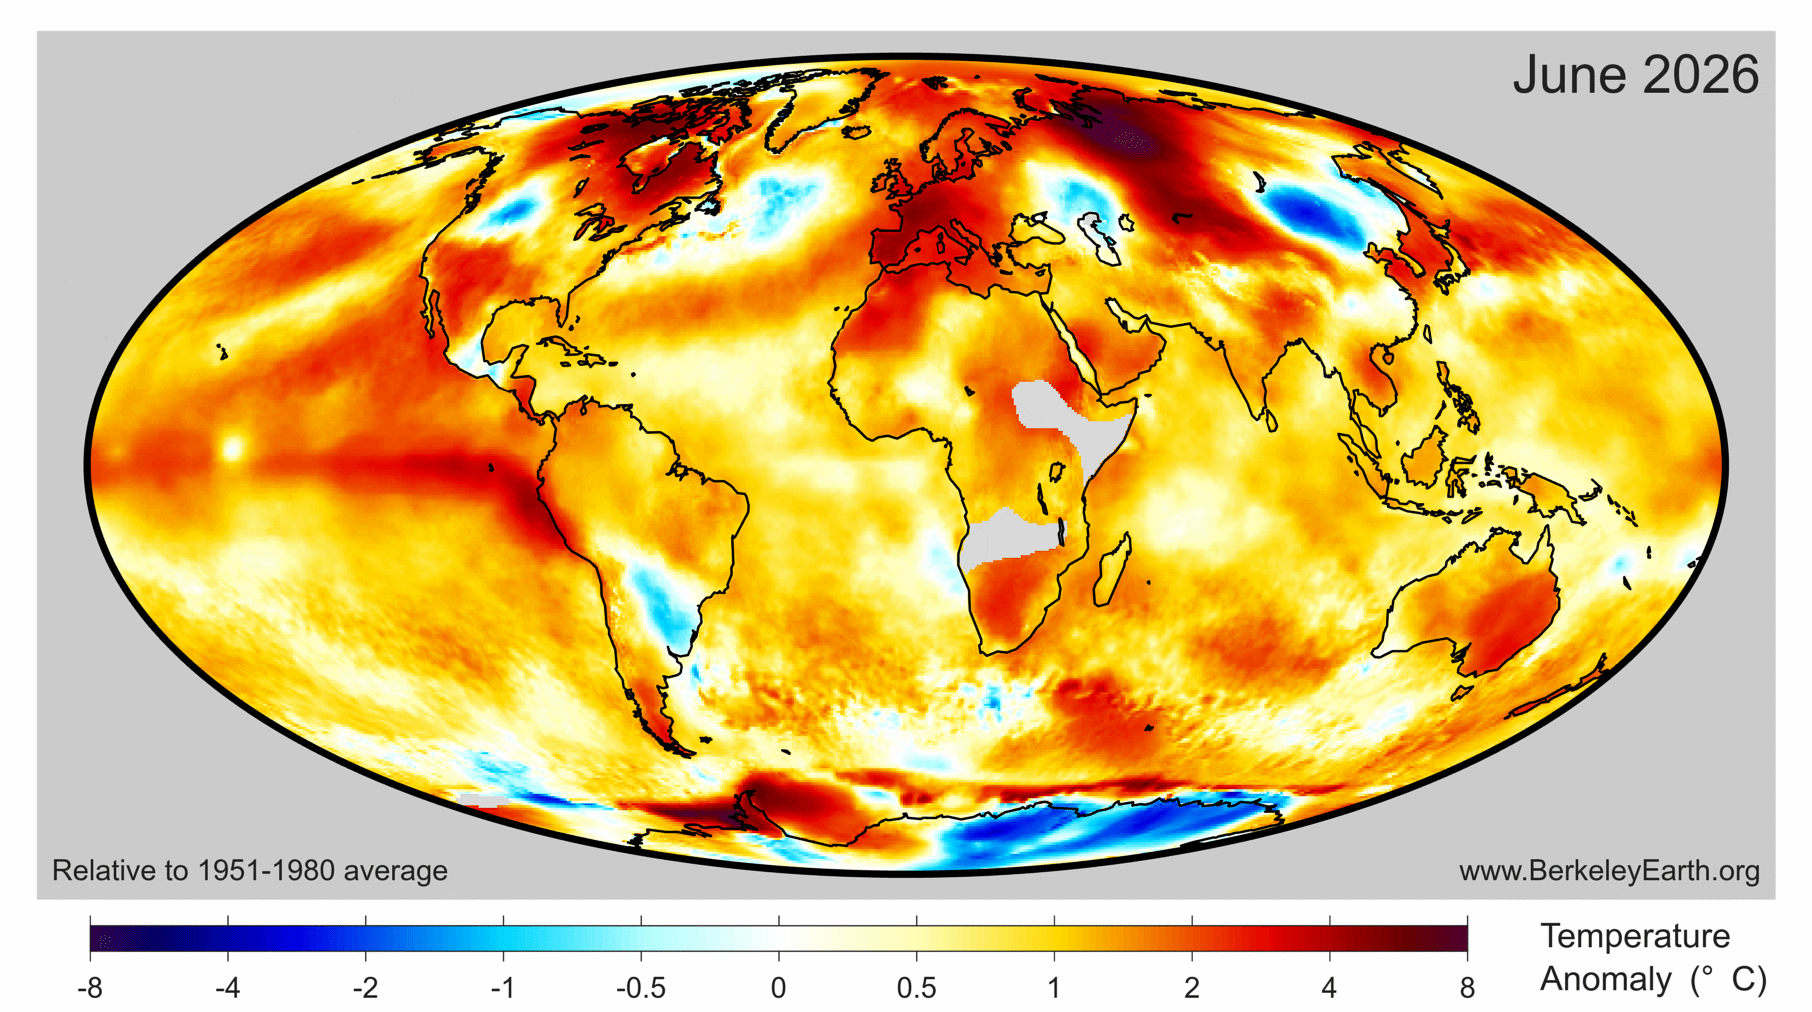
Roughly 5.0% of Earth’s surface experienced its locally warmest June on record (about 4.6% of land and 5.3% of ocean surfaces). In addition, 0.01% of Earth’s surface experienced its locally coldest June on record.
Record warmth was concentrated across the central and eastern tropical Pacific, Western Europe, parts of western Russia, southern Africa, Southeast Asia and Indonesia, and parts of the Southern Ocean.
In Berkeley Earth’s estimation, at least 24 countries set national-average monthly records for June: Belgium, Bhutan, Brunei, Cambodia, Canada, Colombia, Costa Rica, Ecuador, France, Ghana, Honduras, Indonesia, Ivory Coast, Luxembourg, Malawi, the Netherlands, New Zealand, Nicaragua, Panama, Singapore, South Africa, Togo, Tanzania, and Zambia. Both Europe and North America also set continental-average June records. Some of these, like North America, are notably for setting an area-averaged June record despite having relatively few local month records, indicative of warmth that is broad rather than locally extreme.
We also wish the call particular attention to June’s national average record for Canada. Despite having a cooler patch in the Southwest, widespread warmth in northern Canada would have had a drying effect on Canada’s boreal forests, and likely contributed to the development of widespread wildfires in July.
Over land regions, June 2026 was nominally the 2nd warmest June since 1850, with a terrestrial average of 1.90 ± 0.15 °C (3.42 ± 0.27 °F) above the 1850–1900 average. This is, however, still well below the all-time record set in June 2023. Land temperatures ticked up modestly from May and April, but remain below the long-term trend line.

Average ocean temperatures in June 2026 were 1.17 ± 0.09 °C (2.11 ± 0.16 °F) above the 1850–1900 average — the warmest June ever recorded for ocean surfaces. Ocean averages have been climbing steadily since late 2025 alongside the developing El Niño in the equatorial Pacific, and are expected to continue building as the event strengthens toward its anticipated peak later in the year.

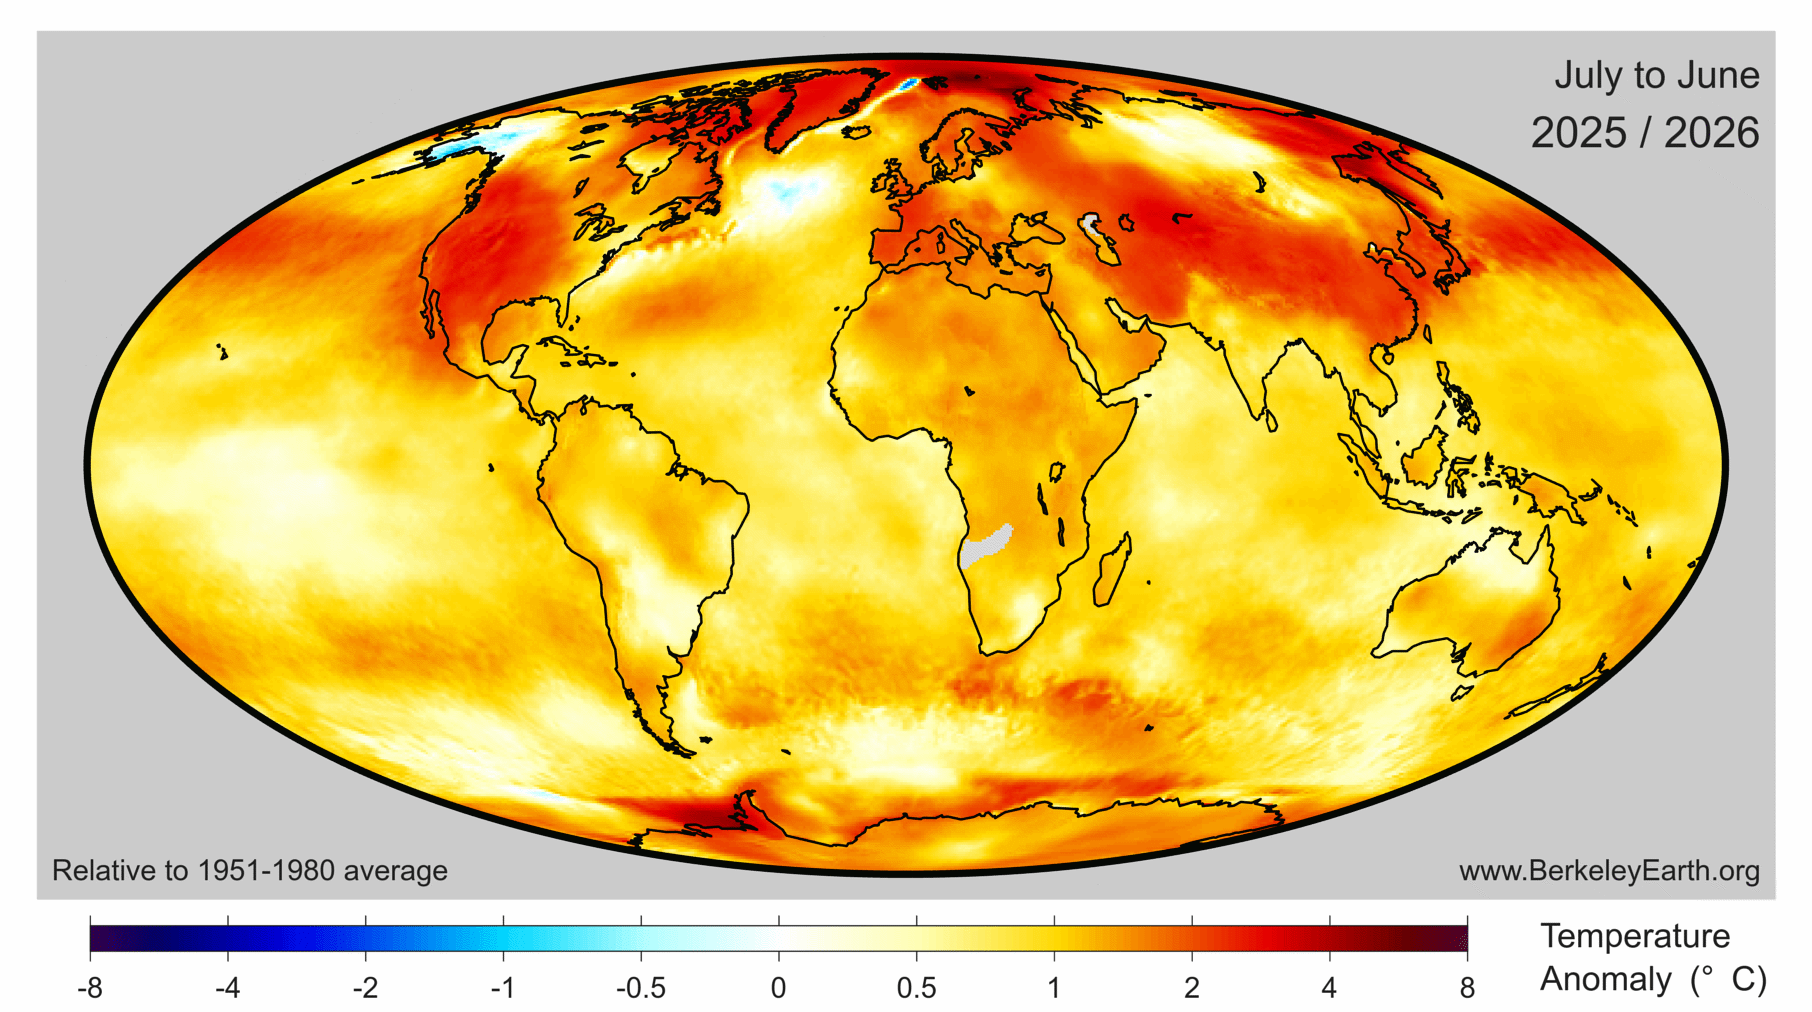
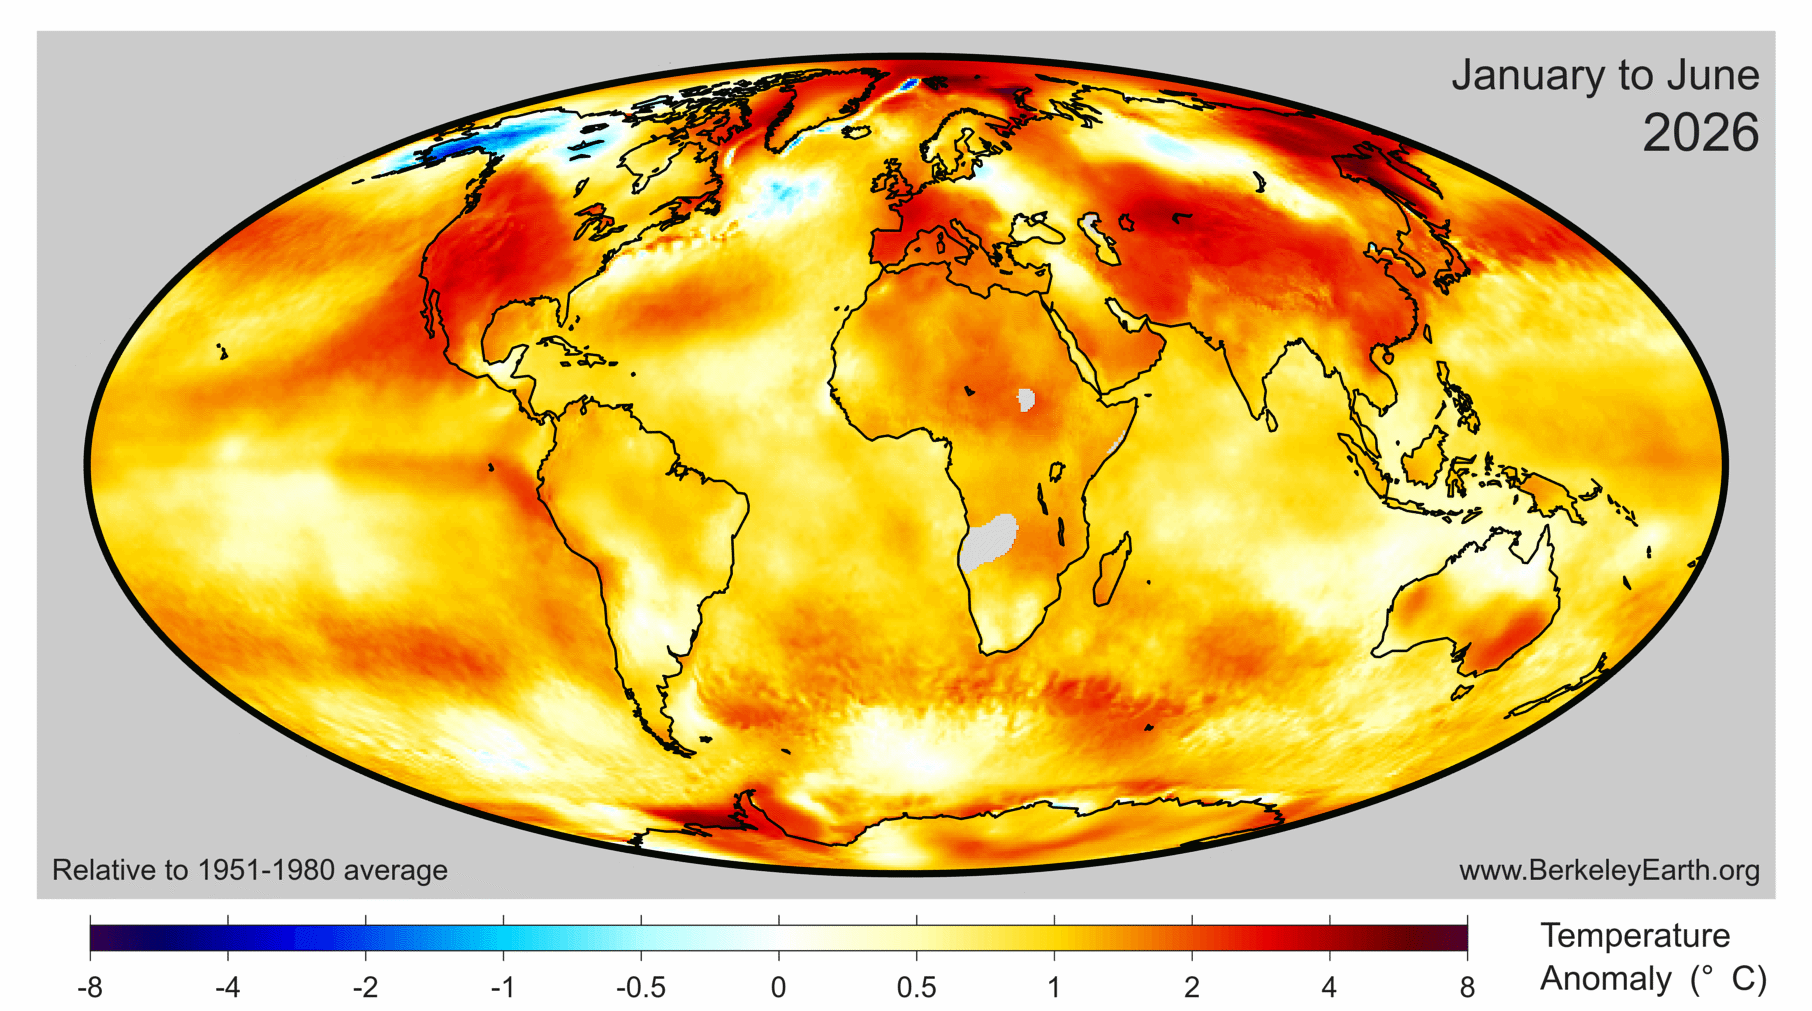
Over the most recent 12 months (July 2025 to June 2026), the global average was 1.45 ± 0.07 °C (2.62 ± 0.13 °F) above the 1850–1900 average, making it the 3rd warmest such 12-month period on record. The 12-month anomaly map continues to show the strongest warmth across the Arctic and the northern high latitudes of Canada, Russia, and Siberia, with no regions of significant relative cooling.
For the first half of 2026 (January–June), the global average was 1.47 ± 0.08 °C (2.64 ± 0.15 °F) above the 1850–1900 average, making it nominally the 3rd warmest such period on record. Land areas averaged 1.96 ± 0.15 °C and ocean surfaces 1.12 ± 0.06 °C above pre-industrial levels over the period, with the land and oceans ranking 5th and 2nd warmest on record respectively for the first half of any year.
June Heatwave in Europe
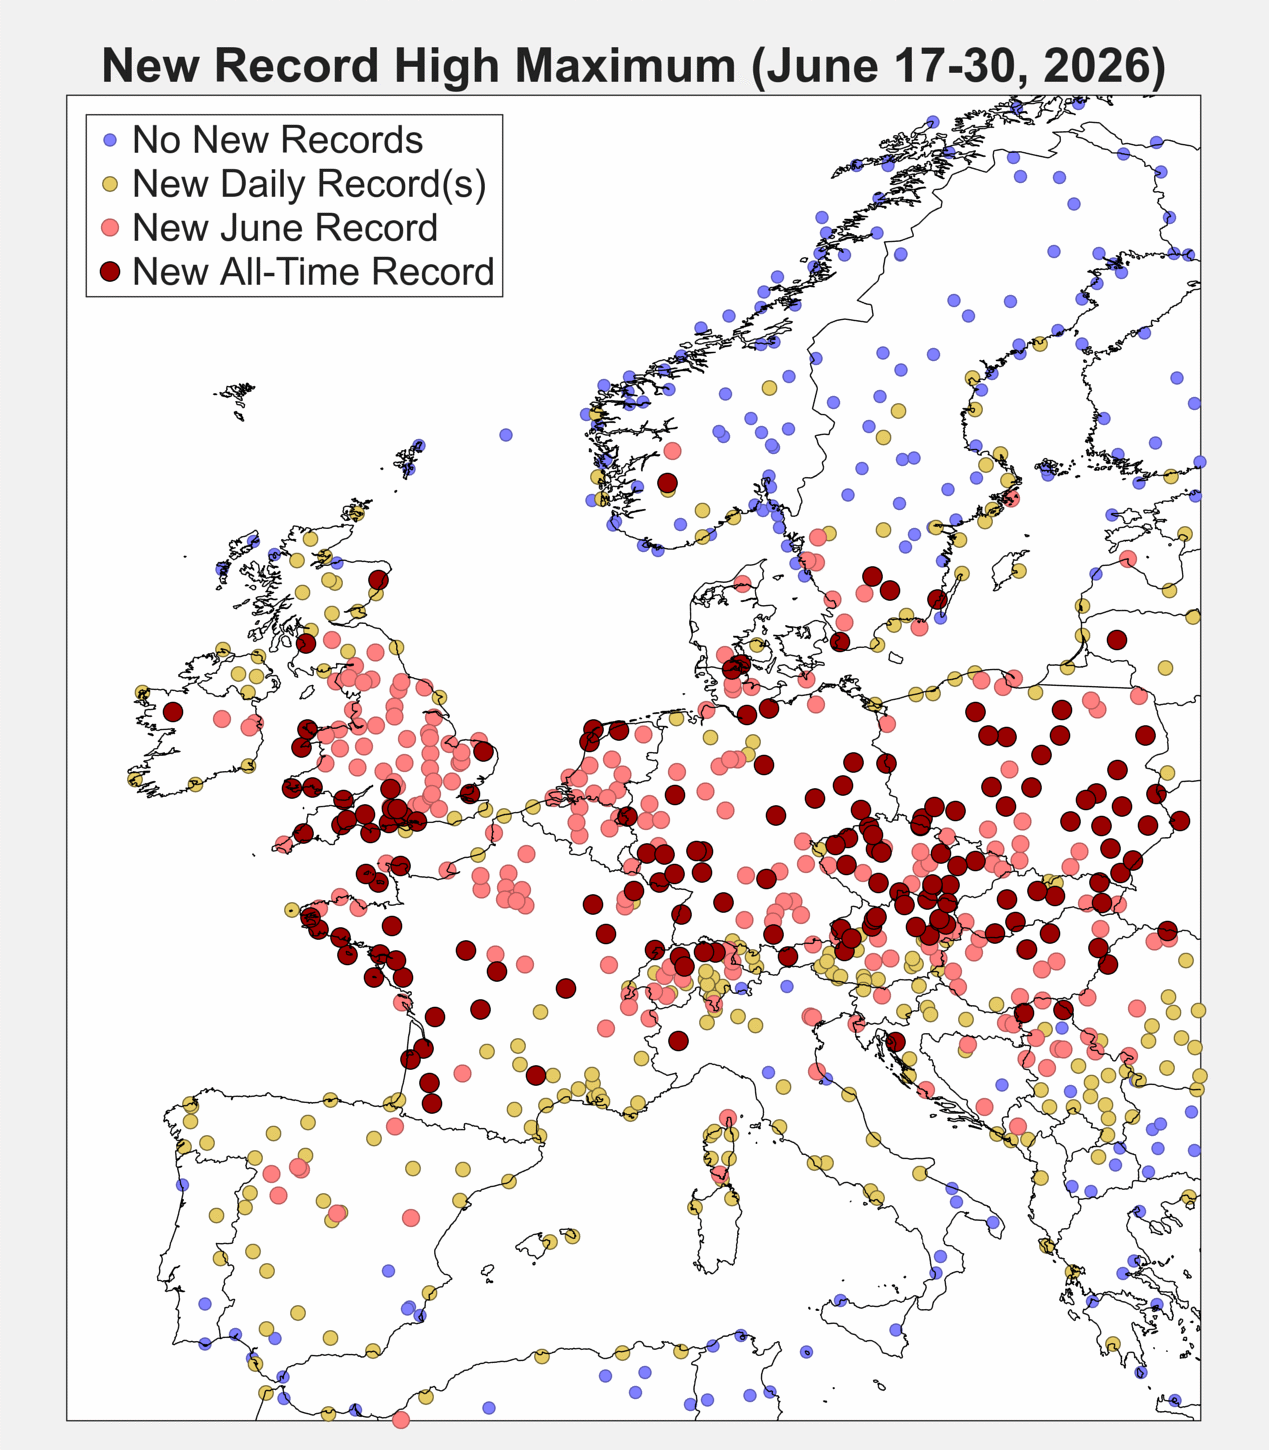
At the end of June, a persistent heatwave led to new widespread record highs for both daily maximum and minimum temperature. For many weather stations in central Europe, the new records not only broke June records but also all-time records.
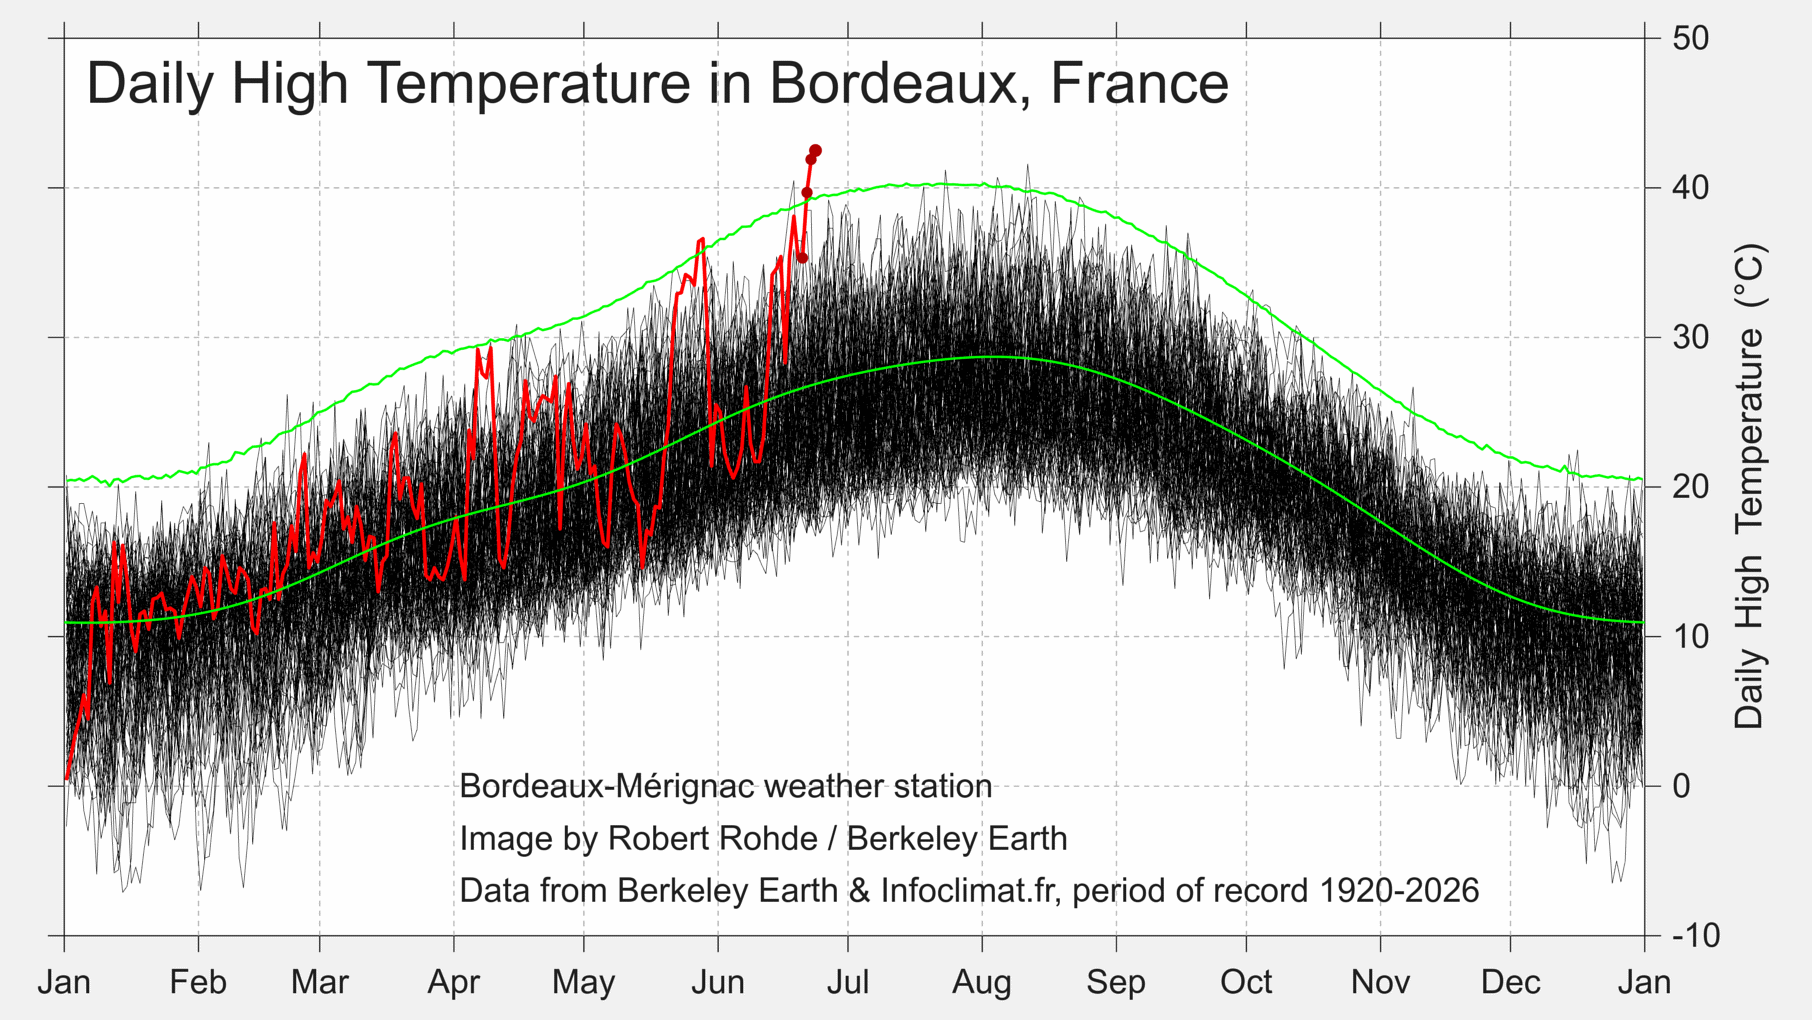
For example, in Bordeaux, France, near the early epicenter of the heatwave, the heatwave provided the hottest day in more than 100 years of measurments.
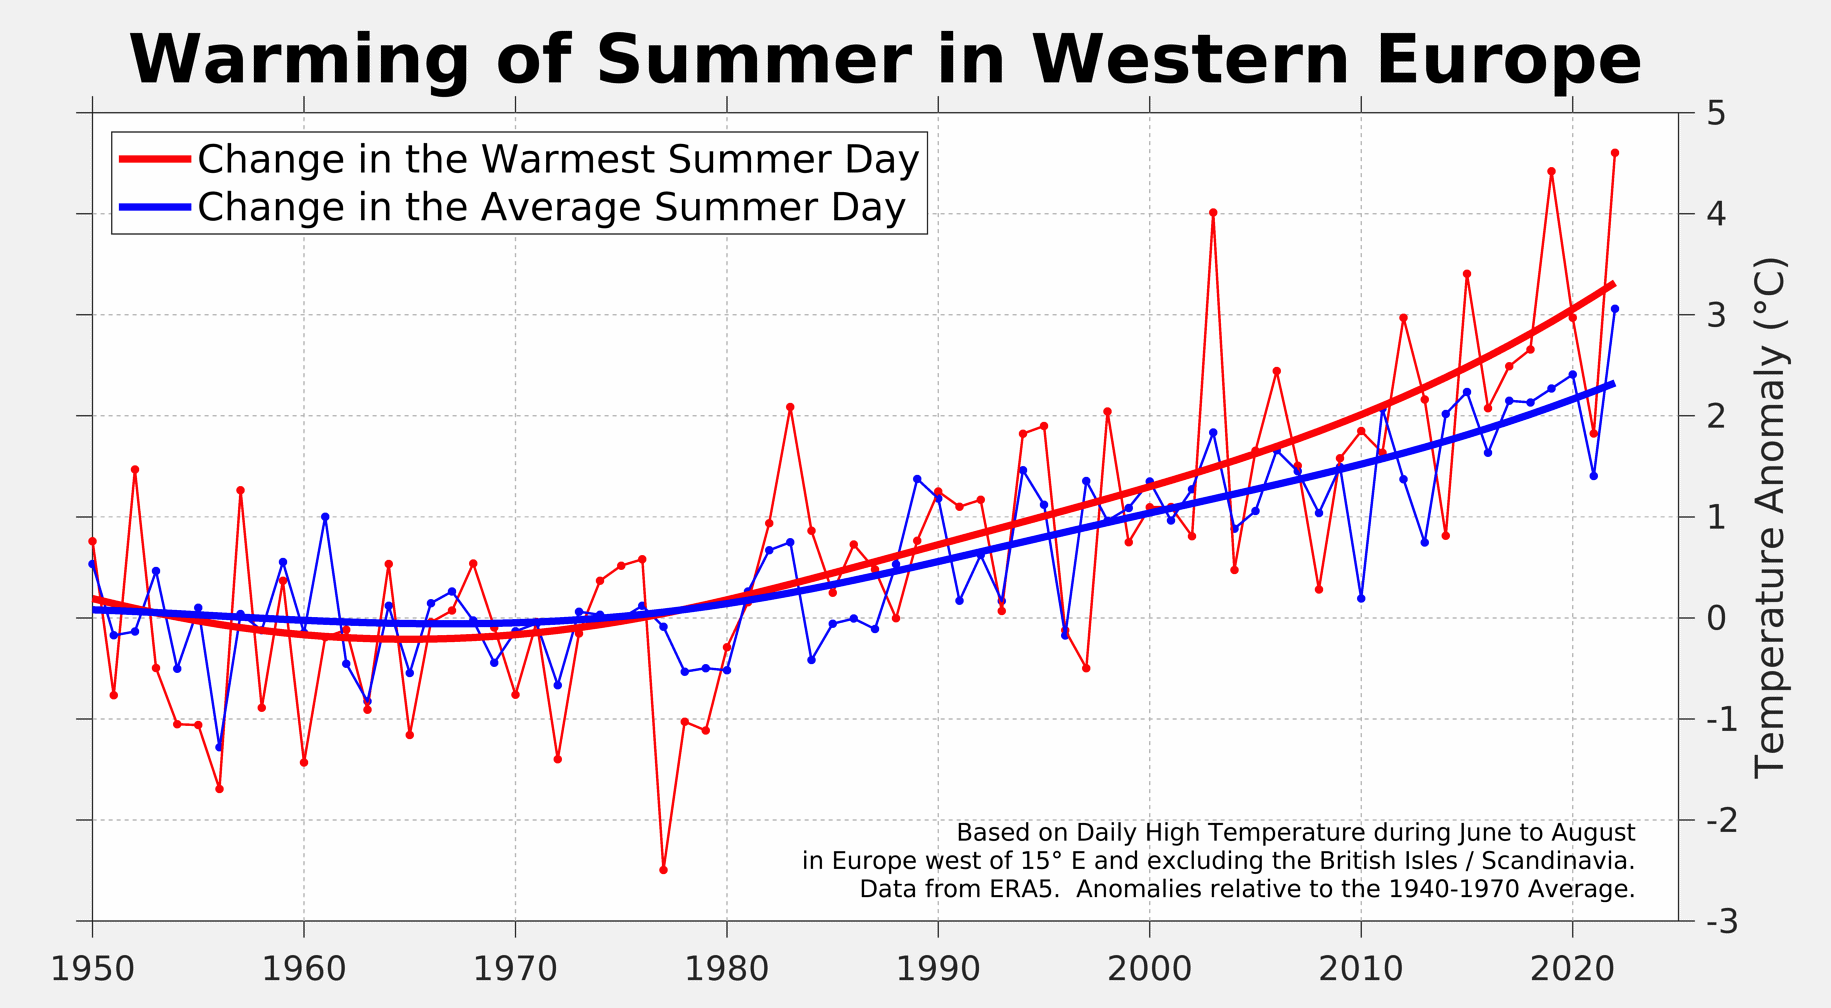
In the context of global warming, Europe is the fastest warming continent, with summer mean temperatures having increased 2.3 °C (4.1 °F) over the last 50 years. However, the temperature of the warmest summer day in Europe has increased even more at 3.2 °C (5.8 °F).
This amplification of the extremes has been previously observed across Europe and is believed to be a result of changing atmosphere dynamics. This is uncommon behavior. For most of the world, the extremes are growing at a pace that is similar to the local mean rate of warming.
In Central and Northern Europe, air conditioning remains uncommon. For example, only ~27% of French households have air conditioning at home. This reflects historical patterns in Europe, such that temperatures were more mild and air conditioning was often seen as unnecessary. Unfortunately, with little artificial cooling, recent temperature increases have left many of these countries vulnerable to the life-threatening effects of extreme heatwaves. French authorities estimate that 5,700 people died as a result of the June heatwave, with most victims being elderly individuals who died at home.
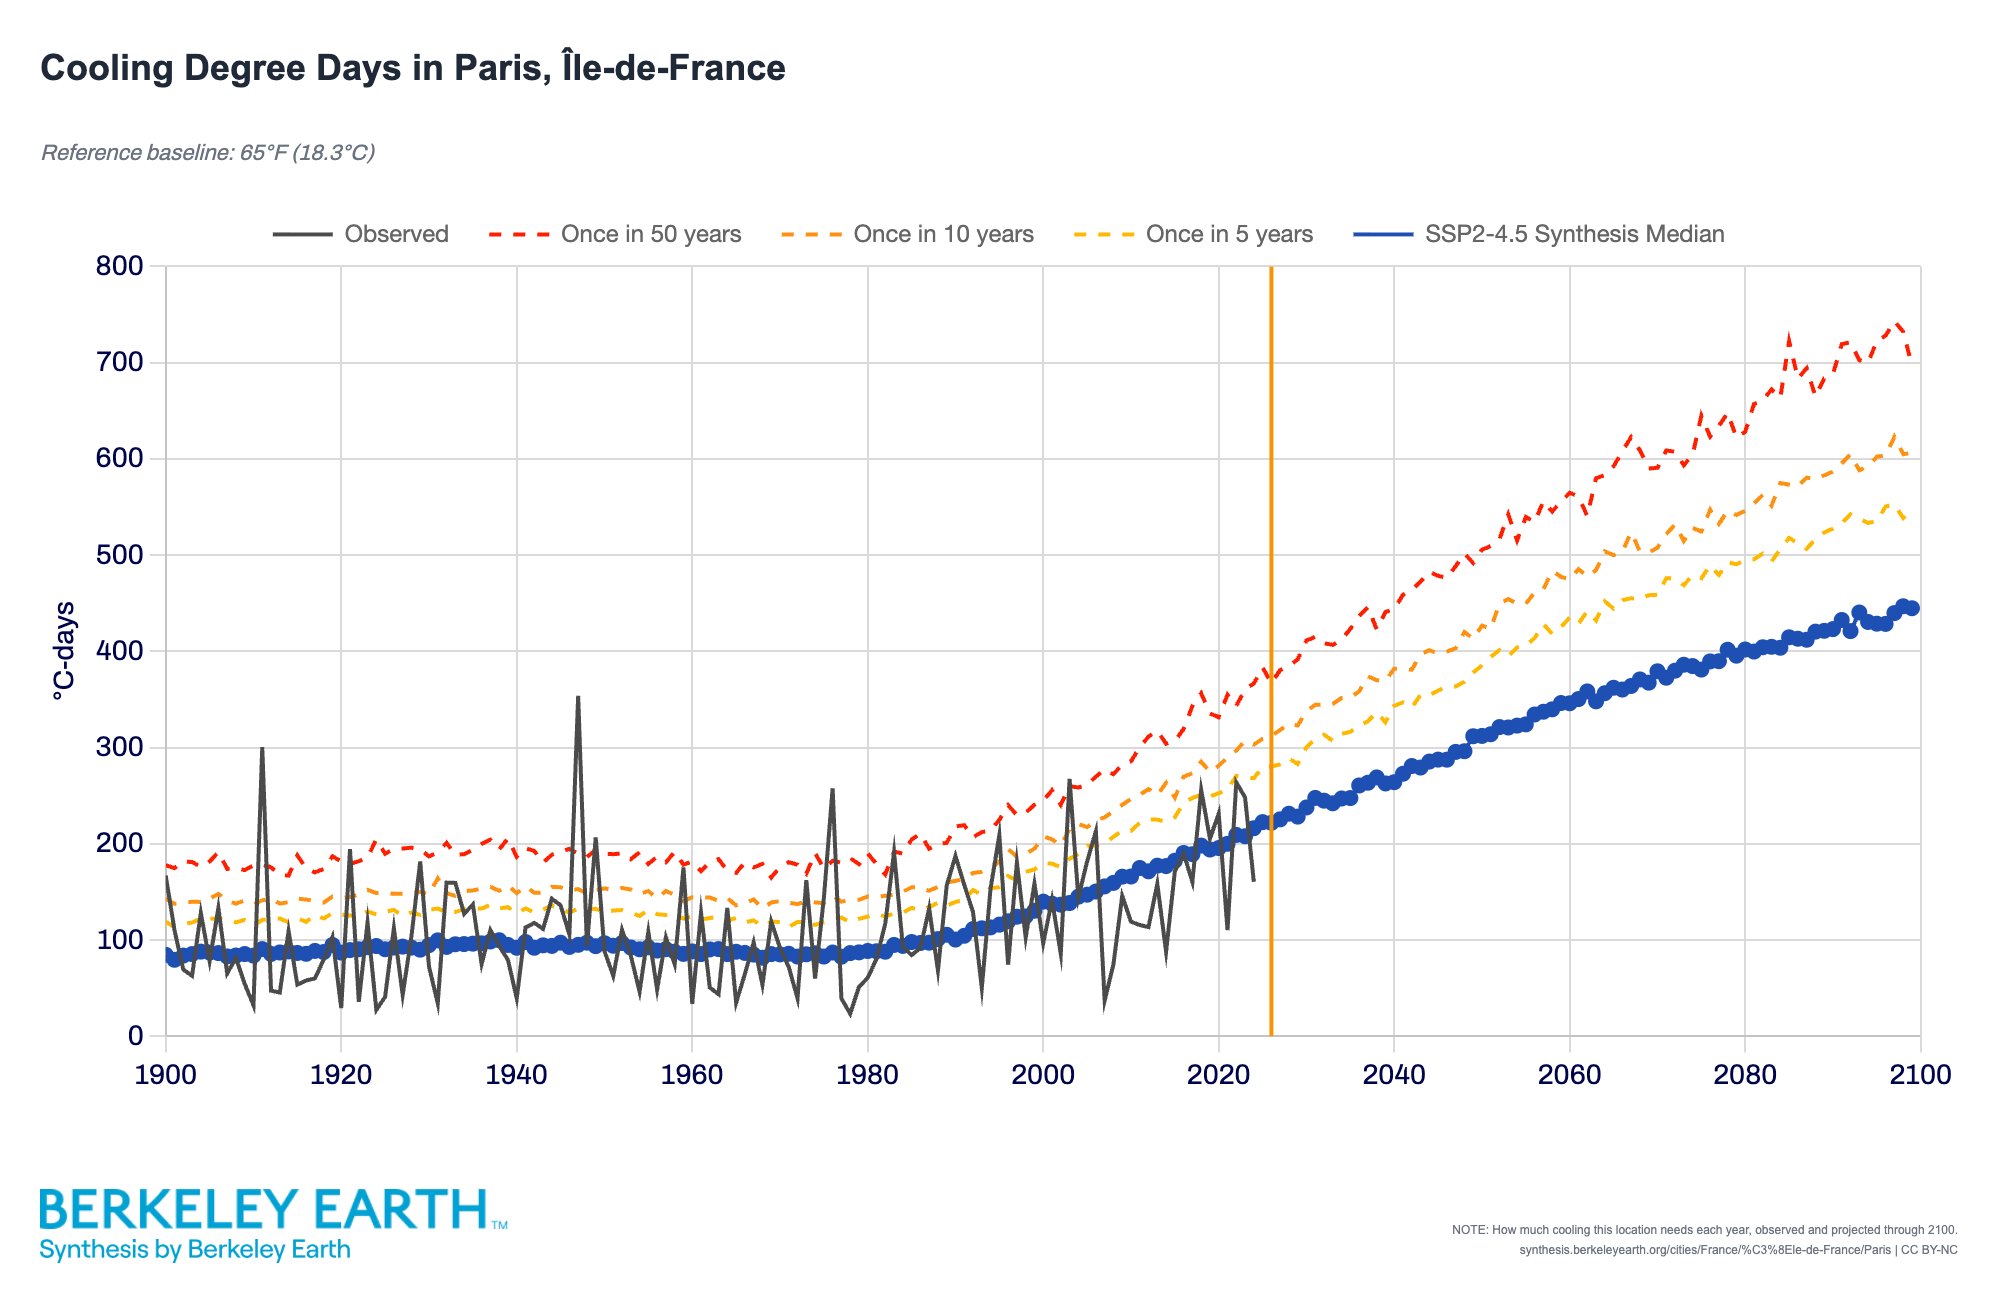
As part of our new Synthesis Platform, we have examined the historical and future demand for artificial cooling in Paris. Cooling Degree Days, a measure of expected cooling demand has doubled in Paris over the last 40 years and is expected to double again this century due to further global warming under emissions scenarios that simulate current government policies.
ENSO Conditions
After a weak La Niña that persisted into the start of 2026, the equatorial Pacific reversed course sharply in the spring, and El Niño has since strengthened at a remarkable pace. NOAA’s Climate Prediction Center officially declared the start on El Niño in June, but it has progressed rapidly since then.
As of this report, which looks back at June averages, the Central Pacific warmth was moderate in an absolute sense or weak when adjusted to account for overall oceanic warming. However, we note that as of the issue data of this report in mid-July, rhe Central Pacific has already reached strong to very strong levels of warmth.
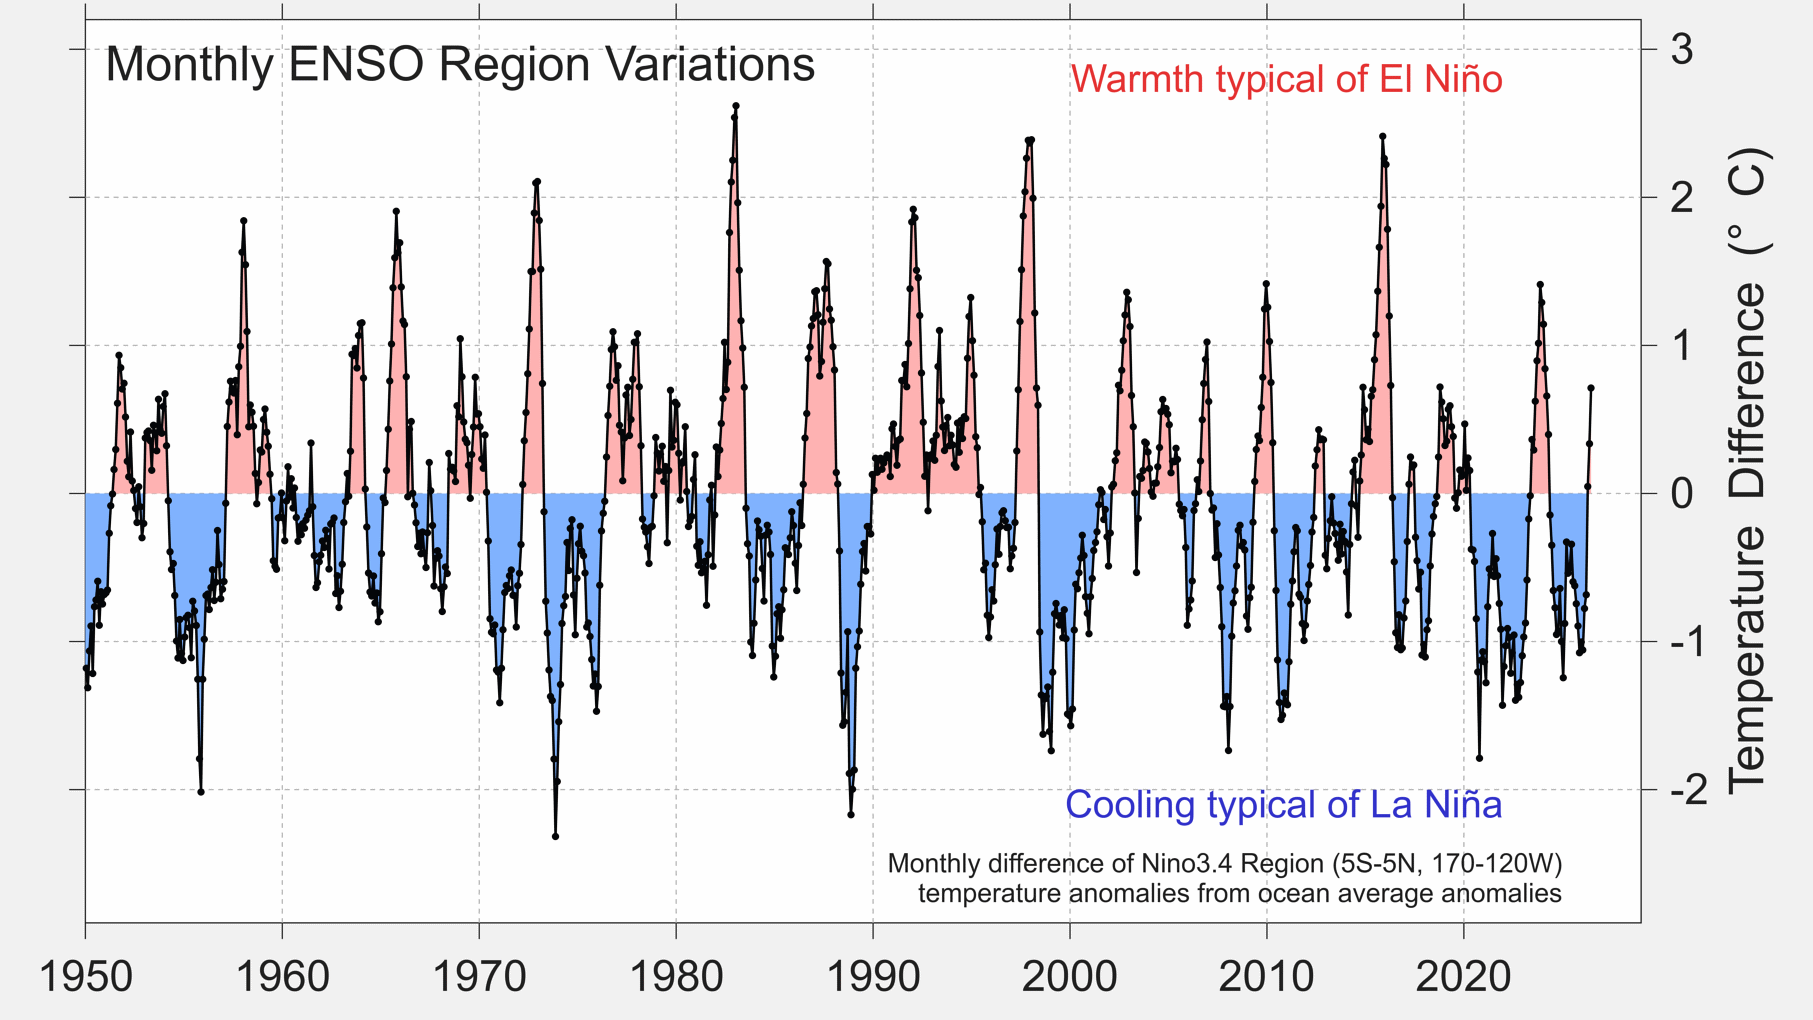
Daily satellite-based measurements of the Central Pacific, shown below, show that this El Niño has been running record warm for this part of the year (unadjusted for the overall ocean warming) and has already crossed the 2.0 °C threshold that classically denotes a very strong or “super” event. Adjusted for the recent ocean warming, the progression of the current El Niño is still near the top of the historical range, but would be more similar to other recent super El Niño events.

What is most striking is how strong this event is forecast to become. Across the major dynamical forecast systems, the multi-model median now points to a peak Niño 3.4 anomaly near +3.6 °C — roughly 0.8 °C above the previous record of about +2.75 °C set in 2015–16. Some 91% of the roughly 667 ensemble members across 14 models exceed the 2015–16 record.
Even using the rONI index, which adjusts for background oceanic warming by removing the average warmth in the tropics, the median forecast peak of +3.1 °C would be record high with 11 of 14 models indicating a record-strength event, giving about a 77% probability of a new record. For context, the gap between the strongest and the fifth-strongest El Niño of the past 150 years is only about 0.5 °C, so a forecast this far above the prior record is genuinely unprecedented. The event is expected to peak between October and January, most likely around November or December.

If the current El Niño event evolves as forecast, it would be expected to raise global mean temperatures late in 2026 and, even more so, into 2027, since the global-average response typically lags the peak in the central Pacific by several months. As always, considerable uncertainty remains — the spread among models is very wide — but one should be prepared for the possibility of an El Niño stronger than any previously observed. For more information, see NOAA’s Climate Prediction Center report and our discussion at The Climate Brink.
2026 Outlook
With the first half of 2026 complete, the outlook for the annual average is roughly at the same place it was at the start of the year, with a 12% chance of record warmth. However, this is meaningfully higher than in May, when the chance was placed at only 2.5%. Current year-to-date temperatures rank as 3rd warmest across similar January-July periods and would be only 4th warmest if compared to past annual averages.
It is possible that an extreme El Niño event, as forecast, could overcome this initial deficit and raise the annual average to a new record high, but the forecast system is currently skeptical that the developing El Niño will raise global averages fast enough to reach a record this year. It considers it likely (67% chance) that the 2026 ends as the 2nd warmest year.
We wish to note though that our forecast system appears to be more skeptical of a record-breaking El Niño than the current multi-model El Niño ensembles would suggest. Because our system is calibrated against historical behavior, it may be underrating the possibility of El Niño event that could be significantly stronger than any previous event. Other approaches that incorporate a record strong El Niño suggest that 2026 has perhaps a 25% chance of reaching record warmth.
We currently estimate about a 72% chance that the 2026 annual average will exceed 1.5 °C (2.7 °F) above the 1850–1900 average, with a likely annual range of roughly 1.45–1.59 °C. Because the global-average impact of El Niño lags its peak in the Pacific, much of this event’s warming influence is expected to carry into 2027, which — following a strong El Niño — would be a strong candidate for a new annual record.
| Estimated probability of 2026 annual final ranking | Likelihood |
|---|---|
| Warmest year on record (1st) | ~12% |
| 2nd warmest | ~67% |
| 3rd warmest | ~14% |
| 4th warmest | ~8% |
| 5th warmest or lower | <1% |