
A record-setting European heatwave, wildfires across Canada and France, and a strong El Niño taking shape in the Pacific.
This summer has produced a run of extreme, headline-making weather: the warmest June ever measured for the world’s oceans, a lethal heatwave across France, wildfires across Canada and Europe, and the early arrival of a powerful El Niño taking shape in the Southern Pacific Ocean.
Below, we place the summer’s extremes in context — bringing in Berkeley Earth’s analysis and resources, along with recent media coverage, to help make sense of what this season is telling us.
Second-warmest June on record
With a new monthly record in the oceans

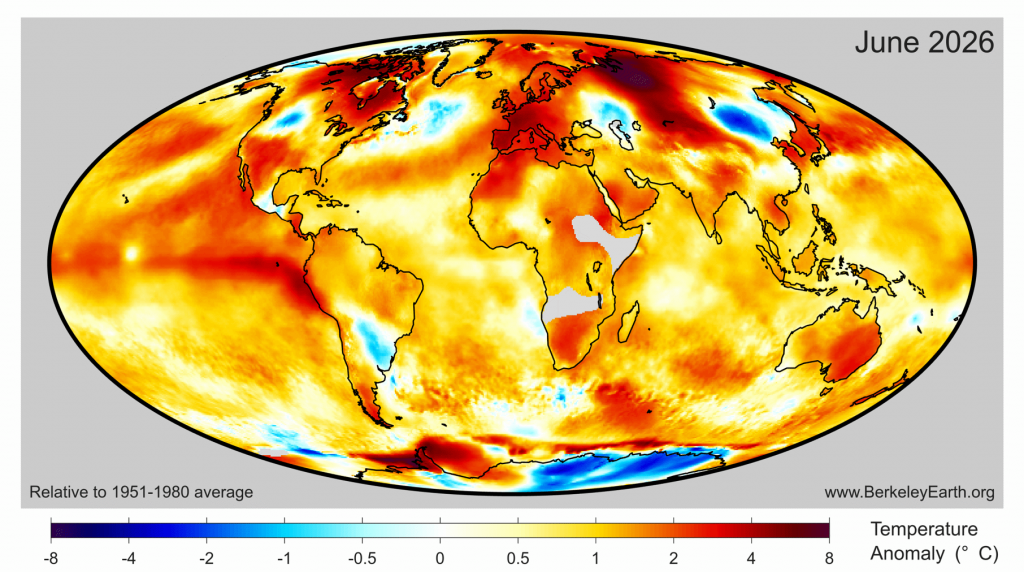
Globally, the June 2026 average came in at 1.49 °C above the pre-industrial baseline, the second-warmest June in the Berkeley Earth record, second only to June 2024. The oceans went further: June was the warmest ever measured for the world’s oceans, at 1.17 °C above baseline.
Behind the global average print were significant local extremes, including a record-setting heatwave in France and the EU, which is discussed in more detail below. About 5 percent of the planet’s surface had its warmest June on record, and at least 24 countries set national June records.
With the first half of 2026 complete, the outlook for the annual average is roughly at the same place it was at the start of the year, with a 12 percent chance of record warmth, and a 67 percent chance of finishing as the second-warmest on record. Uncertainty still remains around the timing and magnitude of the strong El Niño currently forming in the Pacific, which could ultimately impact the 2026 outcome. Additional updates on the developing El Niño are discussed extensively below.

Read the full June temperature update →
A record heatwave in Western Europe
From 21 to 26 June, a severe heatwave settled over France and its neighbours, breaking monthly and all-time station records. Bordeaux recorded its hottest day in more than a century of measurement. Hundreds of stations passed 40 °C, and many topped 44 °C.
Northern mid-latitude weather in June was shaped by a persistent, quasi-stationary Rossby wave, a large standing wave in the atmosphere that set up alternating warm and cool regions and parked a heat dome over Western Europe. The same class of blocking pattern drove the record March heat across the western United States earlier this year.
In Bordeaux, June maximum temperatures have risen by nearly 6 °C over the past 50 years. Across Western Europe, the warmest summer days have warmed by about 3.2 °C in the same period — faster than summer averages have risen. Europe is the fastest-warming continent, and a heatwave of this intensity would have been essentially impossible without that added heat.

Special report: the March 2026 Western U.S. heatwave →
The defining infrastructure story of the coming decades
The heatwave in Europe pulled focus on infrastructure resilience, highlighting what is likely to be the defining infrastructure story of the coming decades in the EU and beyond. Only about 25 percent of French homes have air conditioning, one of the lowest rates in the developed world. Santé publique France reported 5,784 excess all-cause deaths during this period, the highest excess all-cause mortality during a heatwave since 2003.
Berkeley Earth’s Synthesis platform provides projections for cooling degree days, a measure of the difference between outdoor temperatures and a set indoor standard, commonly used to estimate the demand for artificial indoor cooling. In Paris, cooling demand has already doubled over the last 40 years. Under a current-policy scenario (SSP2‑4.5), it is projected to roughly double again before the end of the century.

Zoom out, and cooling becomes one of the largest and least-discussed demands on the future grid. In a case study with C40 Cities, city-level data from Synthesis was used to project future energy demand from increased cooling needs across the C40 network of major cities. By 2050, combined cooling electricity demand could reach roughly 350 terawatt-hours a year, on the order of one to two times the annual electricity demand of all U.S. data centers. For all the attention data centres are currently receiving in the US, cooling is the demand curve few are planning for.
Read the Berkeley Earth and C40 cooling case study →
A record fire season, carried south
Canada is in the midst of a severe wildfire season, and the smoke has again drifted across large parts of the Central and Eastern United States, pushing air quality into unhealthy ranges. Berkeley Earth’s Robert Rohde spoke with the New York Times about the smoke and its health effects earlier this month.
While warming does not start fires, higher temperatures and precipitation changes raise the odds of a severe event once a fire is sparked. Temperatures during Canada’s fire season have risen a little more than 2 °C over the past 50 years, and hotter, drier conditions make the fires that do occur far more severe. It is not a coincidence that 2023, the warmest summer in Canada’s modern history, also set the record for the largest area burned in a single year. Nine of the ten worst seasons on record paired above-average heat with below-average rainfall. With roughly 80 percent of Canada’s forests unlogged and unmanaged, that rise is driven mostly by a warming climate rather than by land use.

Robert Rohde in the New York Times →
Beneath the averages, a record El Niño is forming
The most consequential development this summer is what’s happening in the equatorial Pacific, where a strong El Niño has arrived early and is running hotter than any on record for this point in the year.
Hotter than any on record, this early
Central Pacific temperatures, measured by the Niño 3.4 index, have already reached about +2.1 °C, crossing the “super” El Niño threshold months ahead of schedule. At this date, the two strongest events of the satellite era — 1997 and 2015 — stood at +1.6 °C and +1.3 °C. No prior year in the 45-year record was this warm this early.

Forecast to be the strongest ever
Every one of the 14 seasonal forecast models now points to a very strong peak. The multi-model median lands near +3.6 °C, roughly 0.8 °C above the 2015–16 record of +2.75 °C. Taken at face value, that is about a 90 percent chance of a record-setting event. Even after adjusting for the general warming of the oceans, 11 of the 14 models still show a record — roughly a 77 percent chance. One caveat worth stating plainly: no event this strong has ever been observed, so the models are forecasting beyond the range where they have been tested.

Most of the warming lands in 2027
Historically, global surface temperatures lag behind the tropical Pacific by about two to five months. With the peak expected around December 2026, most of this event’s warming has not yet translated to land-based warmth, and will not register in the global average until 2027. As of our June 2026 update, Berkeley Earth’s model gives 2026 only a 12 percent chance of finishing with record warmth, with a 72 percent chance that the global average exceeds 1.5 °C. That lag also makes 2027 a strong candidate for a new annual record.

What El Niño usually brings
El Niño redistributes the world’s rainfall. These are tendencies based on past events, not guarantees, and local outcomes depend on local conditions — but past strong events point to a recognisable pattern.
Drier — drought and fire risk
Indonesia and Southeast Asia, eastern Australia, southern Africa, and the northern Amazon, alongside a weaker Indian monsoon.
Wetter — flood risk
Coastal Peru and Ecuador, the Horn of Africa, the southern United States, and southern South America.
A mixed ocean picture
Fewer Atlantic hurricanes, more eastern-Pacific storms, coral bleaching across basins, and disrupted Pacific fisheries.

Lessons from past strong events
Impacts vary by event and region, and the same El Niño can bring hardship in one place and relief in another. Past strong events are illustrative rather than a forecast, but they show the range.
1982–83
Drought and bushfires across eastern Australia, severe flooding along coastal Peru and Ecuador, and the collapse of Peru’s anchovy fishery.
1997–98
Widespread fires and haze across Indonesia, flooding in East Africa and Peru, the first mass global coral bleaching event, and an unusually quiet Atlantic hurricane season.
2015–16
The current record holder: record global heat and worldwide coral bleaching, drought and food stress across southern Africa, alongside welcome drought relief in parts of the US Southwest.
Across events
Strong El Niños have also tended to bring milder, lower-cost winters to much of the northern United States — a reminder that the effects are mixed, not uniform.
Illustrative examples drawn from past events; sources include NASA, NOAA, and Berkeley Earth. Impacts differ by event.
Berkeley Earth will continue tracking the developing El Niño throughout its duration, with updates provided at our monthly press briefings, as well as across reporting and social media channels.
Nature: This El Niño is set to be the largest on record by a ‘mind-blowing margin’ →
WIRED: The 2026 El Niño is set to be the strongest on record →
Now live: Synthesis by Berkeley Earth
From observation to decision
This summer’s extreme events across Europe and North America stretched the capacity of local grids and pushed infrastructure to its limits. Synthesis was designed to make the data needed to plan for future capacity at local scales more accessible, with decision-ready metrics including Cooling Degree Days (CDD), Days > 35 °C, and projected TAVG and TMAX for more than 8,000 locations worldwide. Custom metrics and locations are available upon request.

For more information about the science behind Synthesis, see the Synthesis overview (PDF) →