The following is a summary of global temperature conditions in Berkeley Earth’s analysis of July 2026.
- July 2026 was nominally the 2nd warmest July on record, with a global average of 1.56 ± 0.09 °C (2.80 ± 0.15 °F) above the 1850–1900 average — the first month of 2026 to exceed 1.5 °C — behind only July 2023 and effectively tied with July 2024.
- Land temperatures averaged 2.03 ± 0.20 °C (3.66 ± 0.35 °F) above the 1850–1900 average, nominally the 3rd warmest July for terrestrial regions.
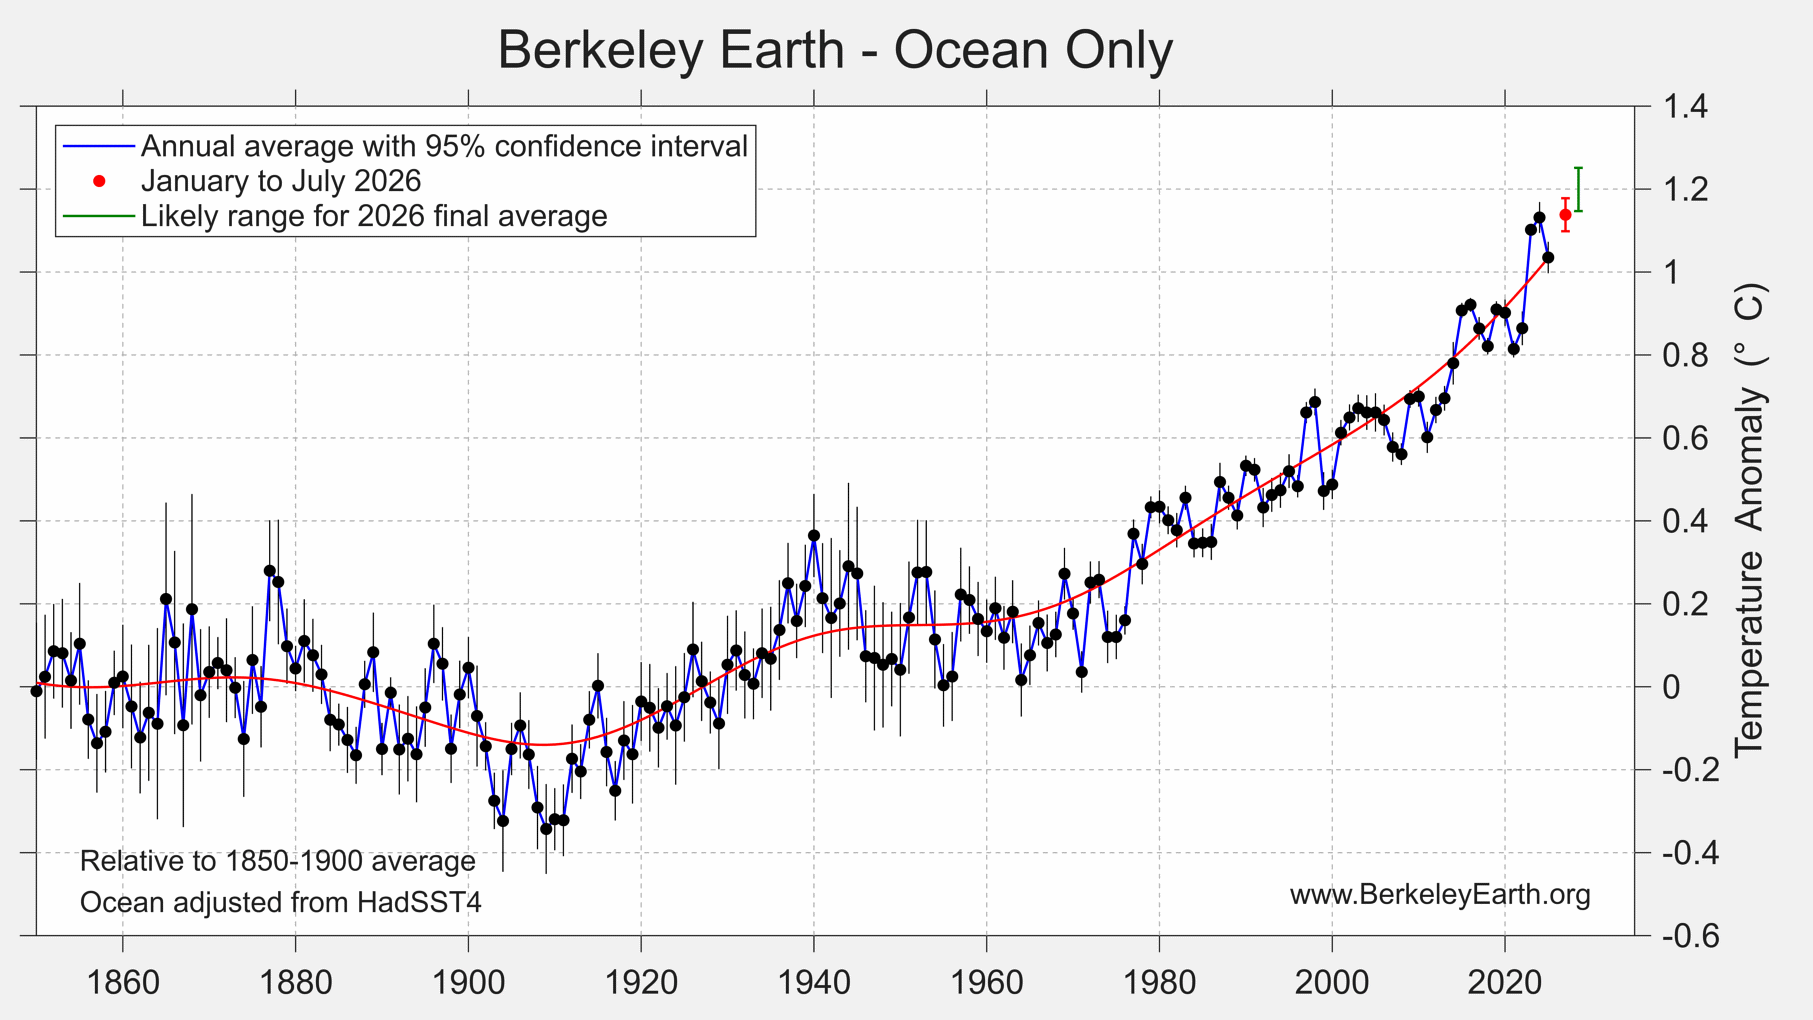
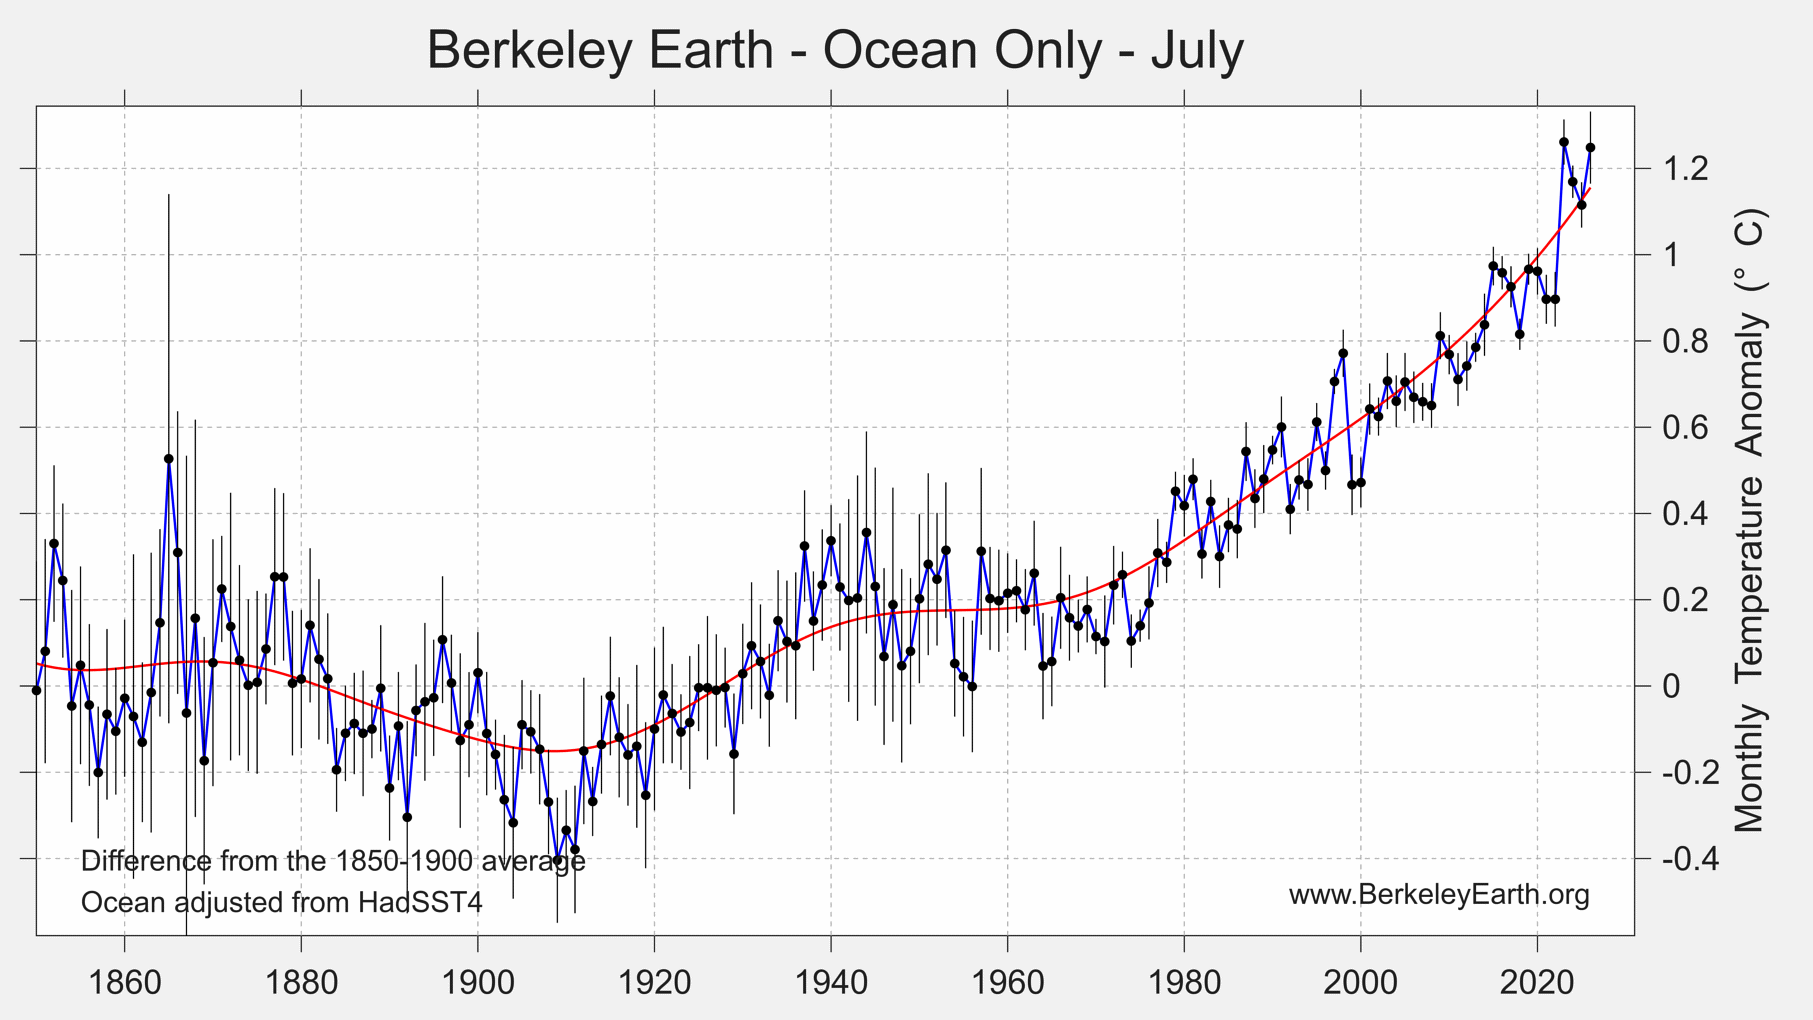
- Ocean temperatures were 1.25 ± 0.09 °C (2.25 ± 0.17 °F) above the 1850–1900 average, nominally the 2nd warmest July on record for ocean surfaces.
- El Niño has continued to strengthen rapidly. The Niño 3.4 index has climbed to about +2.7 °C — the highest value on record for this point in any year — and the latest multi-model forecasts project a peak near +4.0 °C around November 2026, which would make it the strongest El Niño in the observational record.
- Roughly 8.5% of Earth’s surface experienced its warmest July on record (6.0% of land and 9.8% of ocean surfaces).
- Extreme heat and wildfires affected much of the Northern Hemisphere. Western Europe recorded its hottest June–July period on record, with major wildfires across the Mediterranean, while Canada saw extensive wildfire activity.
- The 2026 outlook has shifted decisively: 2026 now has roughly a 69% chance of becoming the warmest year on record, up from 12% a month ago, and a near-certain (~99%) chance of exceeding 1.5 °C.
Global Summary
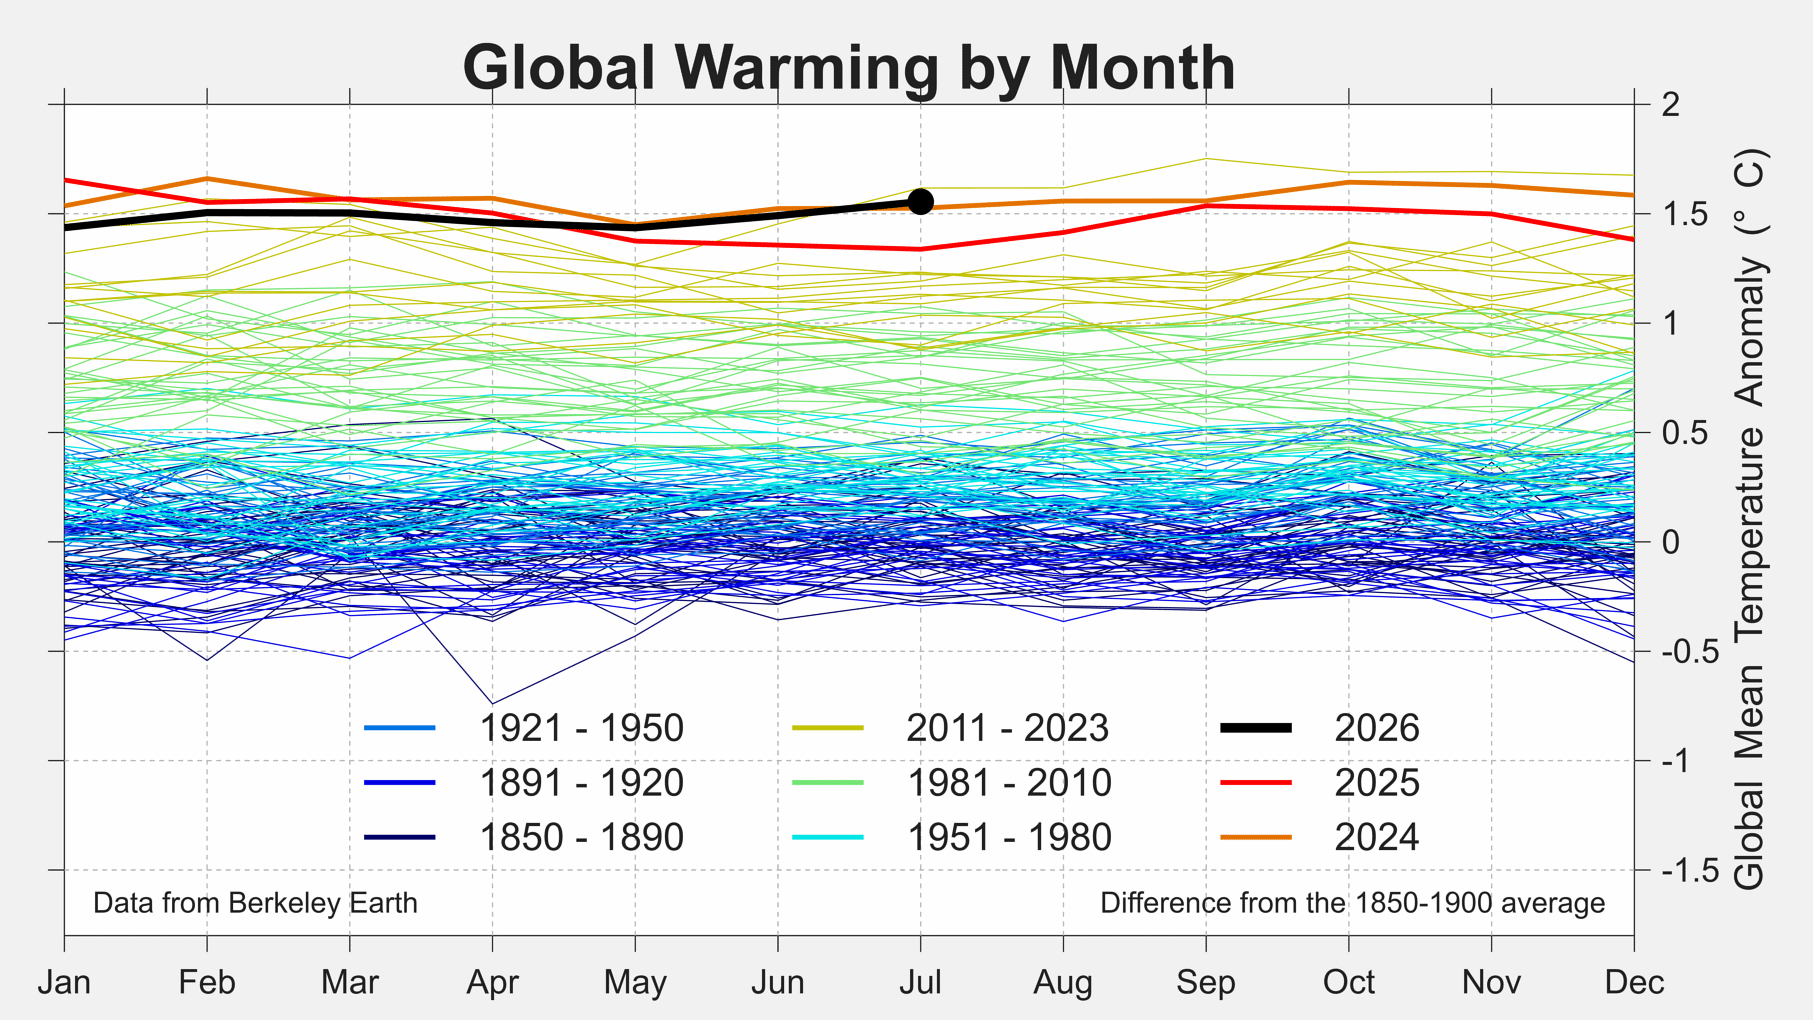
According to Berkeley Earth’s high-resolution temperature dataset, July 2026 was nominally the 2nd warmest July since records began in 1850, with a monthly global average of 1.56 ± 0.09 °C (2.80 ± 0.15 °F) above the 1850–1900 (pre-industrial) average. It ranks behind only July 2023 and is effectively tied with July 2024 given the uncertainties. Notably, July 2026 is the first month of the year to push above the 1.5 °C (2.7 °F) Paris-aligned benchmark, reflecting the growing influence of the strengthening El Niño.
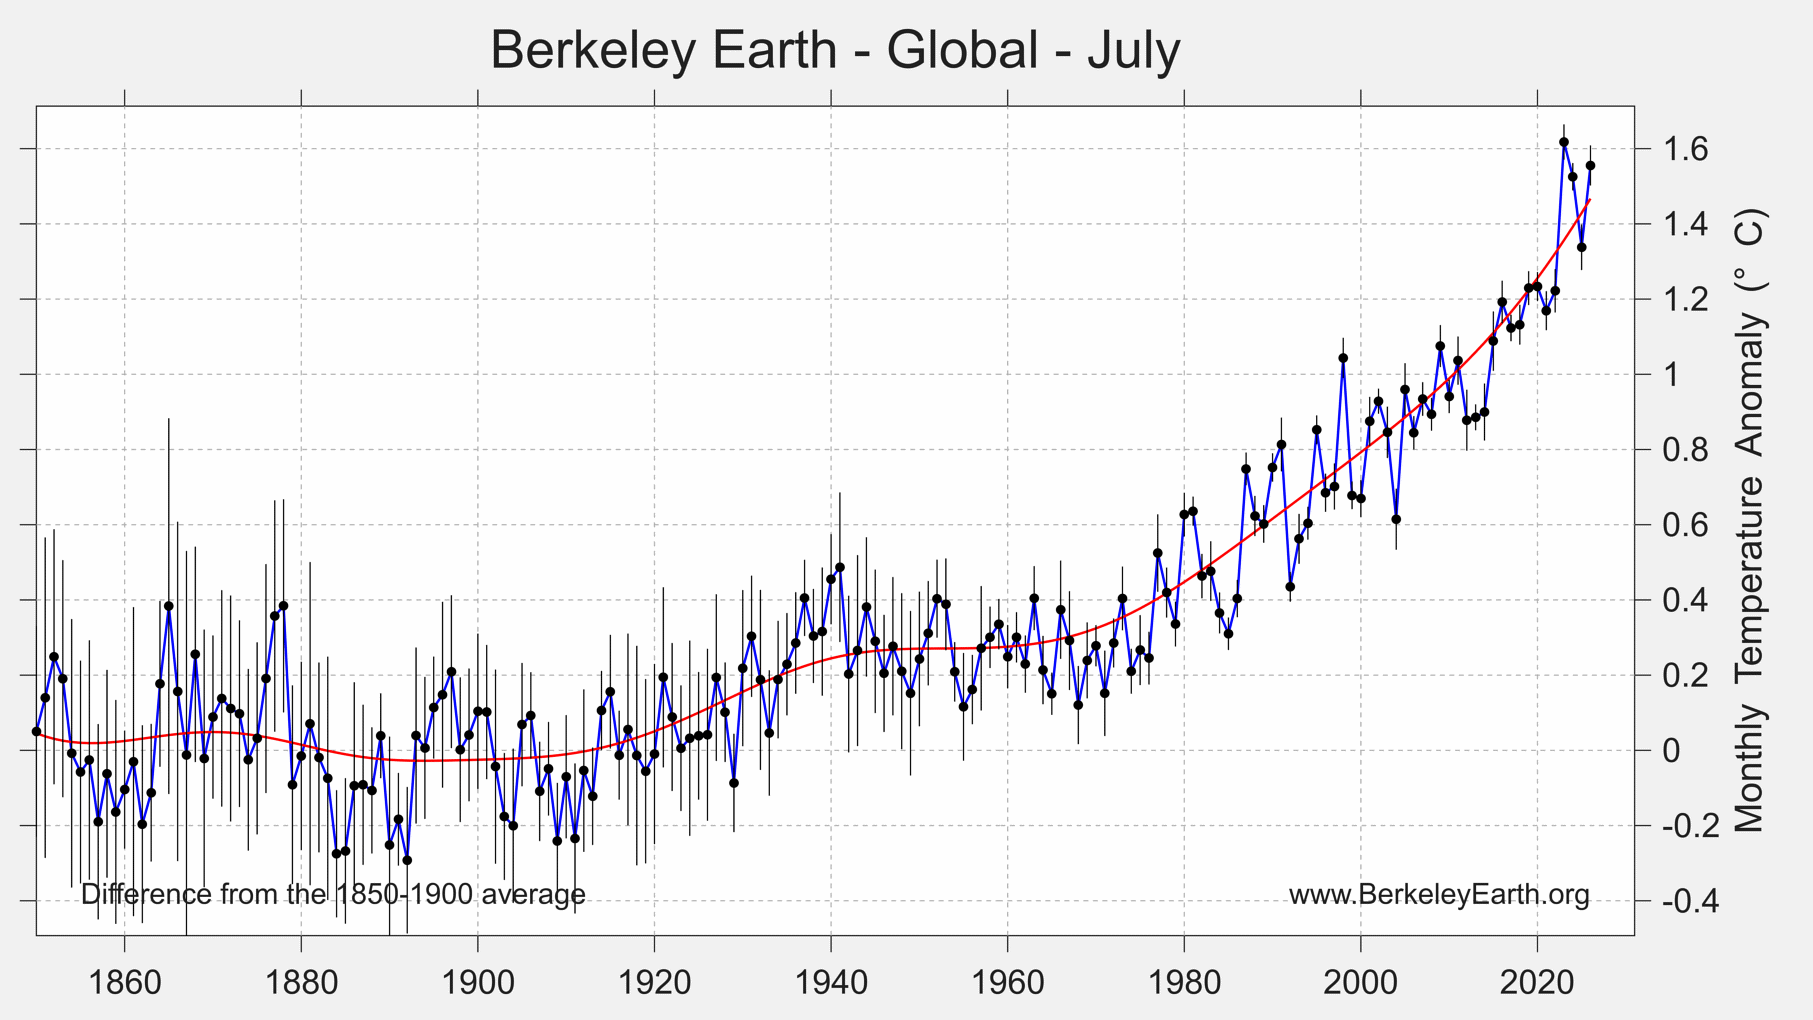
On a month-to-month basis, July 2026 was warmer than June and continued the steady climb seen through the year. Temperatures have now moved clearly above the long-term trend line and above the 1.5 °C mark, a marked turnaround from the cooler start to 2026, as El Niño’s warming influence increasingly makes itself felt in the global average.

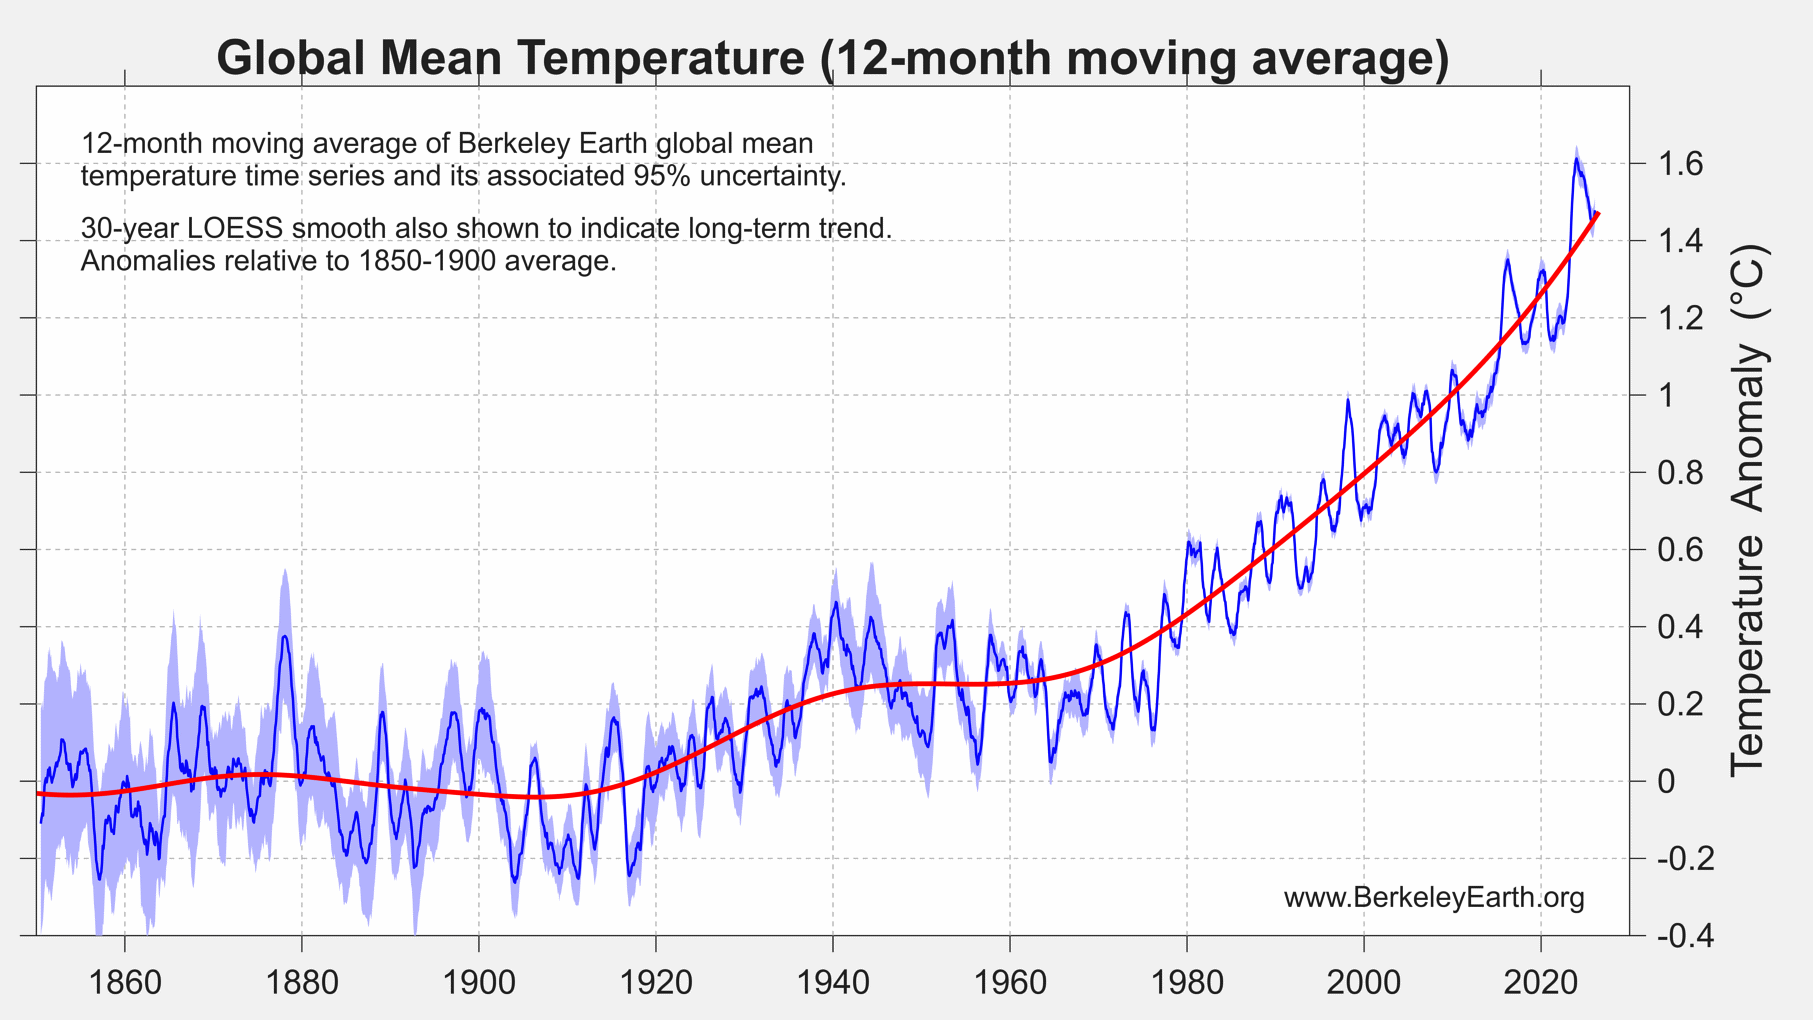
The 12-month moving average is now running close to the long-term trend line. The short-term natural variability that drove the exceptional warmth of 2023 and 2024 has dissipated, but rather than dipping below trend as often follows such an event, the moving average is being held up — and is expected to rise — by the developing El Niño. This short-term variability is an inherent part of the climate system and is expected even alongside persistent long-term global warming.
Spatial Variation
In July 2026, warmer-than-average temperatures covered nearly the entire globe. They were especially pronounced across the central and eastern tropical Pacific — where the developing El Niño is now unmistakable — as well as North America, the North Atlantic, Western and Southern Europe and the Mediterranean, North Africa and the Sahara, the Middle East, Central Asia, Siberia, and East Asia. The most striking cool anomaly was a pronounced cold region over the Atlantic sector of the Southern Ocean near Antarctica, with only a few small cool patches elsewhere.
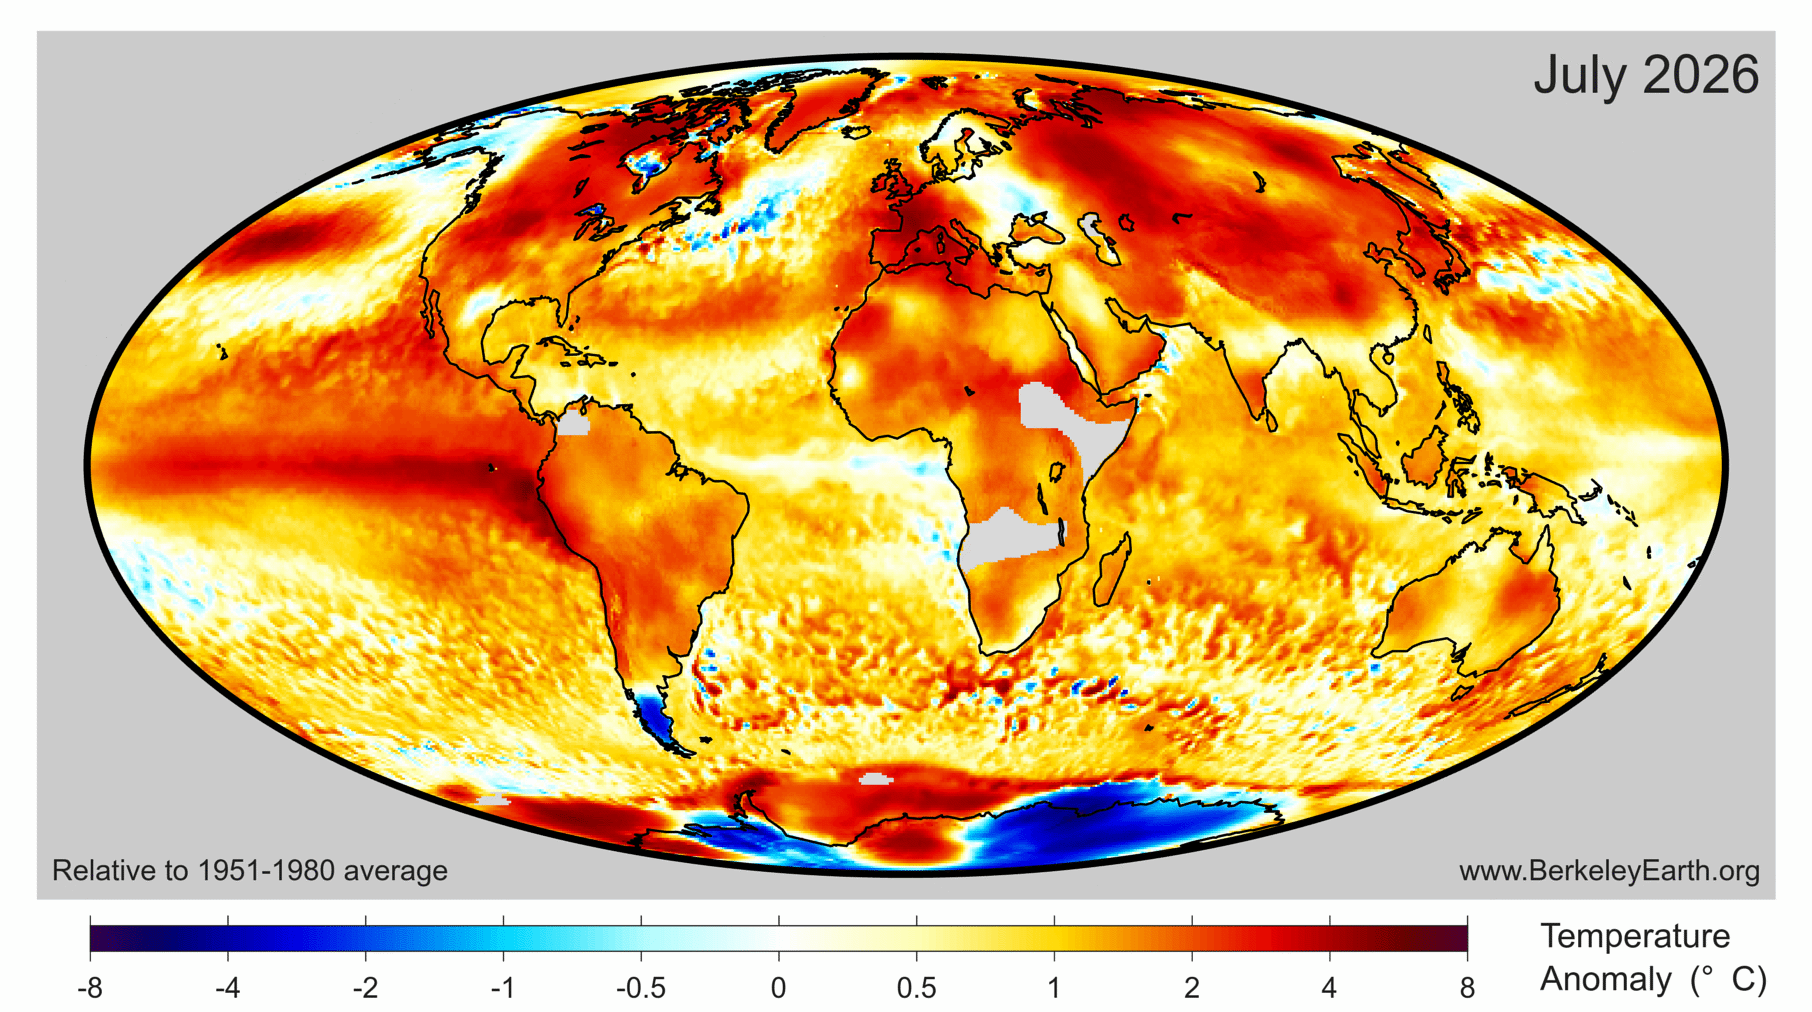
Roughly 8.5% of Earth’s surface experienced its locally warmest July on record (about 6.0% of land and 9.8% of ocean surfaces) — a larger fraction than in June, consistent with the building El Niño. Record warmth was concentrated across the central and eastern tropical Pacific, the Mediterranean and Southern Europe, North Africa and the Sahara, western Russia and Central Asia, Siberia, eastern China, and portions of the North Atlantic and North Pacific.
Near record cold for July was observed in parts of Antarctica.
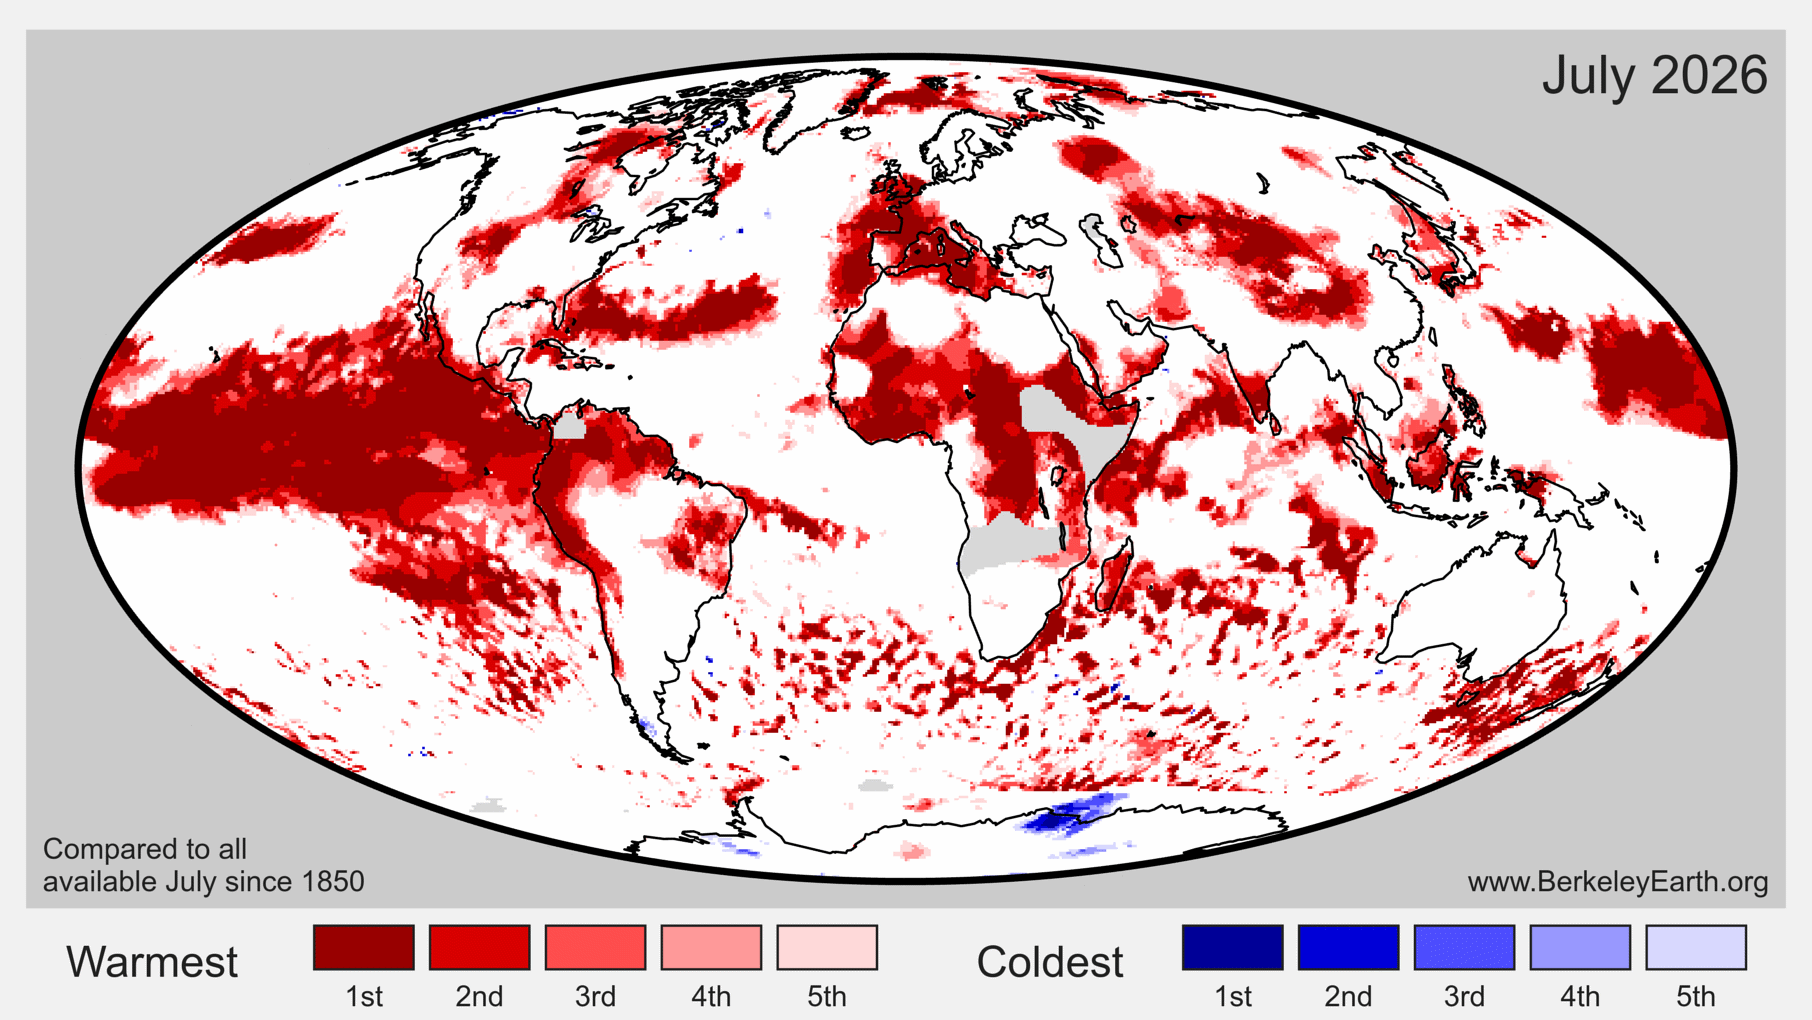
We further estimate that 32 countries set monthly records for July average temperature: Andorra, Antigua and Barbuda, Burkina Faso, Central African Republic, Chad, Colombia, Costa Rica, Democratic Republic of the Congo, Ecuador, France, Ghana, Guinea, Indonesia, Ivory Coast, Kazakhstan, Kenya, Liberia, Mali, Malta, Mauritania, Panama, Peru, Russia, Saint Kitts and Nevis, Saint Lucia, Sierra Leone, South Sudan, Sri Lanka, Suriname, Togo, Tanzania, and the United States of America.
In addition, continent-wide July average records were set for Africa and Asia.
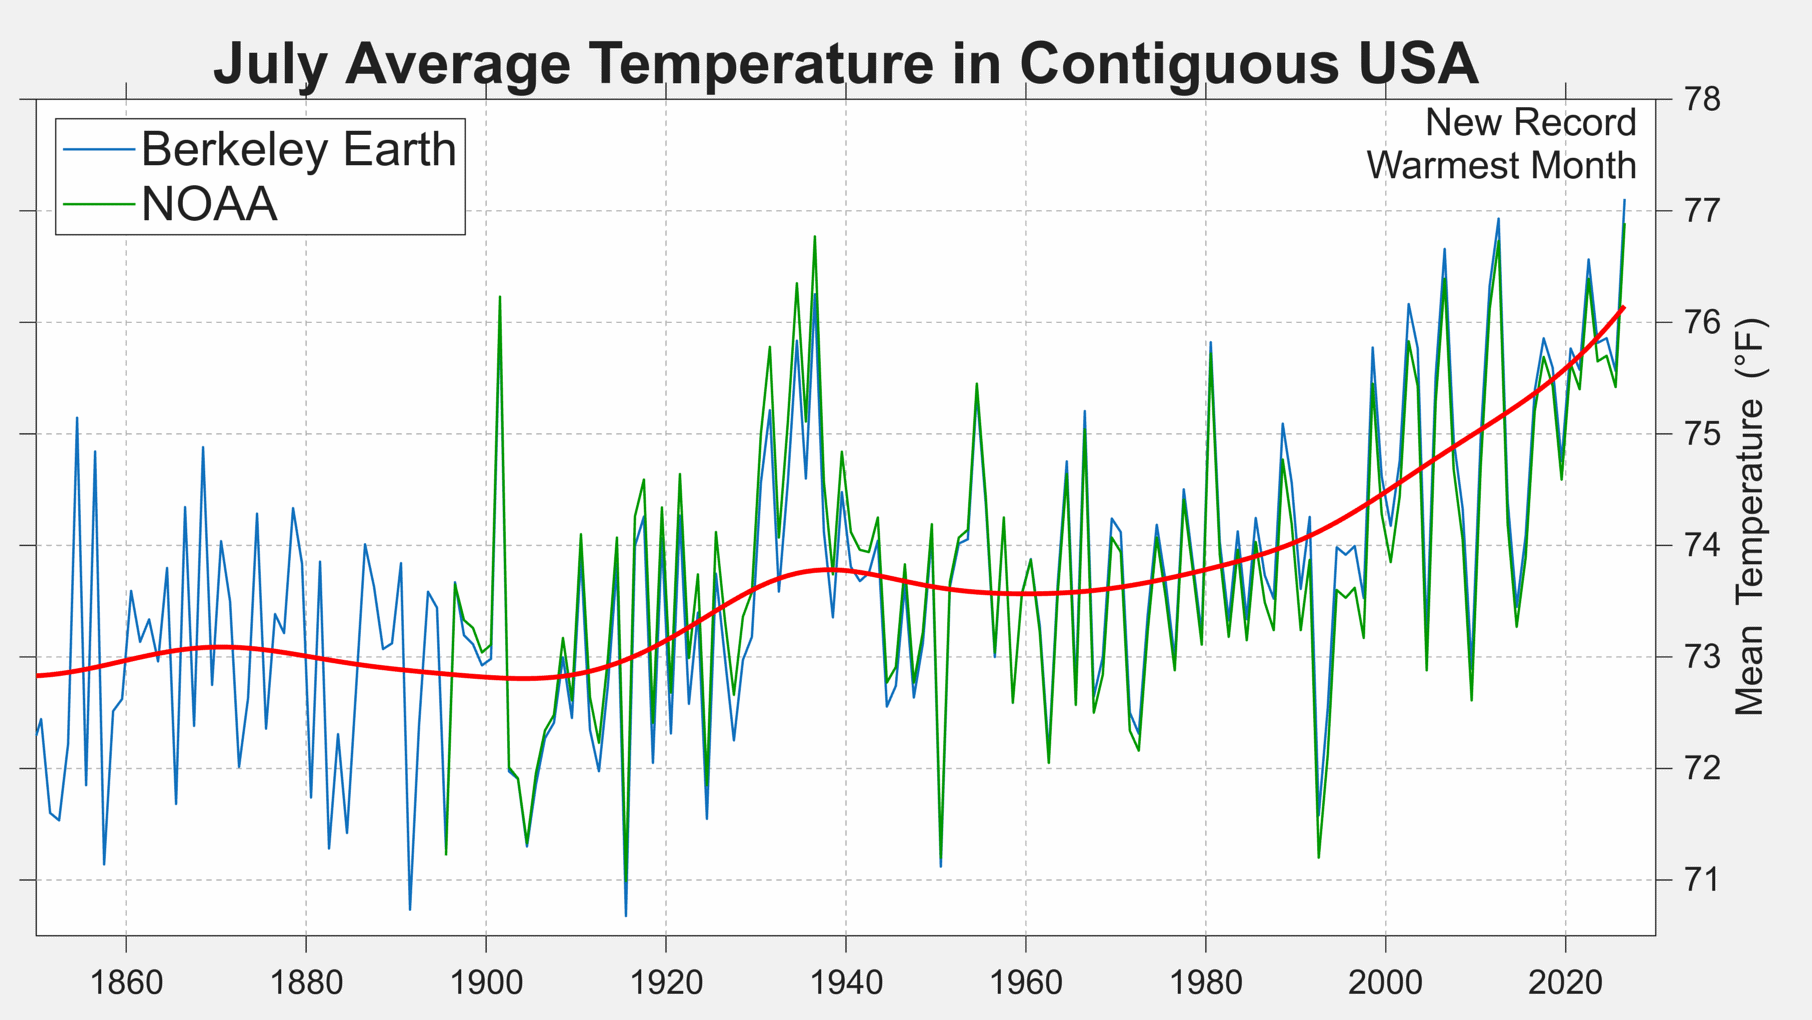
It is particularly noteworthy that July 2026 became the warmest month (of any kind) for the contiguous USA (i.e. lower 48 states) in both the Berkeley Earth and NOAA datasets. The national average set in 1936, during the height of the Dust Bowl, has long stood as NOAA’s all-time warmest monthly average, and many local records still date from that period. Berkeley Earth already had a slightly different ranking with July 2012 warmer than July 1936, but in both datasets July 2026 is now the warmest monthly-average for the contiguous USA.
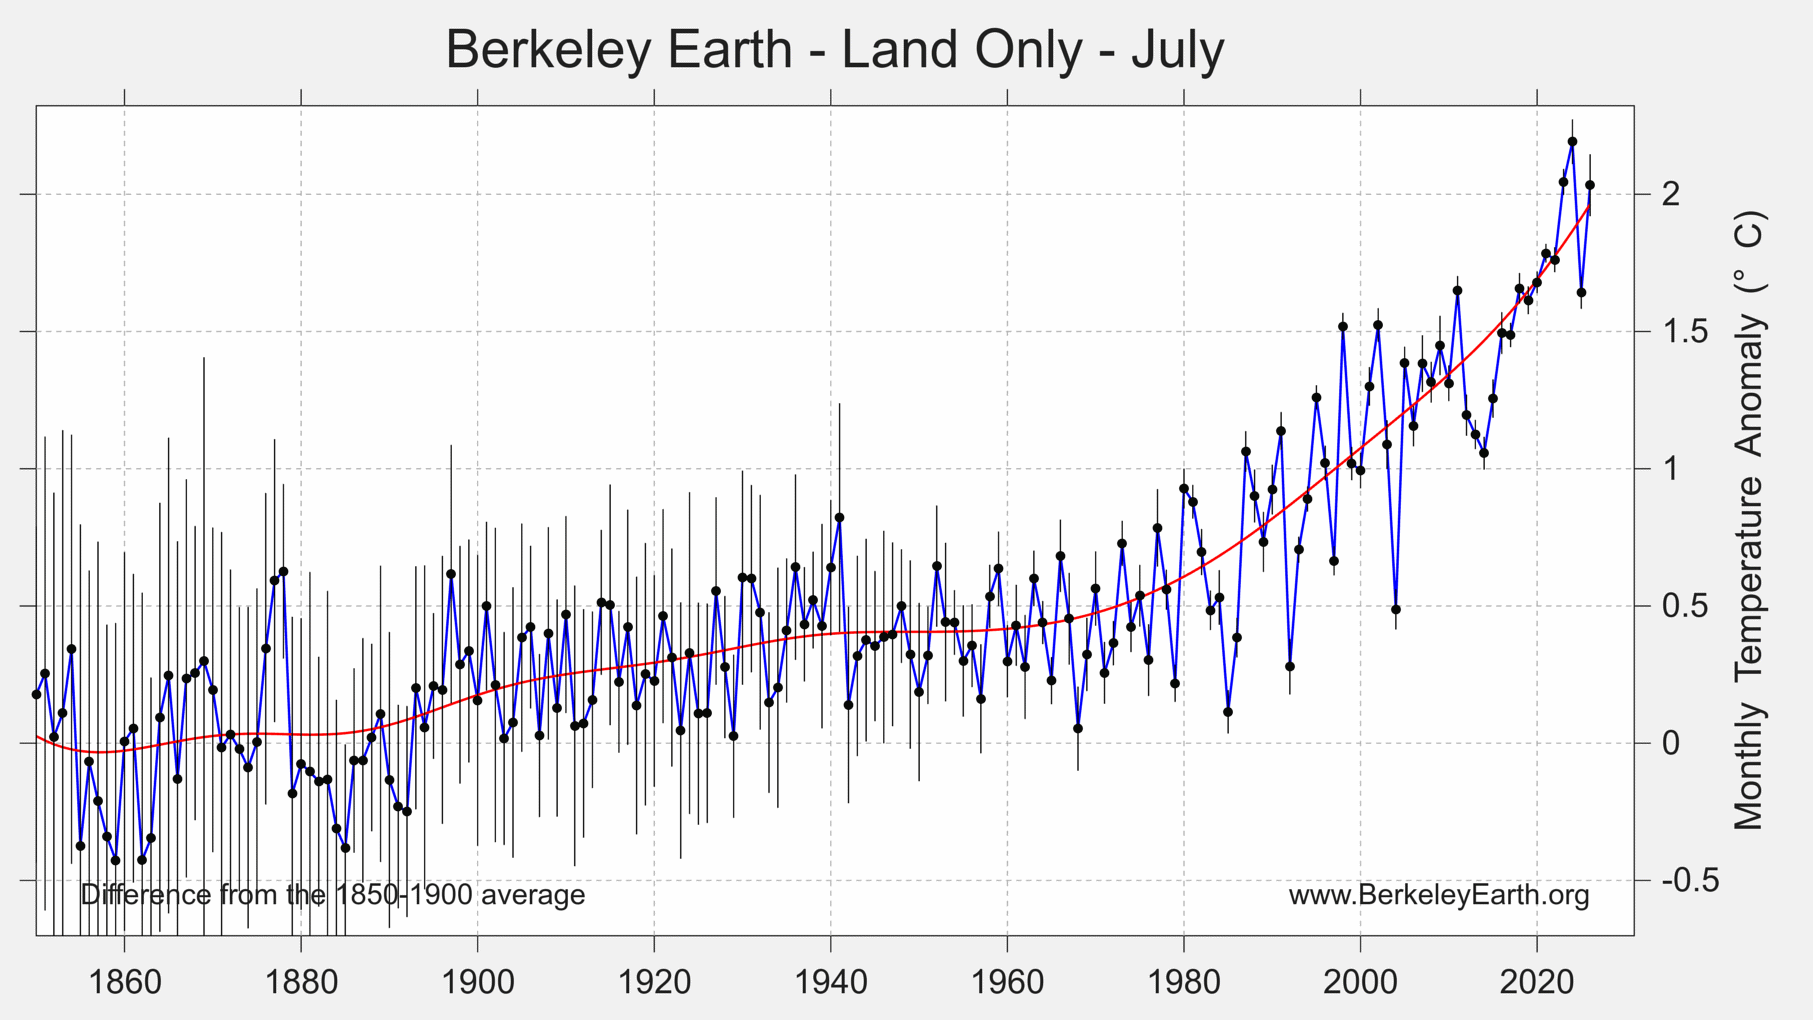
Over land regions, July 2026 was nominally the 3rd warmest July since 1850, with a terrestrial average of 2.03 ± 0.20 °C (3.66 ± 0.35 °F) above the 1850–1900 average. Land temperatures rose further from June, though the month’s extreme heat was regionally concentrated — most intensely across Europe, the Mediterranean, and North Africa — even as parts of the interior continents ran closer to average.

Average ocean temperatures in July 2026 were 1.25 ± 0.09 °C (2.25 ± 0.17 °F) above the 1850–1900 average, nominally the 2nd warmest July on record for ocean surfaces. Ocean averages have climbed steadily as El Niño has developed in the equatorial Pacific, and independent analyses reported July 2026 as the warmest July on record for the world’s non-polar oceans, with record sea surface temperatures across the Atlantic and western Mediterranean.

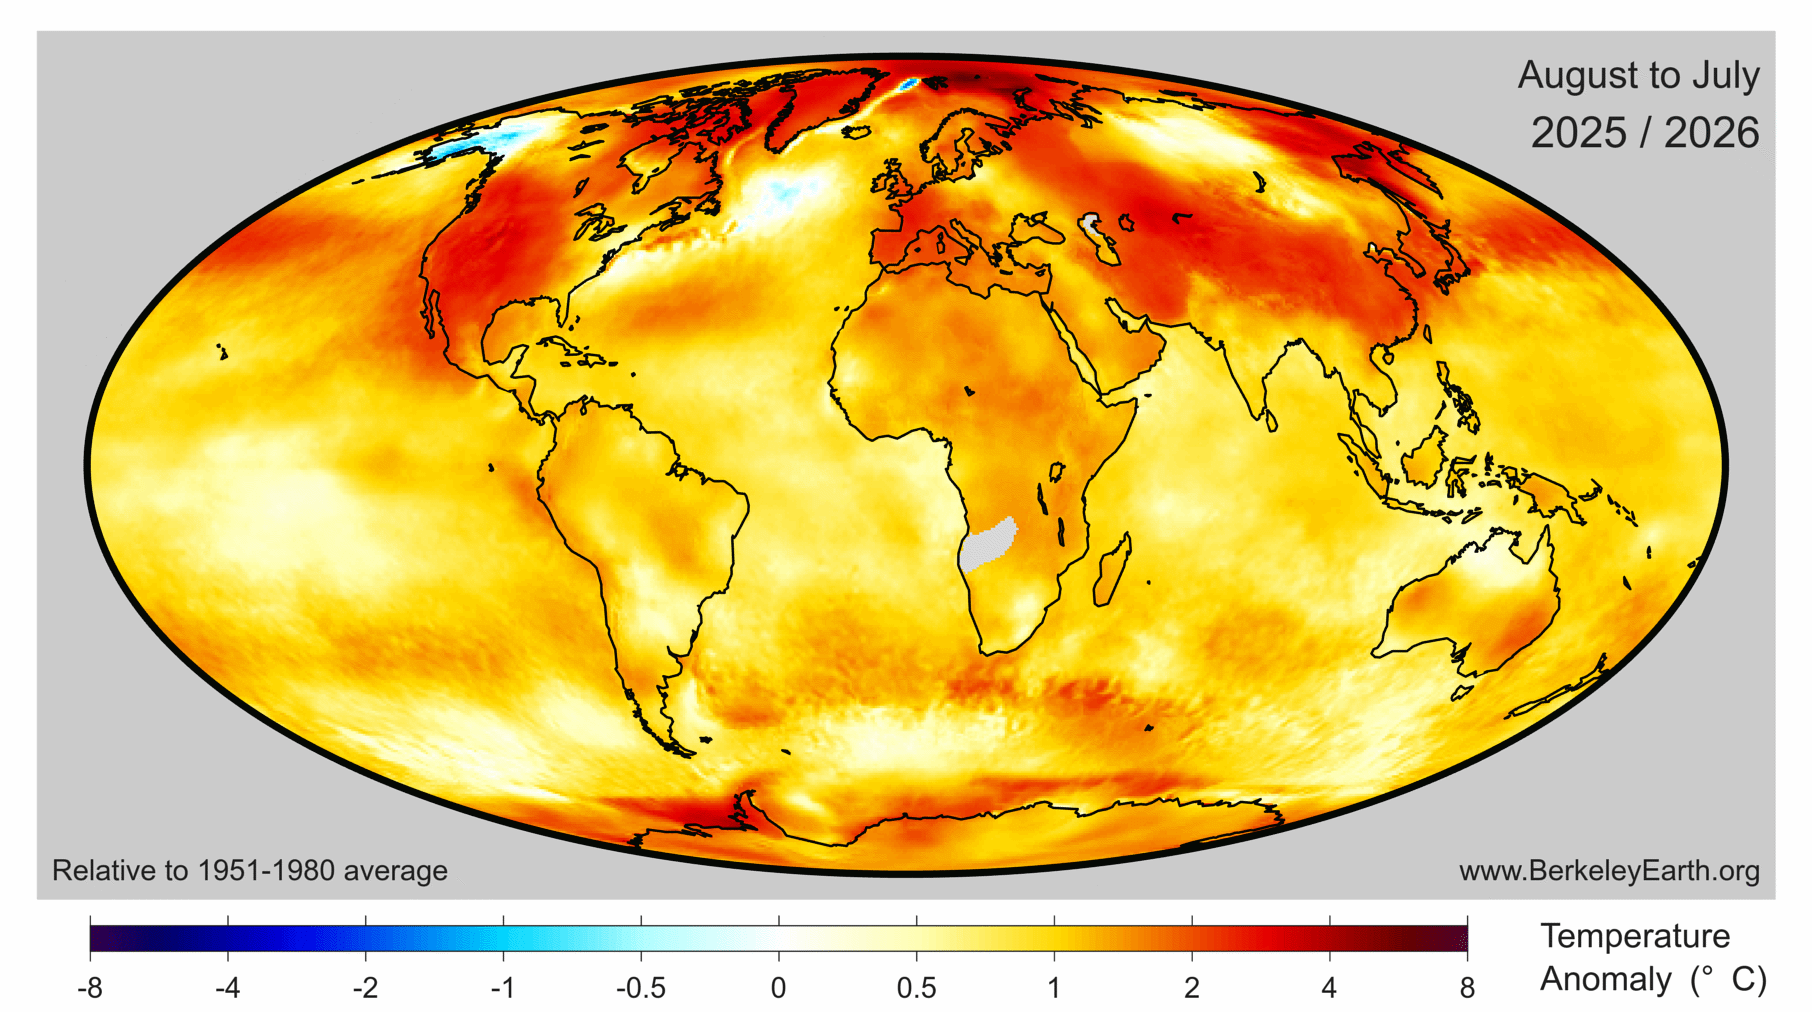
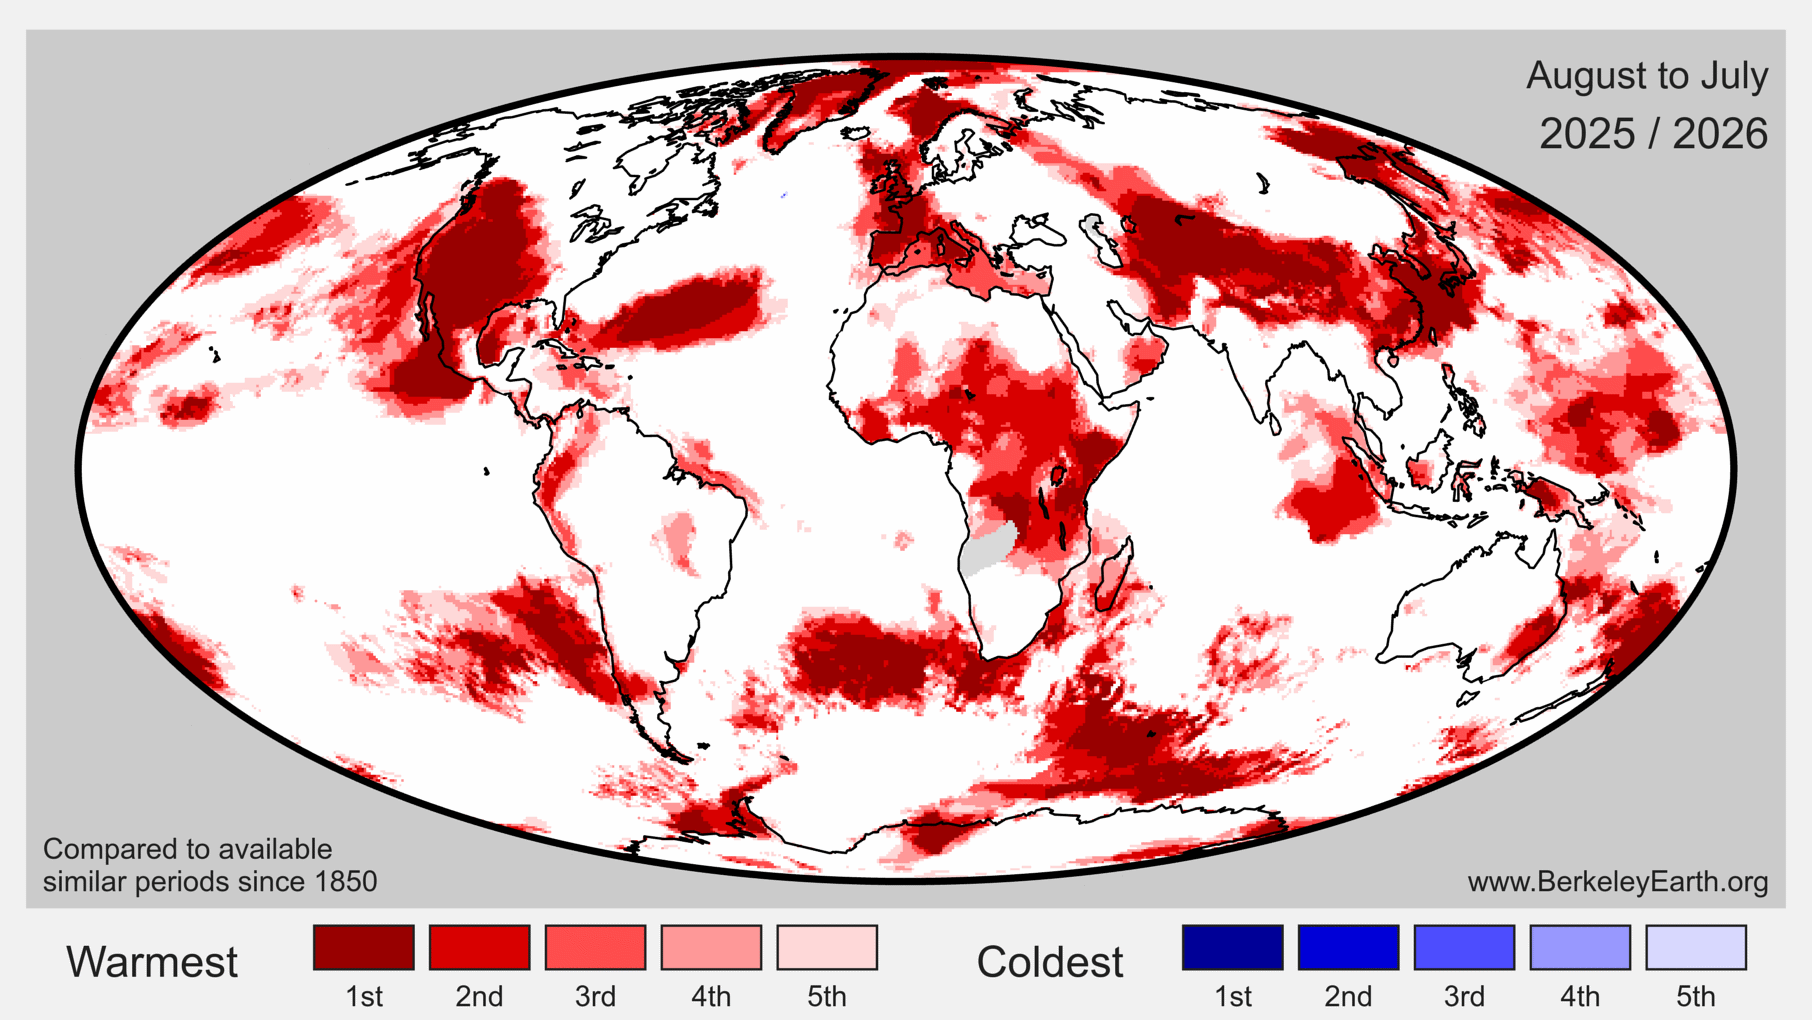
Over the most recent 12 months (August 2025 to July 2026), the global average was 1.48 ± 0.08 °C (2.66 ± 0.13 °F) above the 1850–1900 average, making it the 3rd warmest such 12-month period on record. The 12-month anomaly map continues to show the strongest warmth across the Arctic and the northern high latitudes of Canada, Russia, and Siberia, with no regions of significant relative cooling.
July Heatwaves and Wildfires
July brought a series of damaging heat extremes across the Northern Hemisphere. Western Europe experienced its hottest combined June–July period on record, with successive heatwaves through the month driving widespread record daily highs. The persistent heat and drought fueled severe wildfires across the Mediterranean — including southern France, Spain, Portugal, and Greece — forcing thousands of people to evacuate. These events extend a pattern seen throughout the summer, in which Europe, the fastest-warming continent, has faced repeated life-threatening heat.
North America was also affected. A significant heatwave tied or broke temperature records in cities across the United States and Canada, and extensive wildfire activity developed in Canada — with fires in Ontario alone burning several hundred thousand hectares and prompting evacuations. The widespread warmth and drying across northern Canada that began earlier in the summer helped set the stage for this fire activity.
Heat-related impact figures reported here draw on preliminary media and agency estimates from July 2026 and are subject to revision. Berkeley Earth’s temperature analysis quantifies the physical warming; attribution of specific impacts to climate change requires dedicated study.
ENSO Conditions
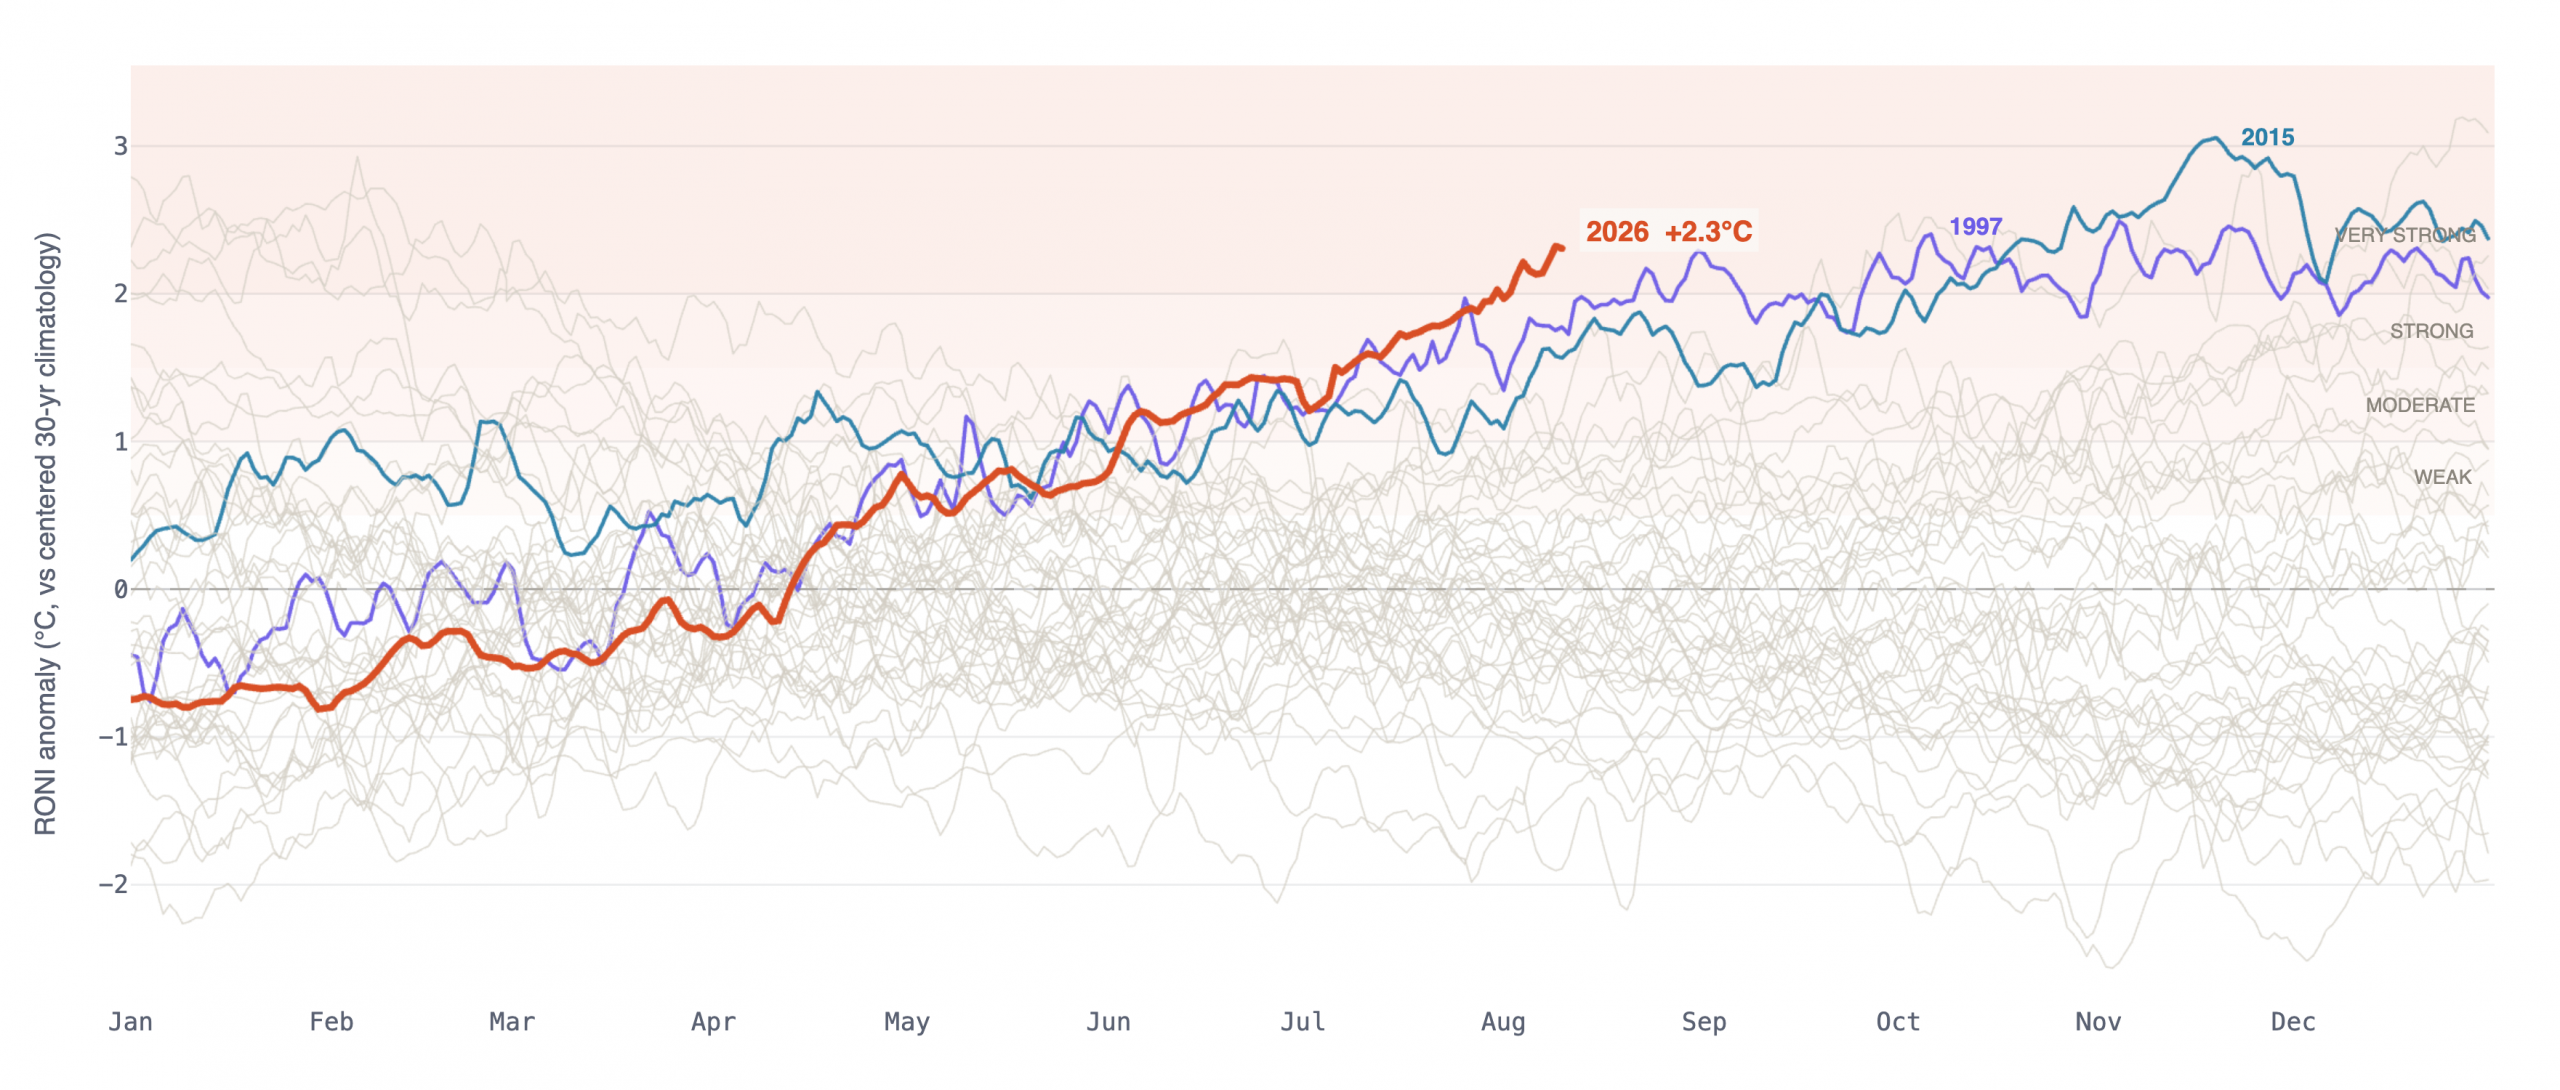
The El Niño that emerged in the spring has continued to strengthen rapidly. As of early August 2026, NOAA’s Climate Prediction Center has an El Niño Advisory in effect, and the daily Niño 3.4 index has climbed to about +2.7 °C measured against its own era’s climatology — the trend-removed basis shown in the figure below, equivalent to roughly +2.8 °C on the conventional fixed baseline, or about +2.2 °C on the background-adjusted relative index — already well into very strong or “super” territory. No El Niño in the modern record has run this warm this early in its development: measured against each year’s own climatology, 2026 is now tracking above even the great 1997 and 2015 events at the same point in the year. The warming is being reinforced by physical ocean processes, including downwelling Kelvin waves and a large subsurface warm pool in the equatorial Pacific.
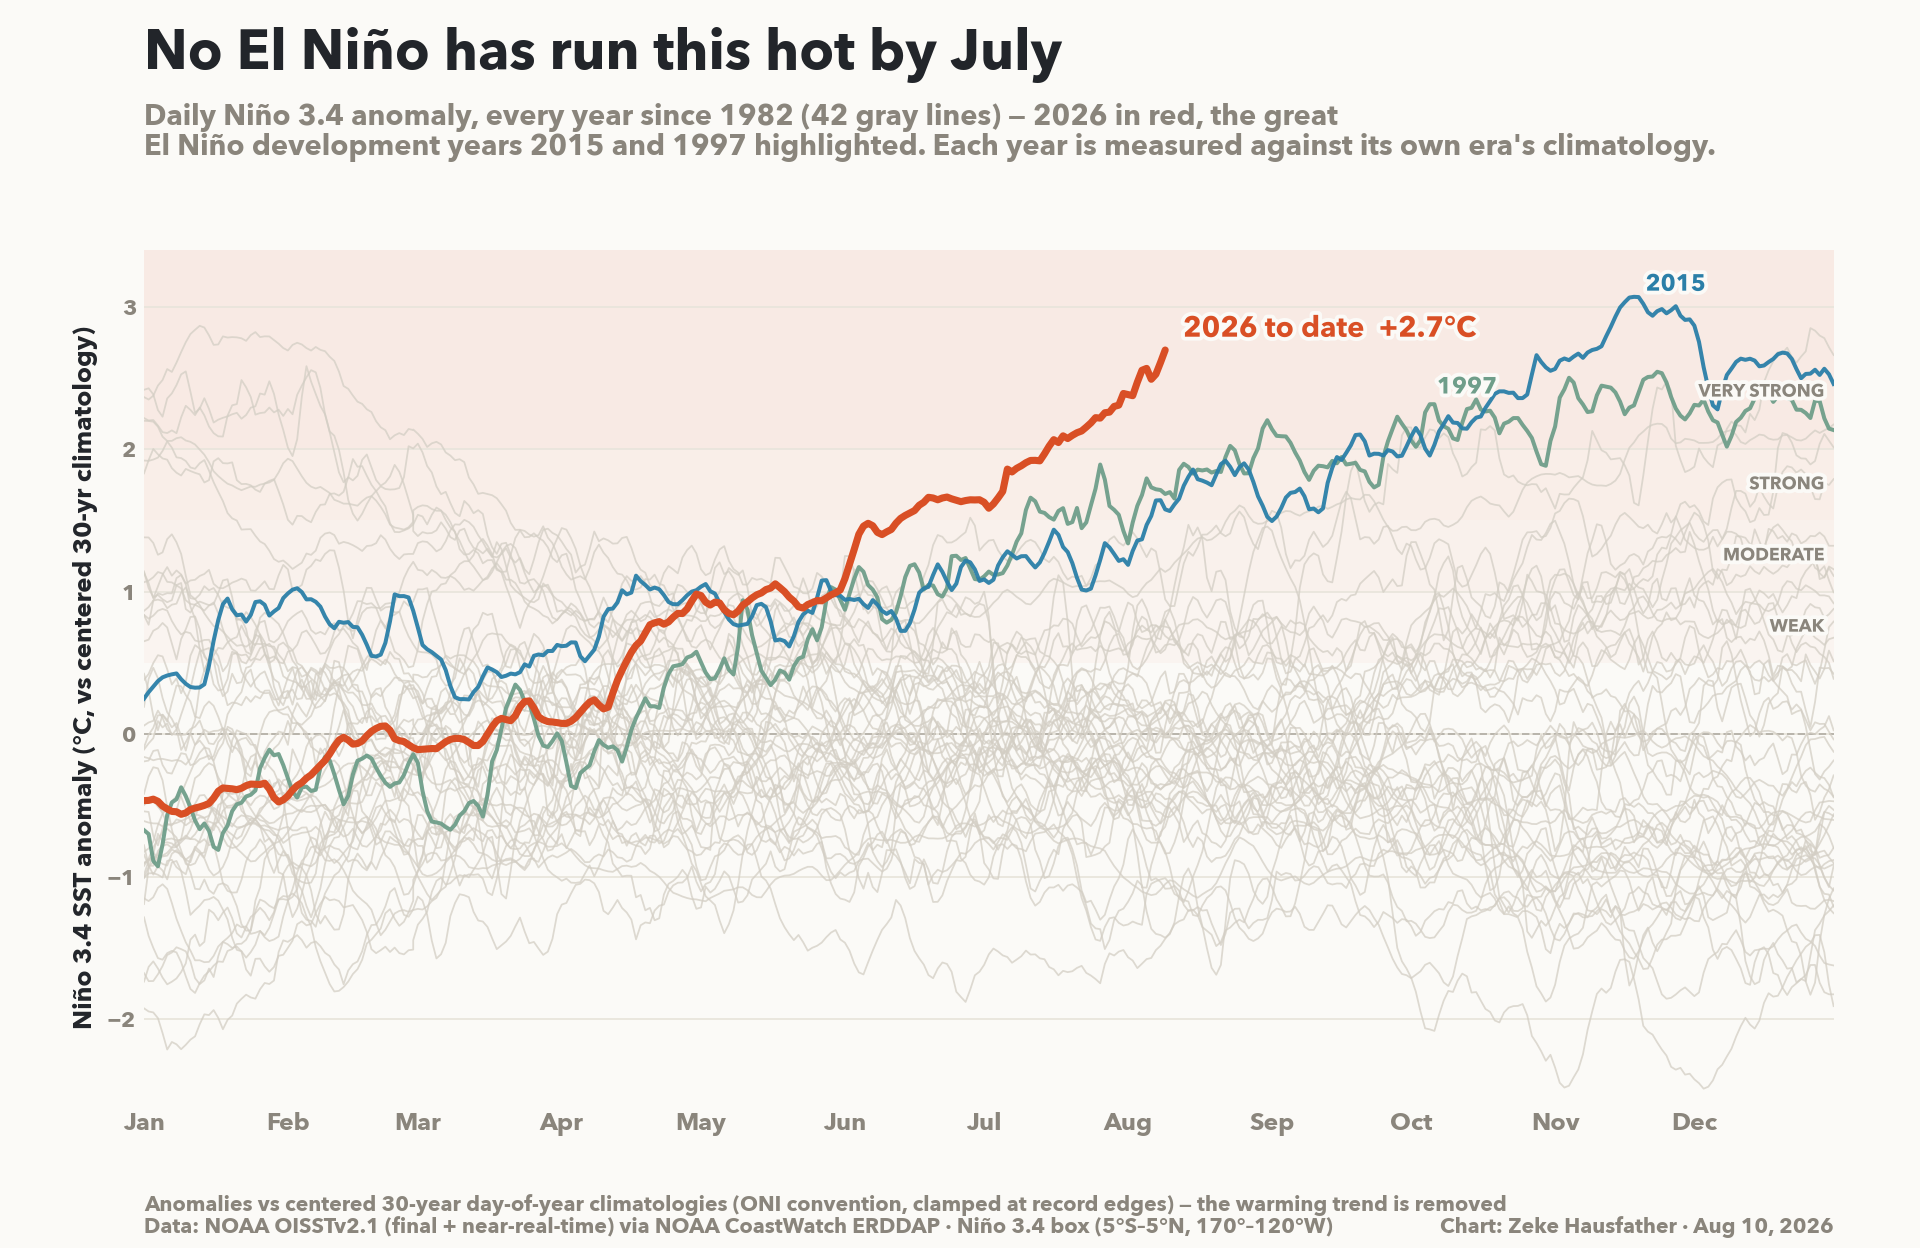
Even when correcting for the average rate of warming of the tropical oceans, as shown below, the current El Niño conditions appear unprecedented for July within the satellite era.
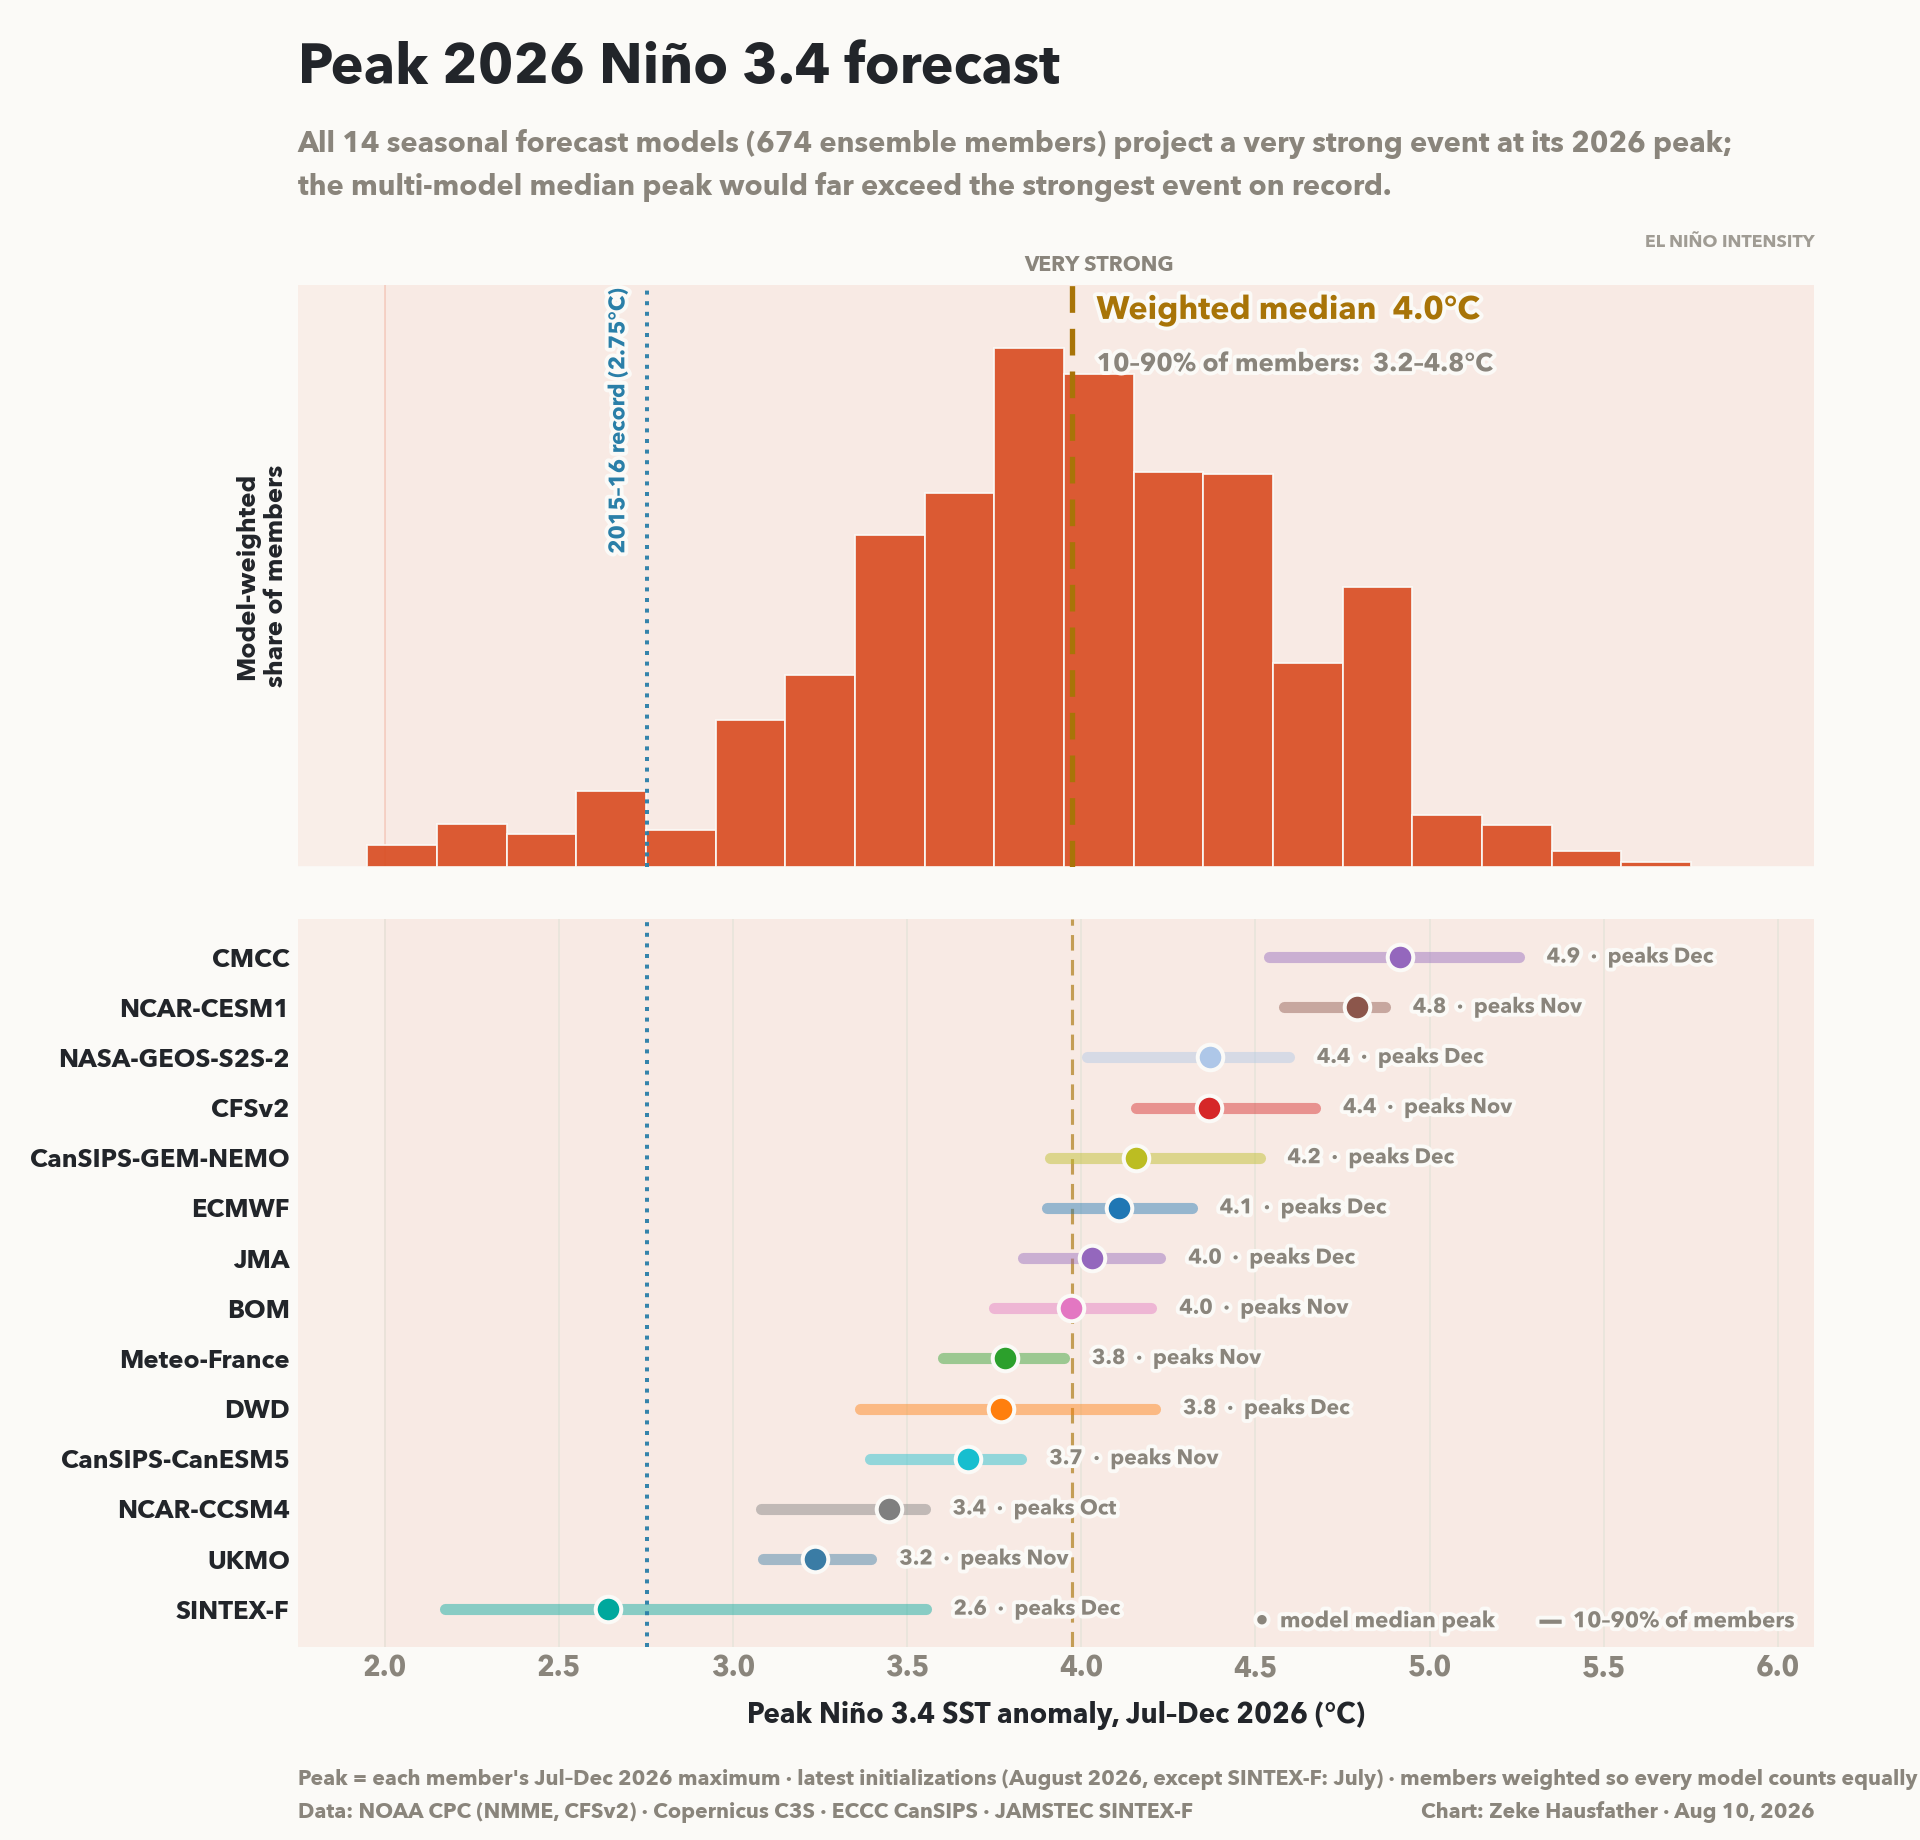
Forecasters expect further, exceptional intensification. Across the 14 operational seasonal forecast systems (674 ensemble members), every model projects a very strong event at its peak, and the multi-model weighted-median peak Niño 3.4 anomaly is near +4.0 °C — with 10–90% of members between +3.2 and +4.8 °C — most likely in November 2026. That is far above the roughly +2.75 °C peak of the 2015–16 event, the strongest in the modern record; on the background-adjusted relative index the projected peak of about +3.3 °C would likewise set a record. NOAA correspondingly assigns roughly an 81% chance of very strong conditions during October–December 2026 and about a 63% chance of a “super” El Niño peaking around November 2026 to January 2027, with roughly a 97% chance the event persists into early Northern Hemisphere spring 2027.
Because the global-average temperature response typically lags the peak in the central Pacific by several months, much of this event’s warming influence is expected to carry into 2027. For more information, see NOAA’s Climate Prediction Center report and our discussion at The Climate Brink.
2026 Outlook
With seven months of data in hand, the outlook for the 2026 annual average has shifted decisively upward. Where a month ago a record year looked unlikely, the strengthening El Niño and July’s move above 1.5 °C have flipped the balance: we now calculate roughly a 69% chance that 2026 will become the warmest year on record, up from 12% in the June update. The forecast model, which had been more skeptical of the El Niño’s near-term impact than the ENSO ensembles, has now come into closer agreement with them. The most likely alternative is a 2nd-place finish (about 30%). We currently estimate a near-certain (~99%) chance that the 2026 annual average will exceed 1.5 °C (2.7 °F) above the 1850–1900 average, with a likely annual range of roughly 1.52–1.65 °C. As always, because El Niño’s global impact lags its Pacific peak, an even larger warming influence — and a strong chance of a further record — is expected in 2027.
| Estimated probability of 2026 annual final ranking | Likelihood |
|---|---|
| Warmest year on record (1st) | ~69% |
| 2nd warmest | ~30% |
| 3rd warmest or lower | <1% |

Remarkably, there is likely to be a disconnect in 2026 between record warmth in the ocean and less-than-record warmth on land. On land, we estimate a < 1% chance of record warmth in 2026, with a 47% chance of 2nd place finish behind 2024. Year-to-date the land average has been only the 4th warmest on record. While the land average is near certain to finish in the top 5 warmest, the relatively cool conditions on land early in 2026 have been holding the average back, and the expected effects of El Niño do not appear to be sufficient to create a record annual-average on land in 2026.
By contrast, we estimate a near certainty (>99%) that El Niño will help to deliver record annual-average warmth for the oceans in 2026.