
The following is a summary of global temperature conditions in Berkeley Earth’s analysis of August 2026.
- August 2026 was the warmest August on record, with a global average of 1.71 ± 0.11 °C (3.07 ± 0.20 °F) above the 1850–1900 average, ahead of August 2023. It was also the 2nd warmest month of any kind in our record.
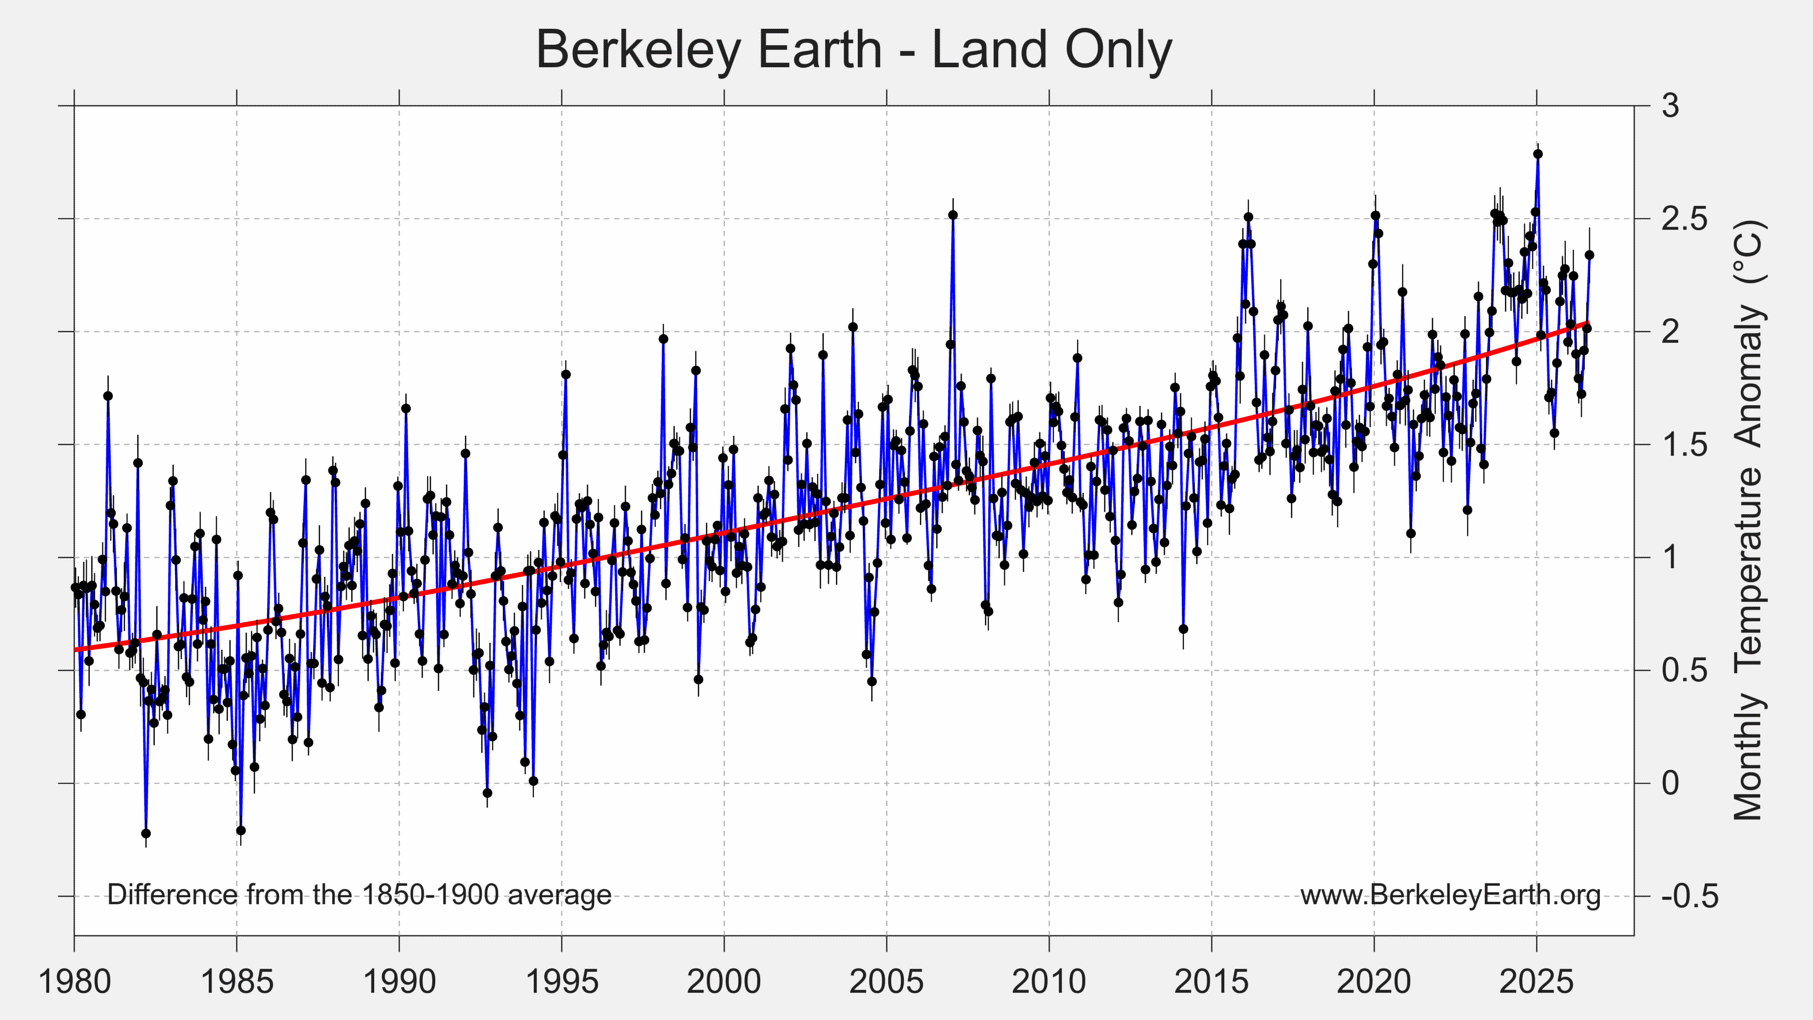
- Land temperatures averaged 2.34 ± 0.16 °C (4.21 ± 0.29 °F) above the 1850–1900 average, nominally the 2nd warmest August for terrestrial regions and effectively tied with August 2024.
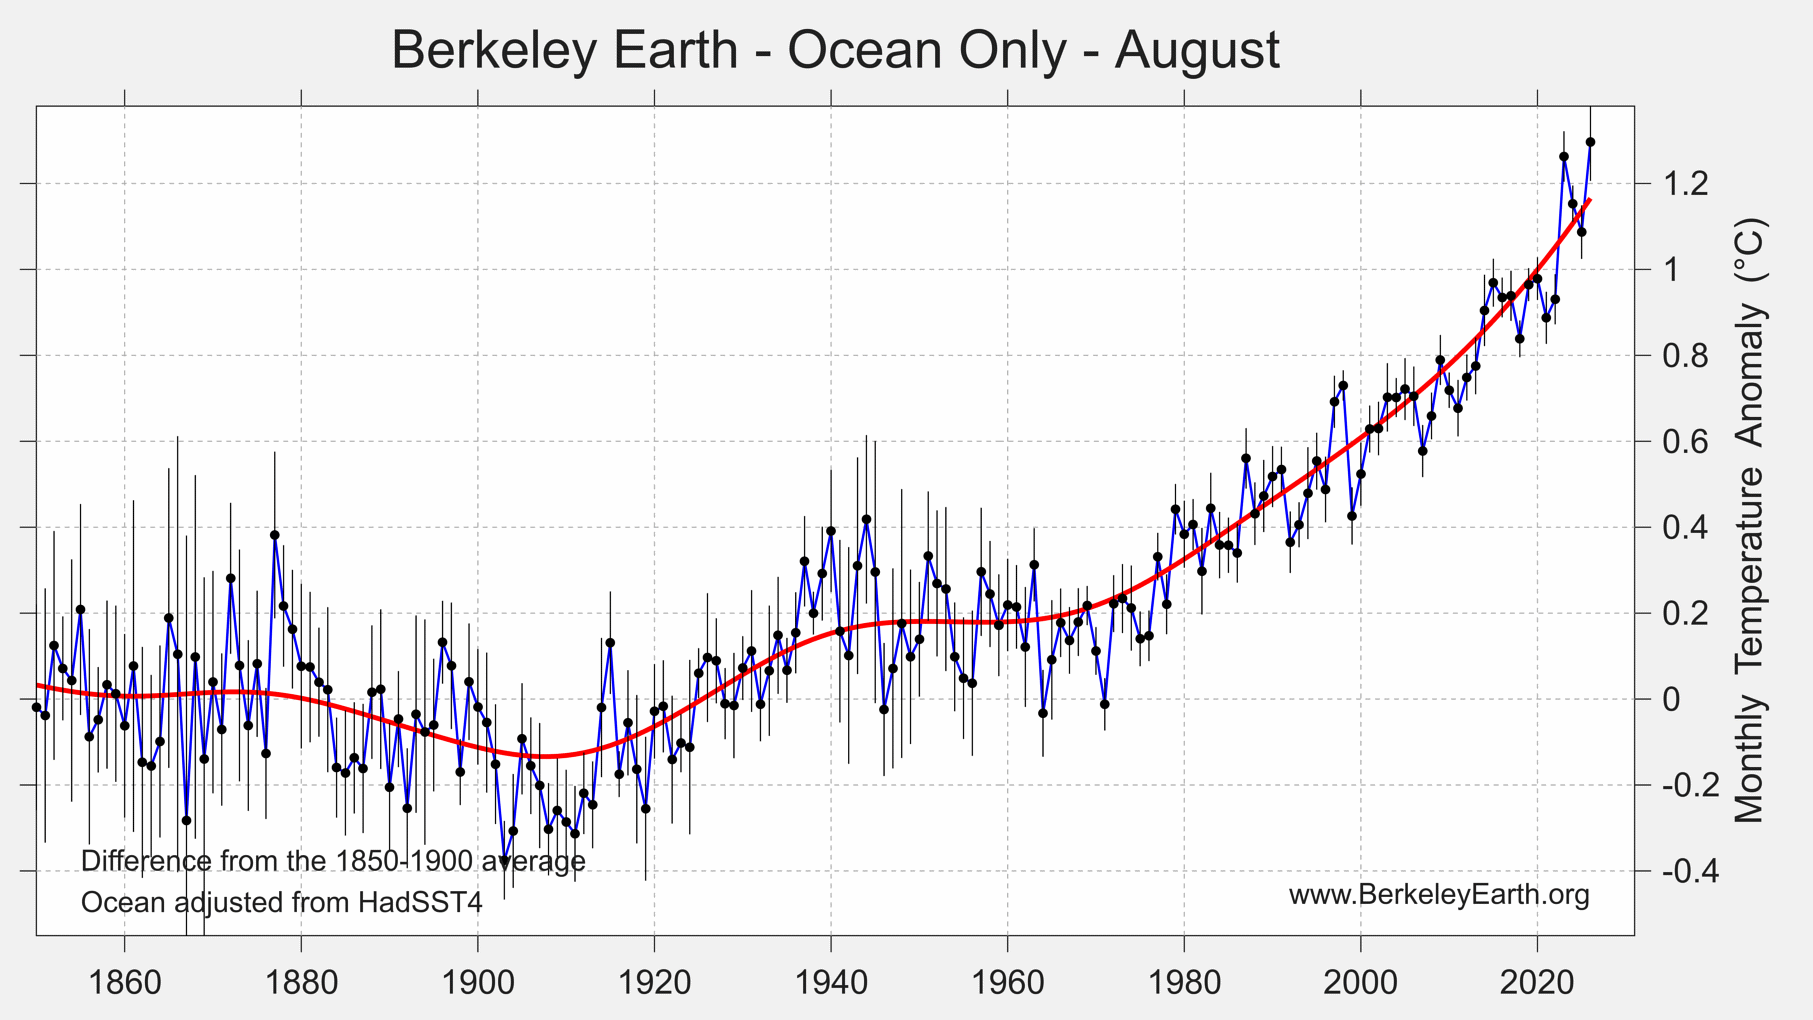
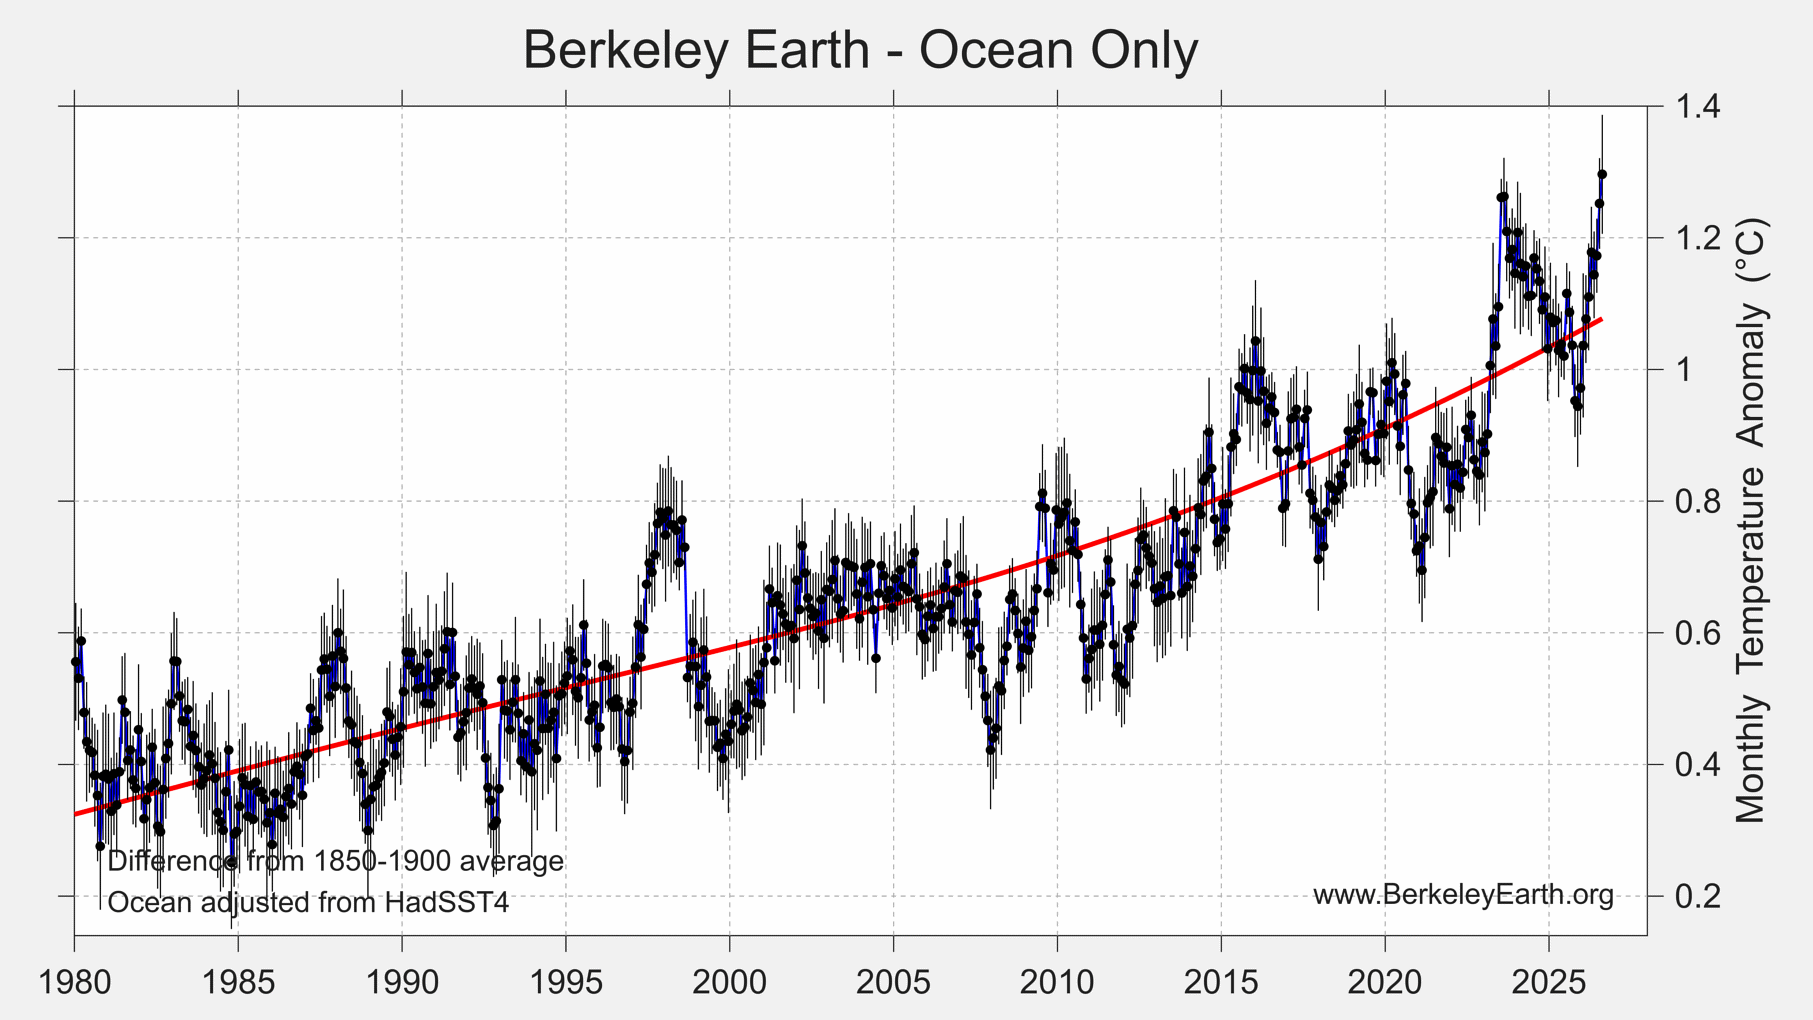
- Ocean temperatures were 1.296 ± 0.097 °C (2.33 ± 0.17 °F) above the 1850–1900 average — not only the warmest August for ocean surfaces, but nominally the warmest month of any kind ever recorded for the oceans.
- June to August 2026 was nominally the warmest such three-month period on record, at 1.56 ± 0.10 °C (2.82 ± 0.17 °F) above the 1850–1900 average.
- El Niño has continued to intensify, and forecasters now regard a record-strength event as close to certain.
- Roughly 10.2% of Earth’s surface experienced its warmest August on record, and 75 countries set national August records.
- 2026 now has roughly a 93% chance of becoming the warmest year on record, up from about 69% a month ago.
Global Summary
According to Berkeley Earth’s high-resolution temperature dataset, August 2026 was the warmest August since records began in 1850, with a monthly global average of 1.71 ± 0.11 °C (3.07 ± 0.20 °F) above the 1850–1900 (pre-industrial) average.
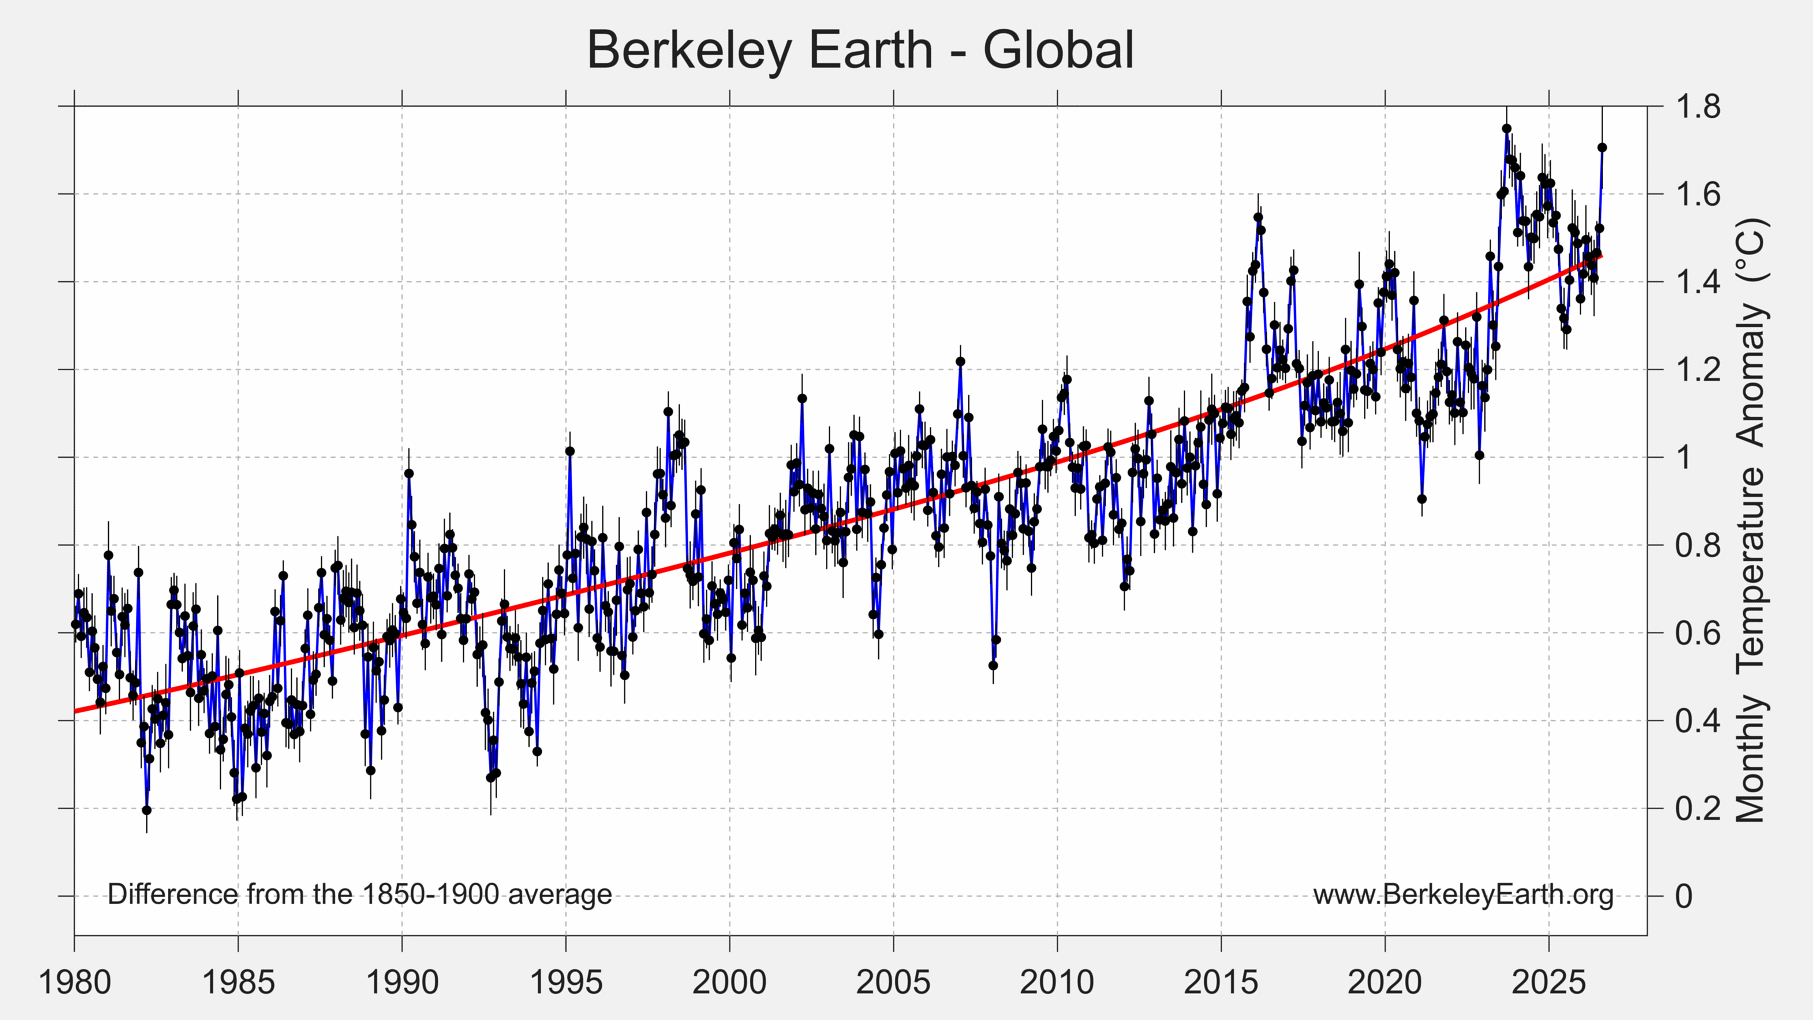
It sits ahead of August 2023, the previous warmest August, by about 0.10 °C. Measured against every month in the record rather than only Augusts, August 2026 ranks 2nd largest temperature anomaly on reco& rd behind only September of 2023. It is the second time an anomaly of more than 1.7 °C has been reported and only the 10th month with an anomaly above 1.6 °C
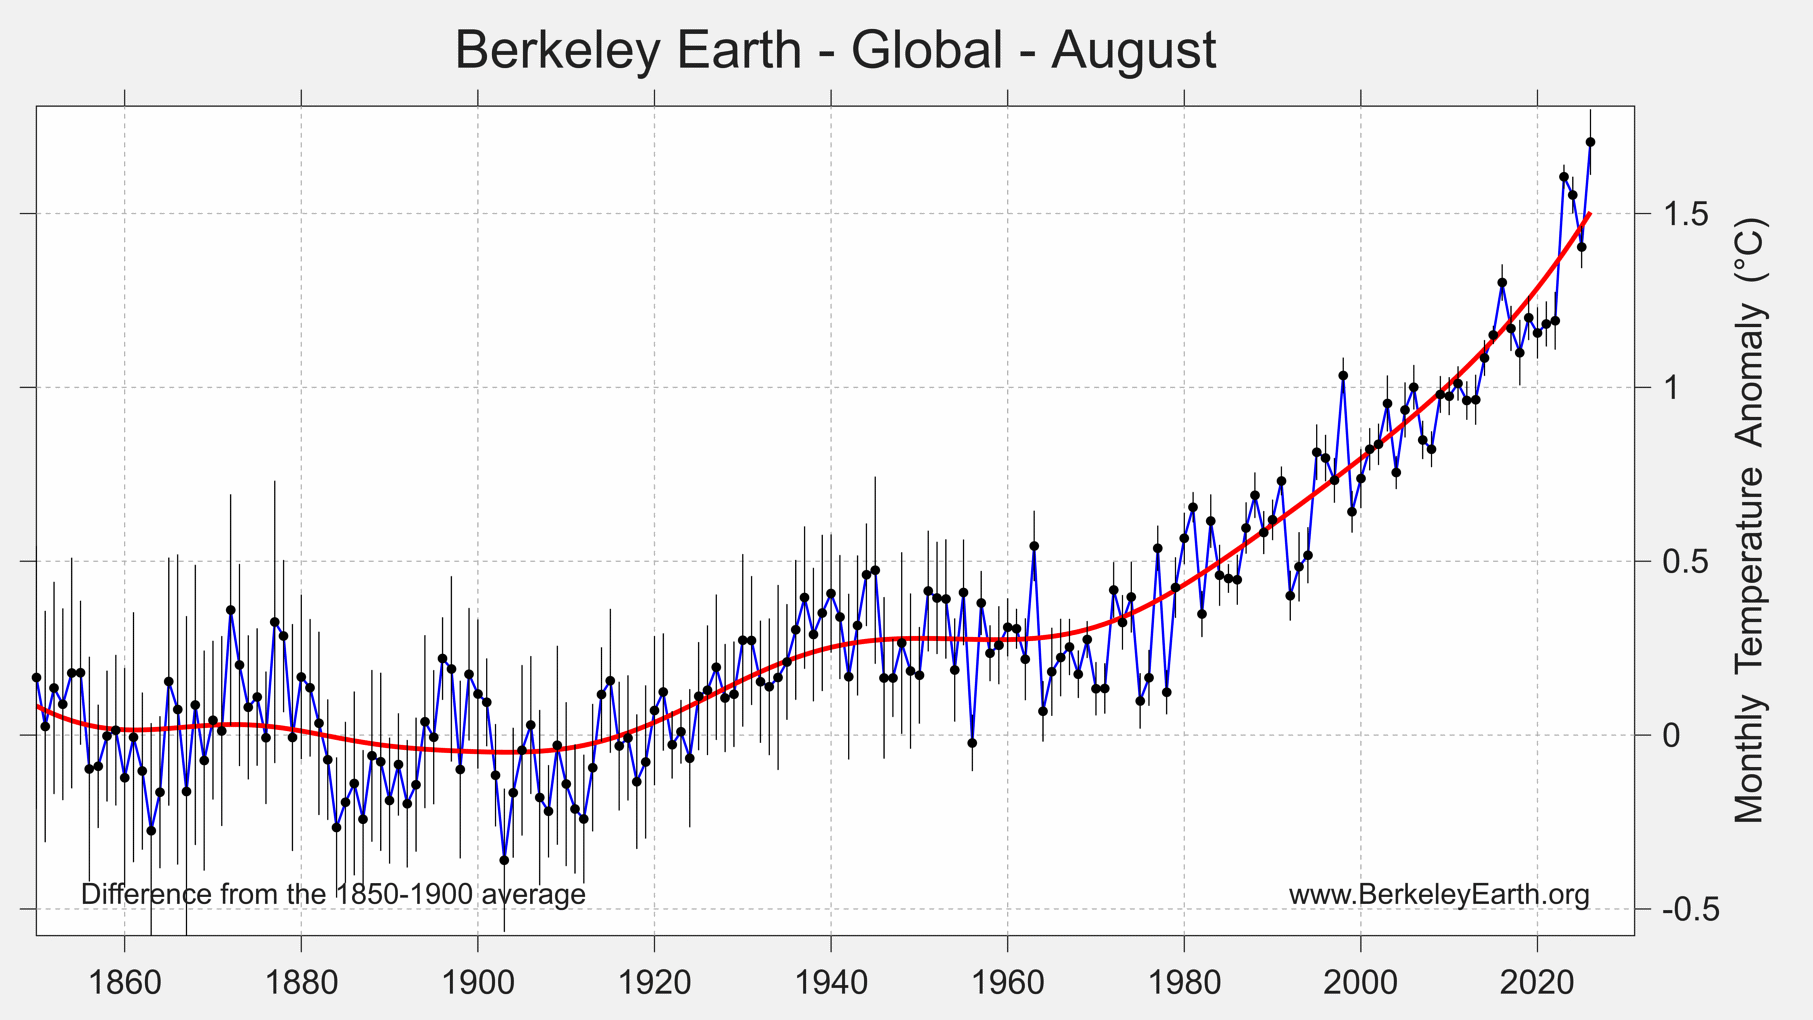
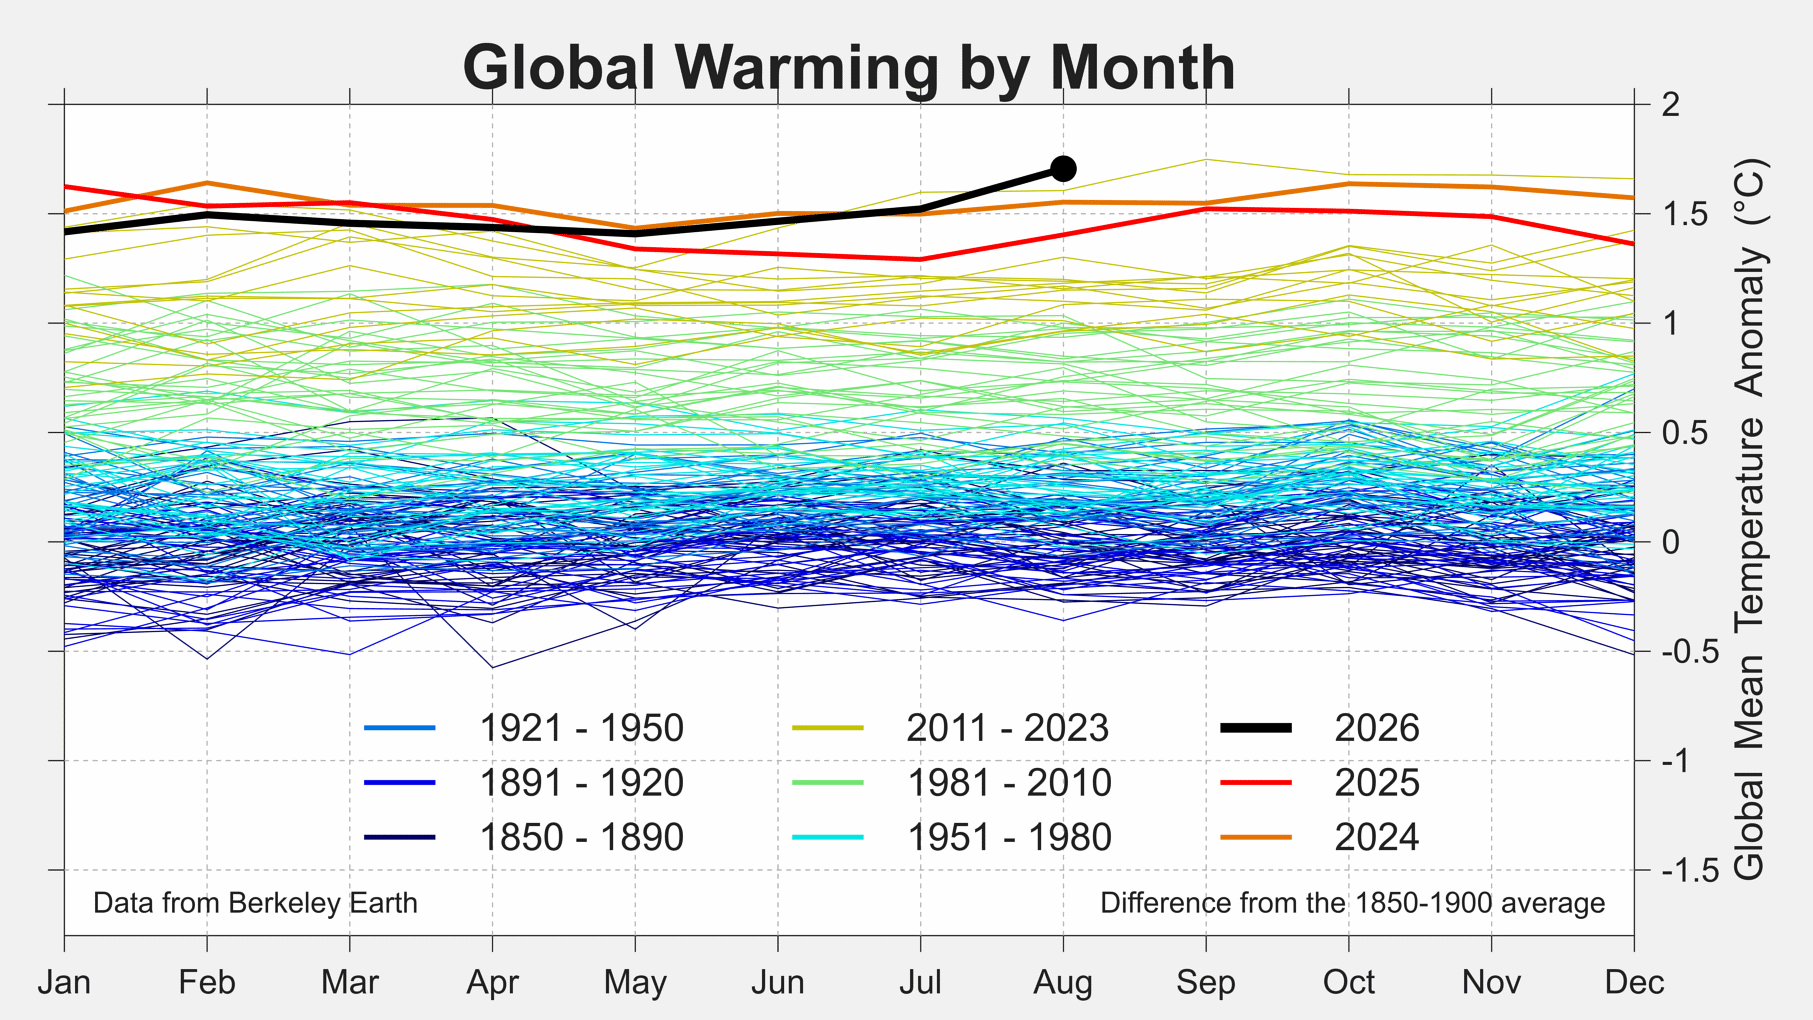
On a month-to-month basis, temperatures spiked sharply higher in August as the effects of El Niño begin to be felt in earnest. After a cool start to the year, most months were only the send, third, or fourth warmest overall, with no prior record months. August is the second consecutive month above the 1.5 °C mark.
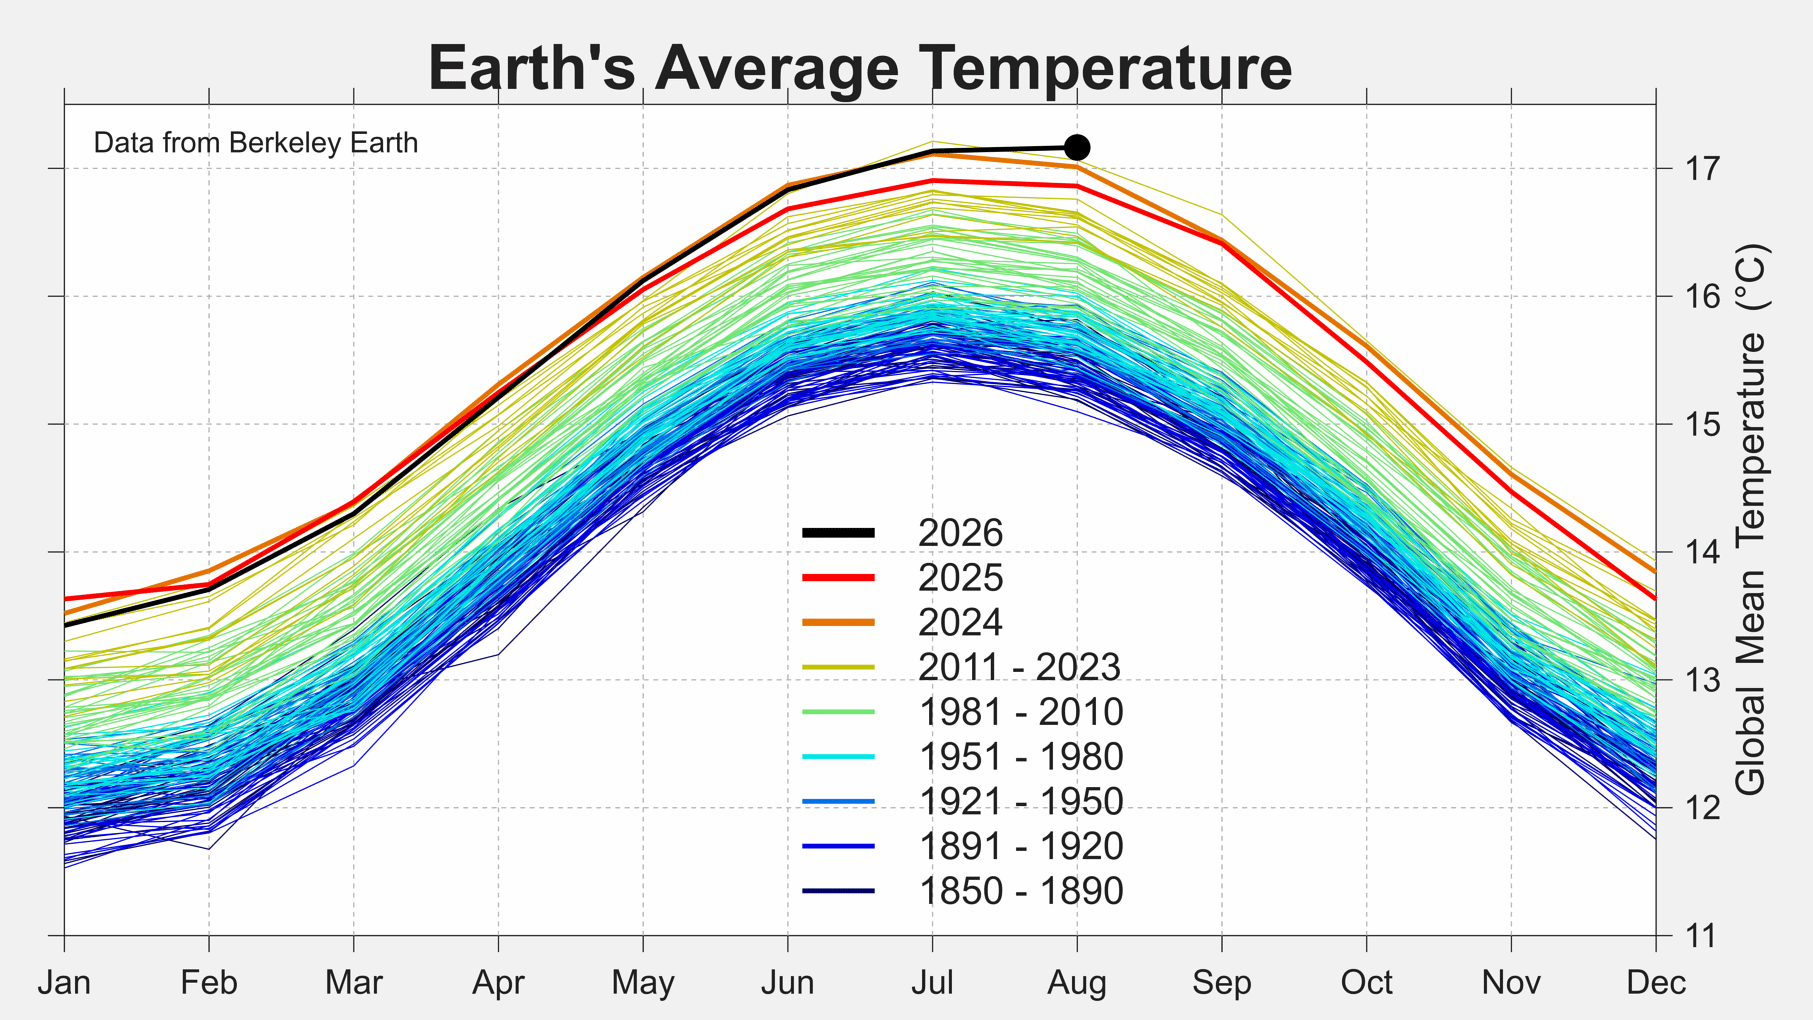
The anomalies above have the seasonal cycle removed. In absolute terms — the actual temperature of the planet — August 2026 was nominally the 2nd warmest month in the entire record at 17.16 °C, but essentially tied July 2023 at 17.21 °C. Because most of Earth’s land lies in the Northern Hemisphere, the global mean ordinarily peaks in July; that August 2026 came in above July 2026 (17.14 °C) is itself unusual, and reflects how much warmth the developing El Niño added over the course of the summer.
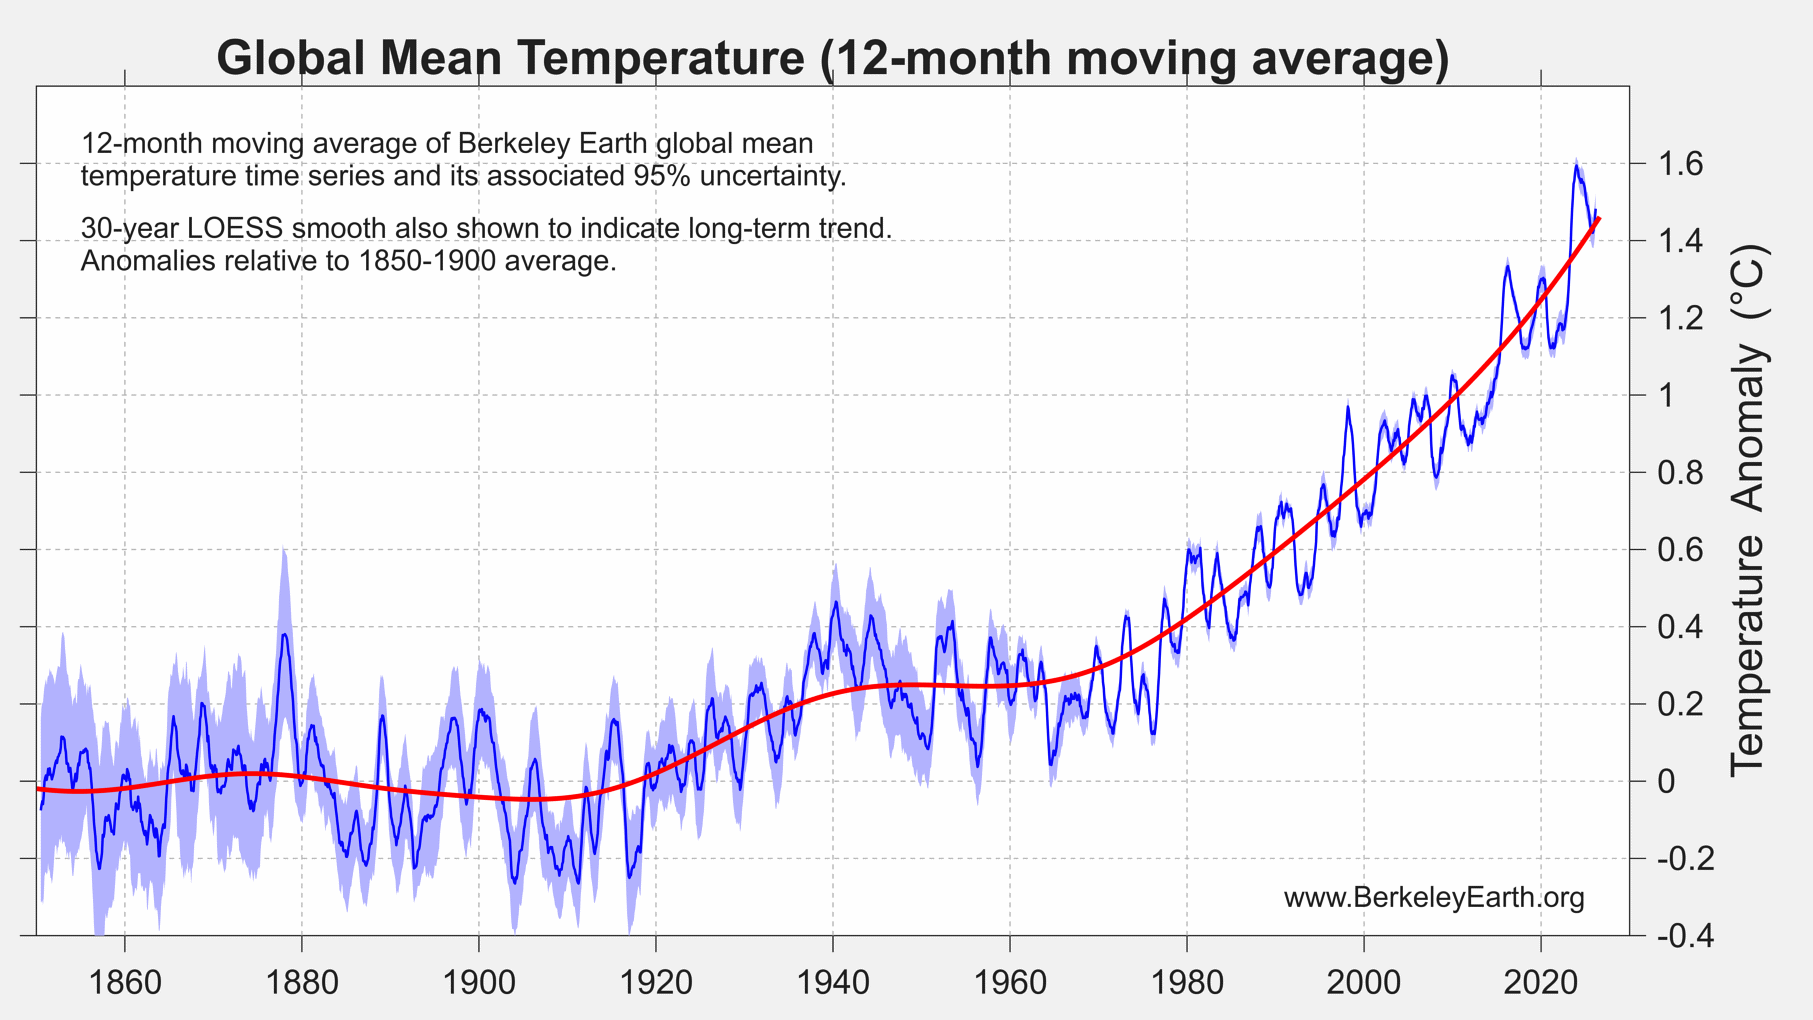
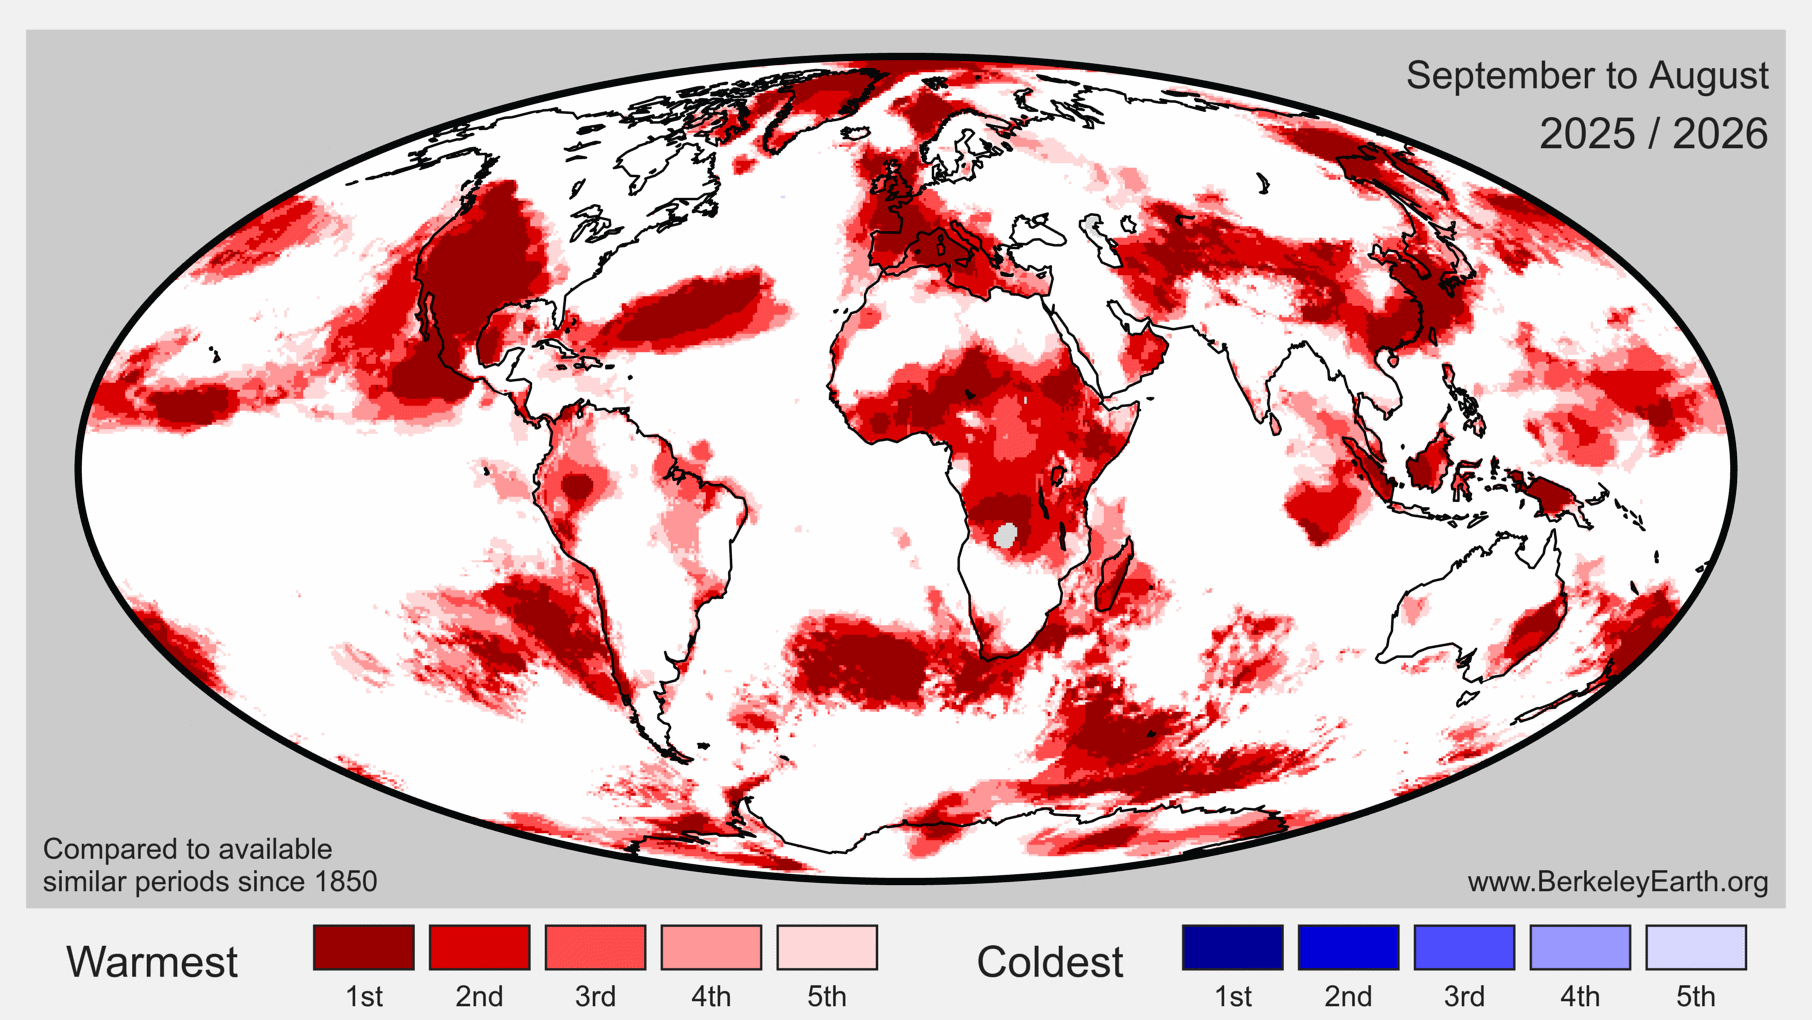
Over the most recent 12 months (September 2025 to August 2026), the global average was 1.482 ± 0.074 °C (2.67 ± 0.13 °F) above the 1850–1900 average, making it the 3rd warmest such 12-month period on record, behind the equivalent periods ending in 2024 and 2025. The 12-month moving average had been running close to the long-term trend line, and is now being pushed upward again by the strengthening El Niño. Because an El Niño takes months to express itself fully in the global mean, this measure is expected to continue rising into 2027.
Spatial Variation
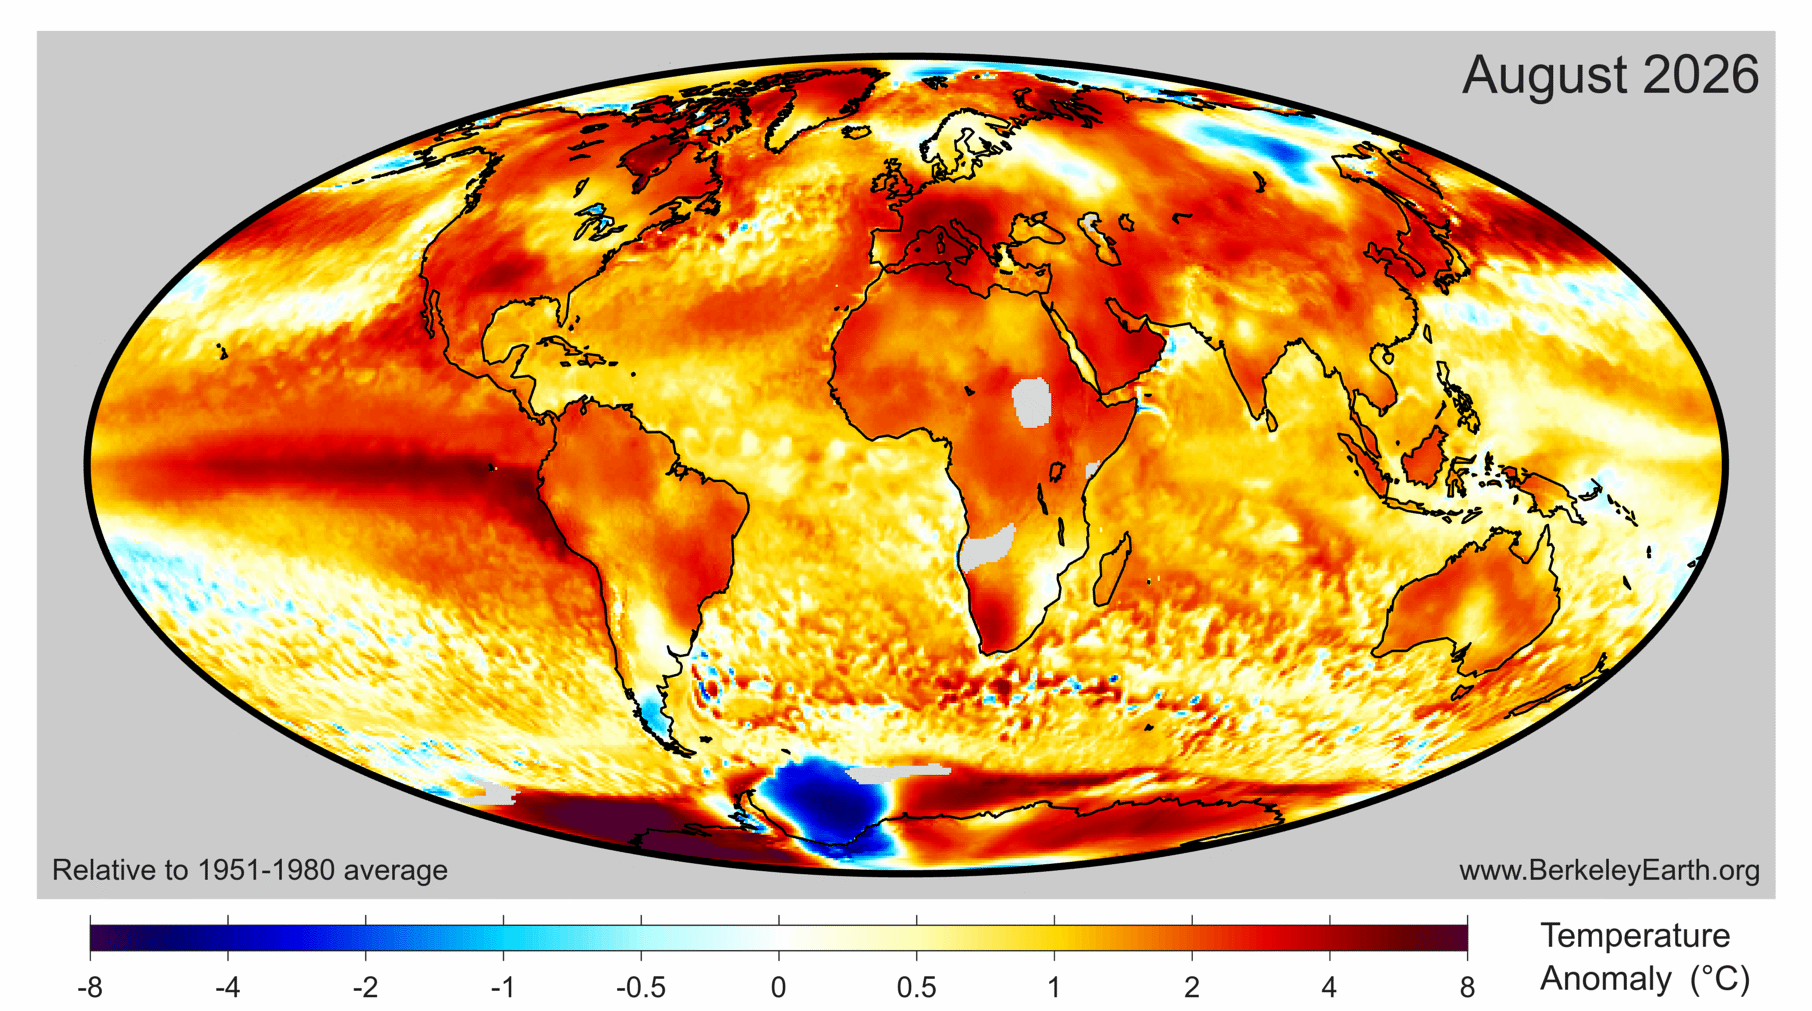
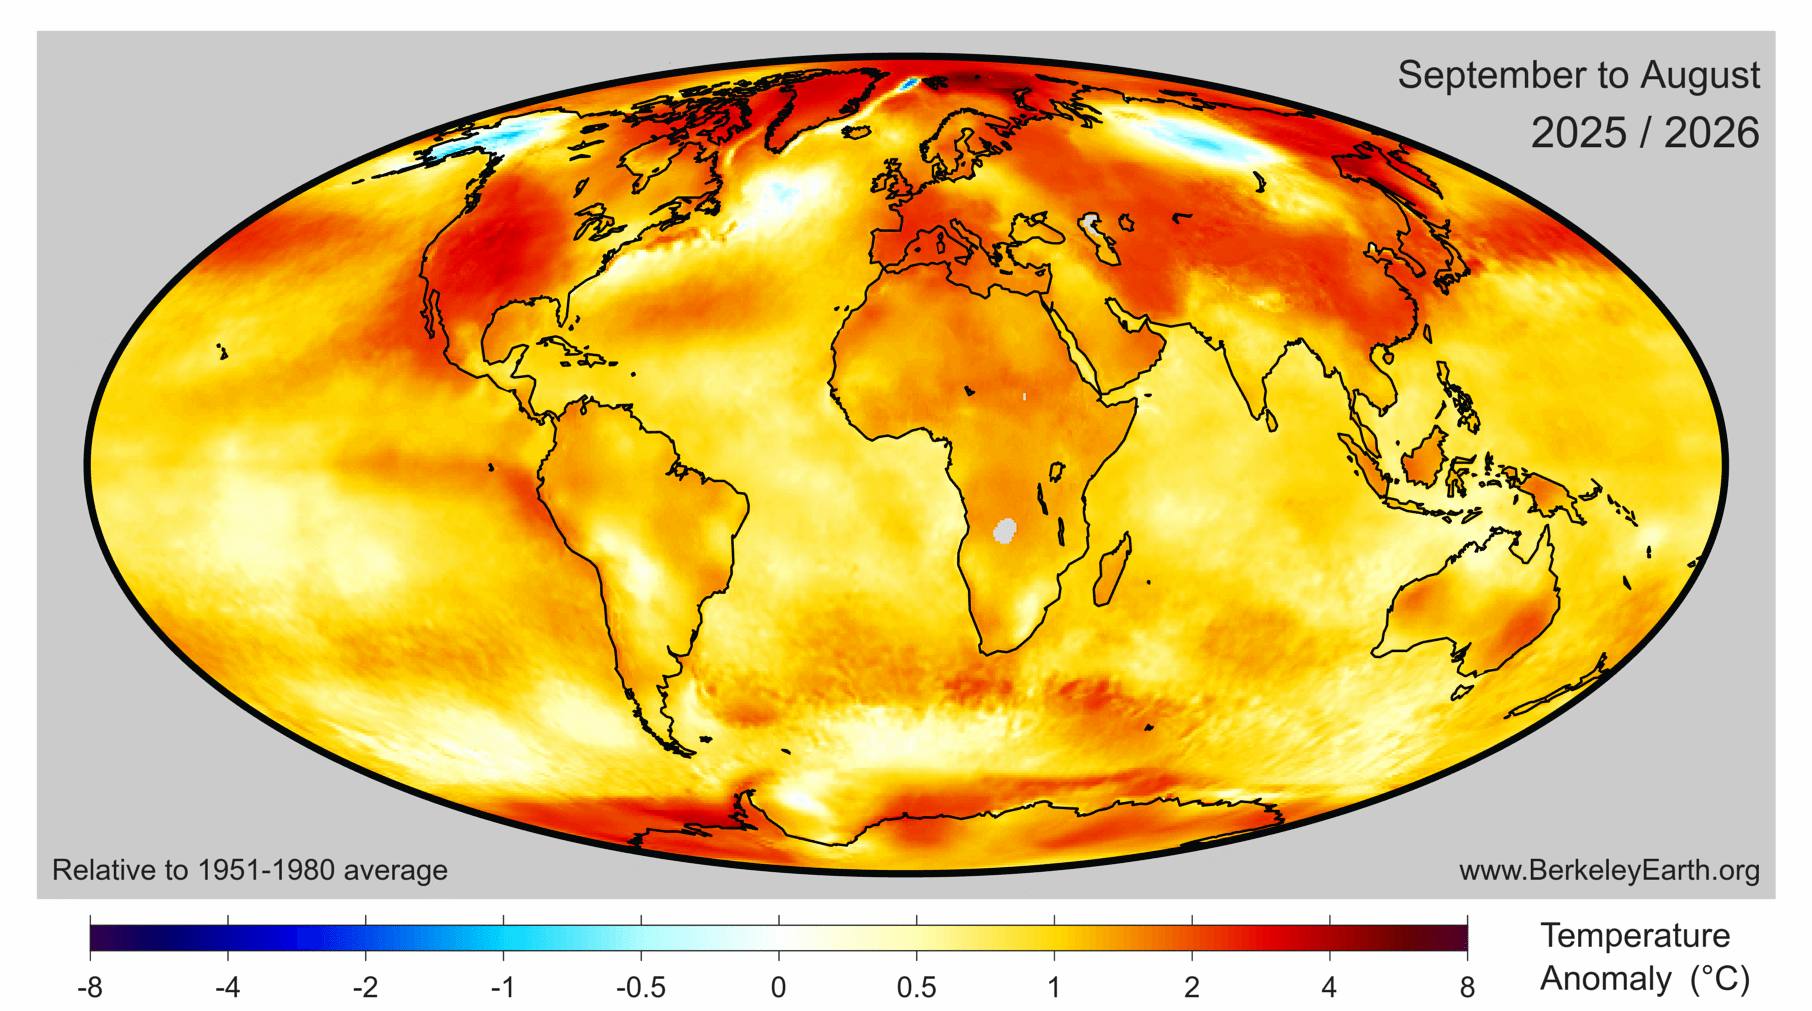
In August 2026, warmer-than-average temperatures covered nearly the entire globe. The warmth was most pronounced across the central and eastern equatorial Pacific, where the developing El Niño now appears as an unbroken warm tongue spanning much of the basin, and across the Arctic, Greenland and northern Canada. Large positive anomalies also extended across North Africa and the Sahara, the Arabian Peninsula and the Middle East, the Mediterranean and southern Europe, western Russia and Siberia, and East Asia. The most prominent cool anomaly was a well-defined patch along the Antarctic coast, with only small cool areas elsewhere, including part of the Siberian Arctic.
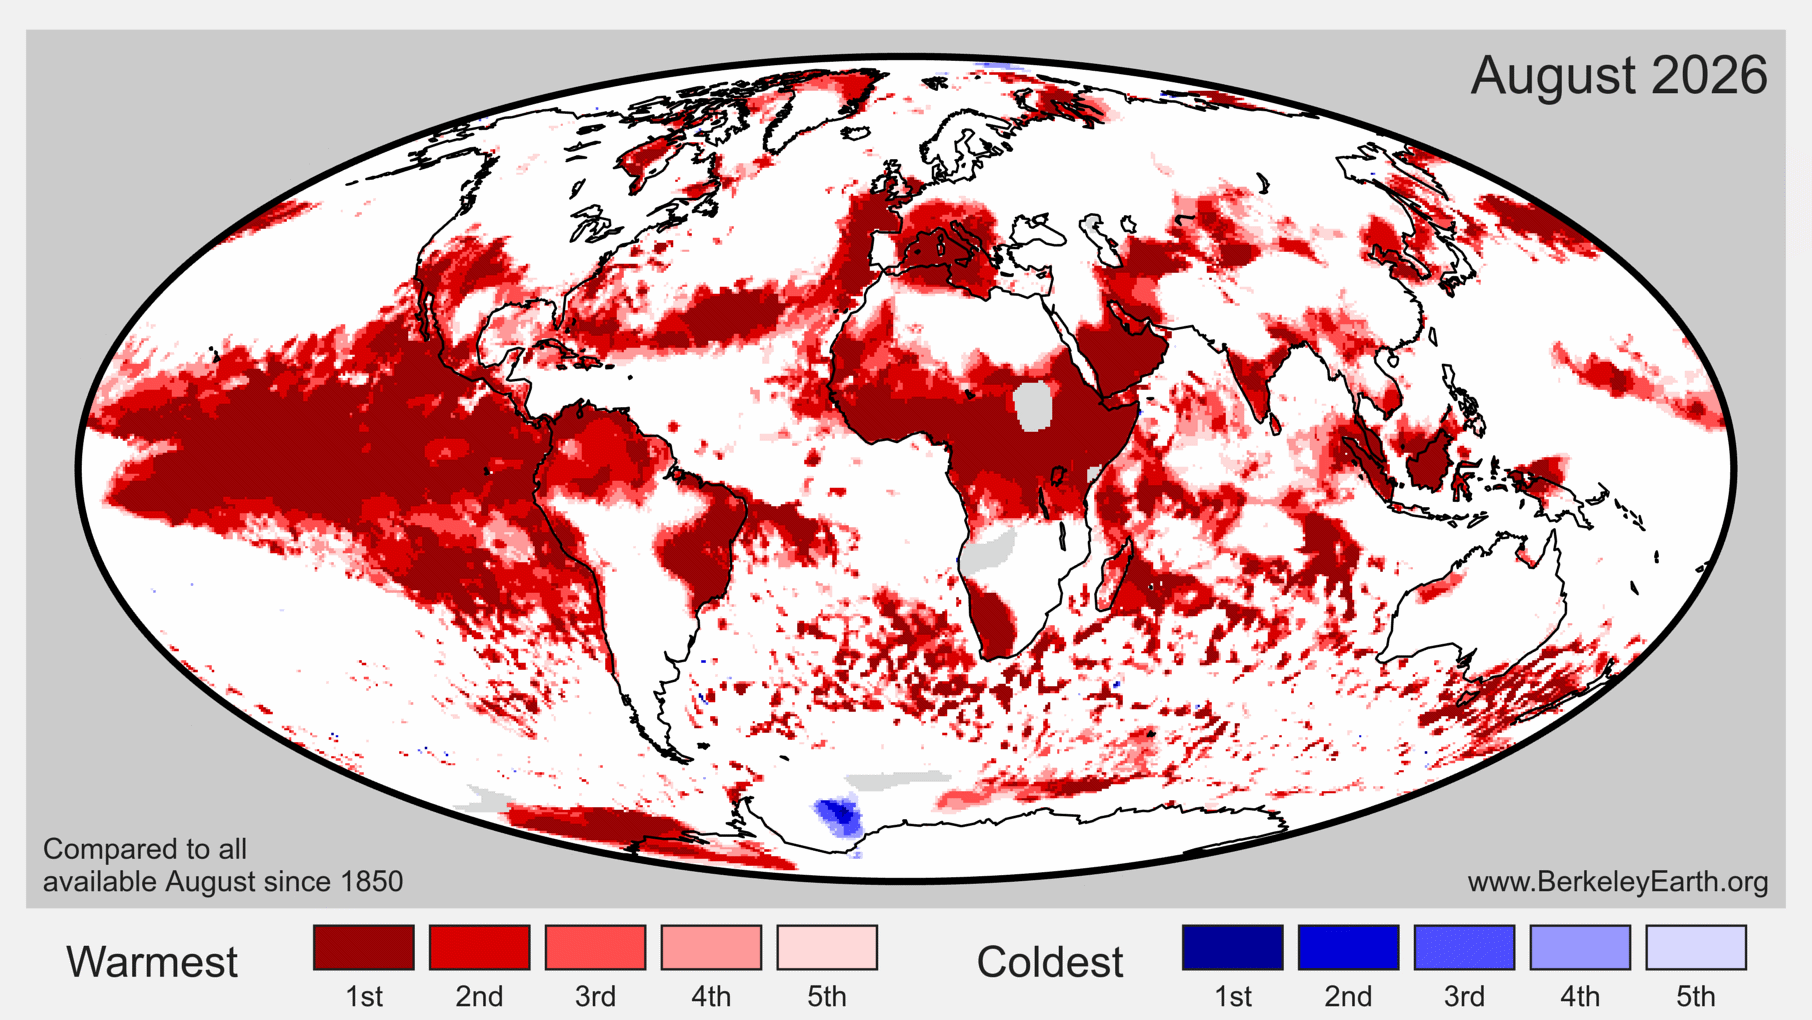
Roughly 10.2% of Earth’s surface experienced its locally warmest August on record (about 9.1% of land and 10.7% of ocean surfaces). Record warmth was concentrated across a broad swath of the tropical Pacific, the Sahara and Sahel, the Arabian Peninsula and the Middle East, the central Mediterranean, Southeast Asia, parts of southern Africa, northern South America, and the Caribbean and Gulf of Mexico.
Near-record cold for August was limited to a small portion of sea ice region around Antarctica.
We further estimate that 75 countries set monthly records for August average temperature: Albania, Andorra, Antigua and Barbuda, Bahrain, Barbados, Benin, Bosnia and Herzegovina, Brunei, Burkina Faso, Burundi, Cabo Verde, Cameroon, Central African Republic, Chad, Croatia, the Democratic Republic of the Congo, Djibouti, Dominica, El Salvador, Equatorial Guinea, Eritrea, Ethiopia, Gabon, the Gambia, Ghana, Grenada, Guatemala, Guinea, Guinea-Bissau, Guyana, Haiti, India, Indonesia, Iran, Italy, Ivory Coast, Jamaica, Kenya, Kuwait, Liberia, Malaysia, Mali, Malta, Mauritania, Mauritius, Mexico, Montenegro, Namibia, Nicaragua, Nigeria, Oman, Panama, Qatar, the Republic of the Congo, Rwanda, Saint Kitts and Nevis, Saint Lucia, Saint Vincent and the Grenadines, Saudi Arabia, Senegal, Serbia, Seychelles, Sierra Leone, Singapore, Sudan, São Tomé and Príncipe, the Bahamas, Togo, Trinidad and Tobago, Tunisia, Turkmenistan, Uganda, the United Arab Emirates, the United States of America, and Yemen.
In addition, continent-wide August average records were set for Africa and North America.
The national records cluster by region. The largest margins over the previous record were in the Arabian Peninsula and the Horn of Africa — the United Arab Emirates exceeded its previous August record by 1.51 °C, Djibouti by 1.38 °C and Eritrea by 1.24 °C — with further concentrations across West and Central Africa, Southeast Asia, the Mediterranean and the Caribbean. Margins of this size are unusual for national monthly averages, which typically advance by a few tenths of a degree at a time.
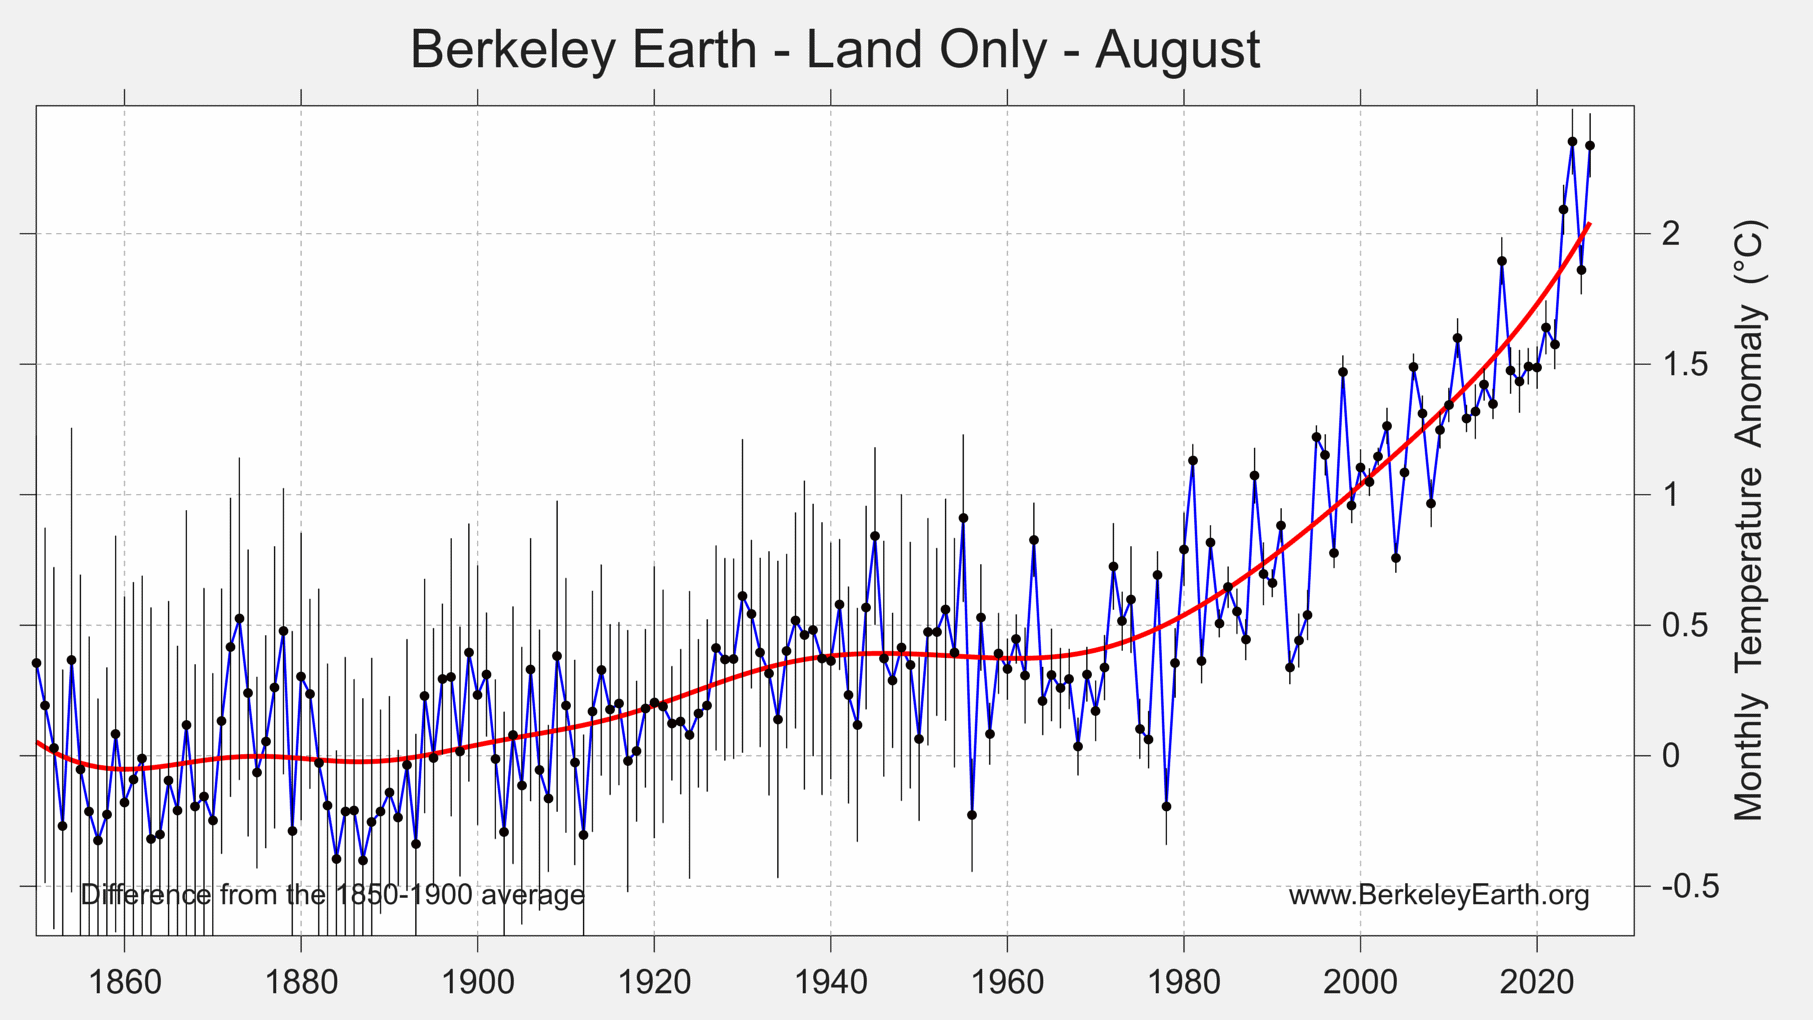
Over land regions, August 2026 was nominally the 2nd warmest August since 1850, with a terrestrial average of 2.34 ± 0.16 °C (4.21 ± 0.29 °F) above the 1850–1900 average. It is effectively tied with August 2024, from which it differs by far less than the uncertainty in either value. As has been the pattern through 2026, the land average is less exceptional than the ocean average: it remains close to the long-term trend line and has not moved decisively toward new records this year.
The oceans are where August 2026 was most remarkable. Average ocean temperatures were 1.296 ± 0.097 °C (2.33 ± 0.17 °F) above the 1850–1900 average — nominally not merely the warmest August on record for ocean surfaces, but the warmest single month of any kind in the entire ocean record, ranking 1st of 2120 months. It stands narrowly ahead of August 2023, the previous highest August value. Ocean temperatures have risen steadily as El Niño has developed in the equatorial Pacific, and with the event still strengthening, further records are likely in the months ahead.
For the year so far, January to August 2026 averaged 1.489 ± 0.081 °C (2.68 ± 0.15 °F) above the 1850–1900 average, the 2nd warmest such period on record.
Exceptional National Records
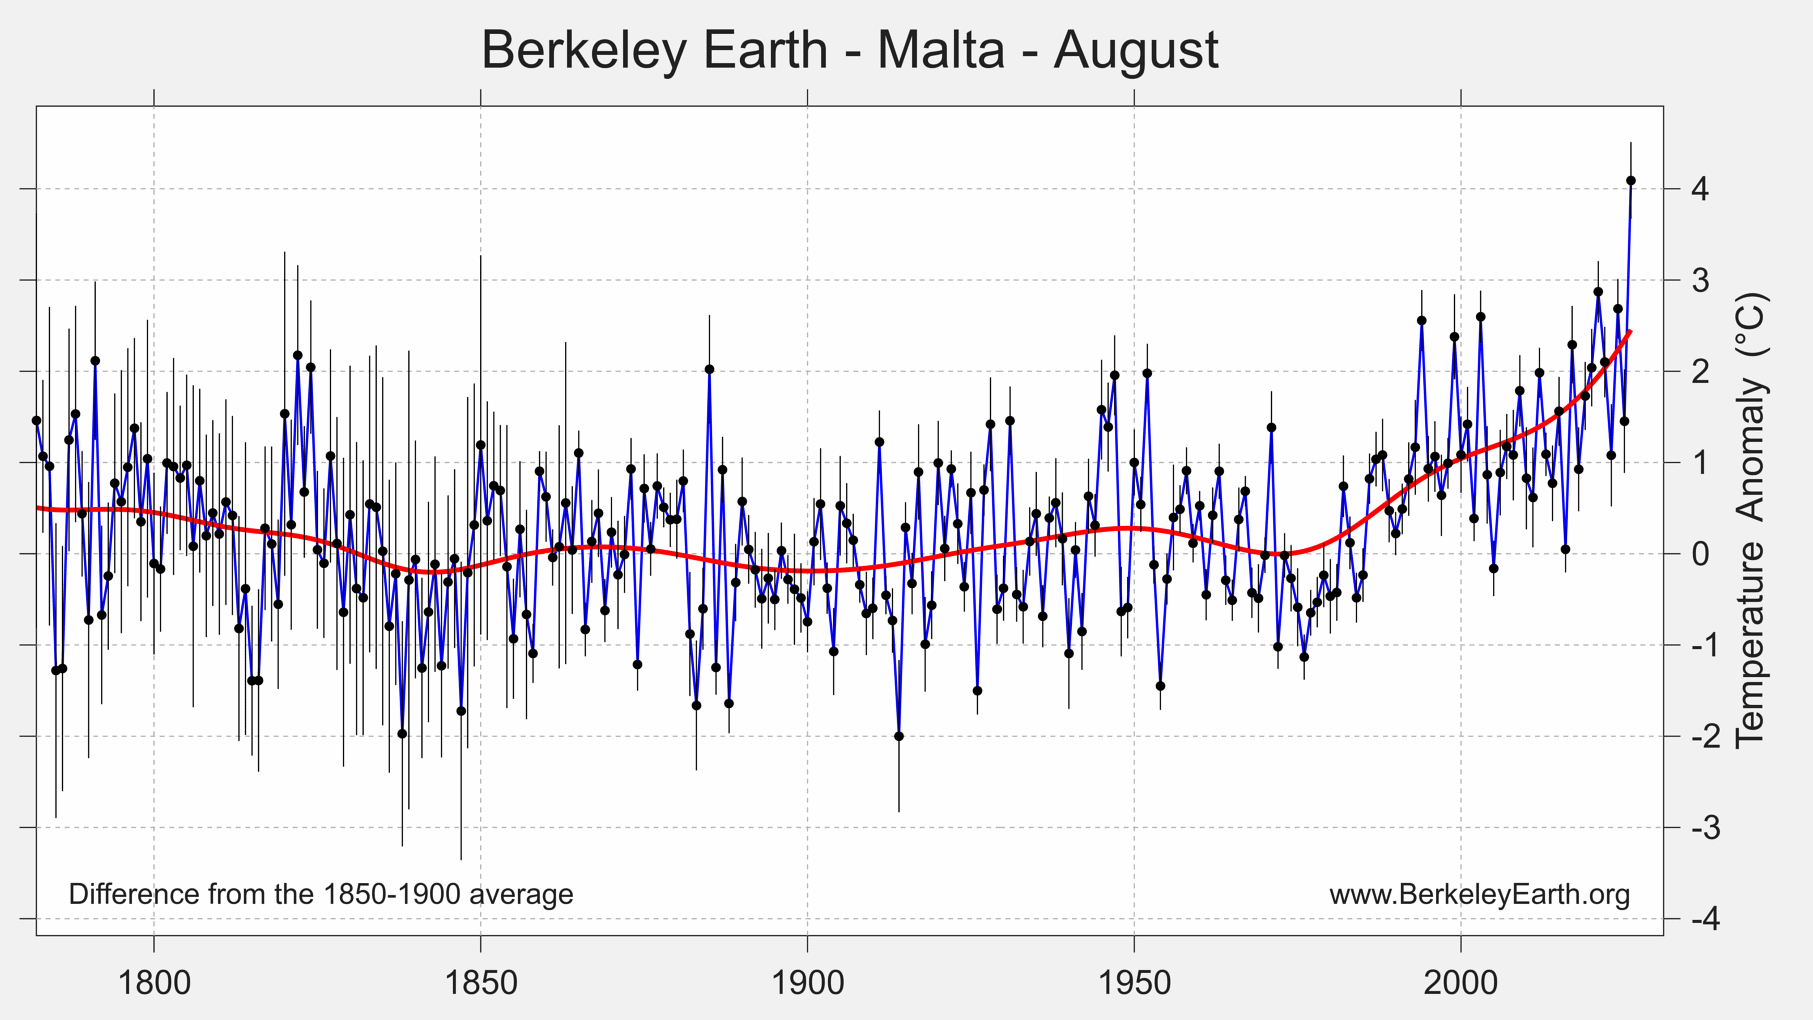
Of the 75 countries setting a new August record, 22 did so by more than 0.5 °C — an unusually large step for a national monthly average, which more often advances by a few hundredths or tenths of a degree. The largest margins were the United Arab Emirates by 1.51 °C, Djibouti by 1.38 °C, Eritrea by 1.24 °C, Malta by 1.22 °C, and Brunei by 1.07 °C.
Malta in the Mediterranean is particularly noteworthy for blasting past the previous August record, set in 2021, and setting a dramatic record for a well-instrumented location with over two centuries of observations.
The most extreme records cluster by region: the Persian Gulf and Arabian Peninsula, the Horn of Africa, West Africa from Sierra Leone through to Cameroon, maritime Southeast Asia, and the central Mediterranean. The concentration in tropical and subtropical countries is consistent with the pattern of the month as a whole, where record warmth was widespread across the tropics. Widespread warmth across tropical land areas s a typical signature of the non-local effects that arise during a very strong El Nino event.
Seasonal Results (June – August)
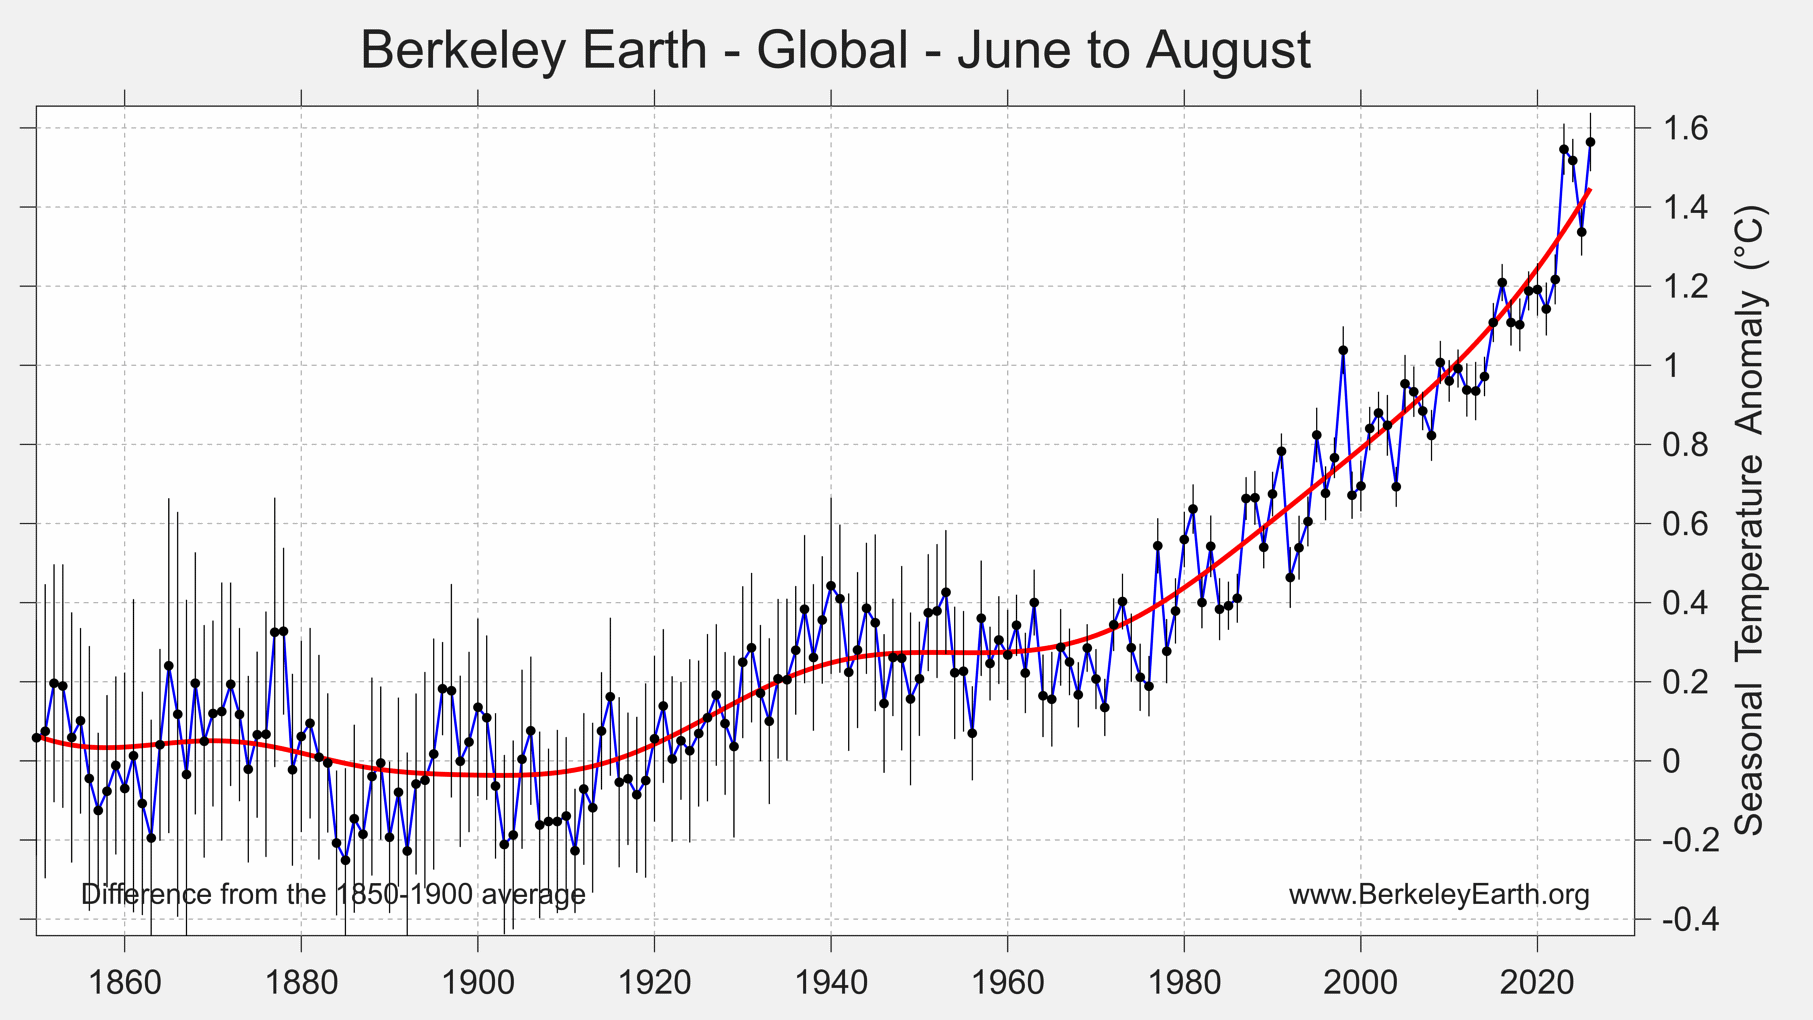
With August complete, the Northern Hemisphere summer — the June to August season — was nominally the warmest such period on record, at 1.564 ± 0.097 °C (2.82 ± 0.17 °F) above the 1850–1900 average. The margin is slim: the equivalent periods in 2023 and 2024 sit within the uncertainty, and the ranking should be read as a narrow lead.
Over land, June to August averaged 2.09 ± 0.15 °C (3.76 ± 0.28 °F) above the 1850–1900 average, the 2nd warmest such period, behind the same season in 2024. Over the oceans it was 1.240 ± 0.081 °C (2.23 ± 0.15 °F) above the 1850–1900 average, nominally the warmest June to August on record for ocean surfaces.
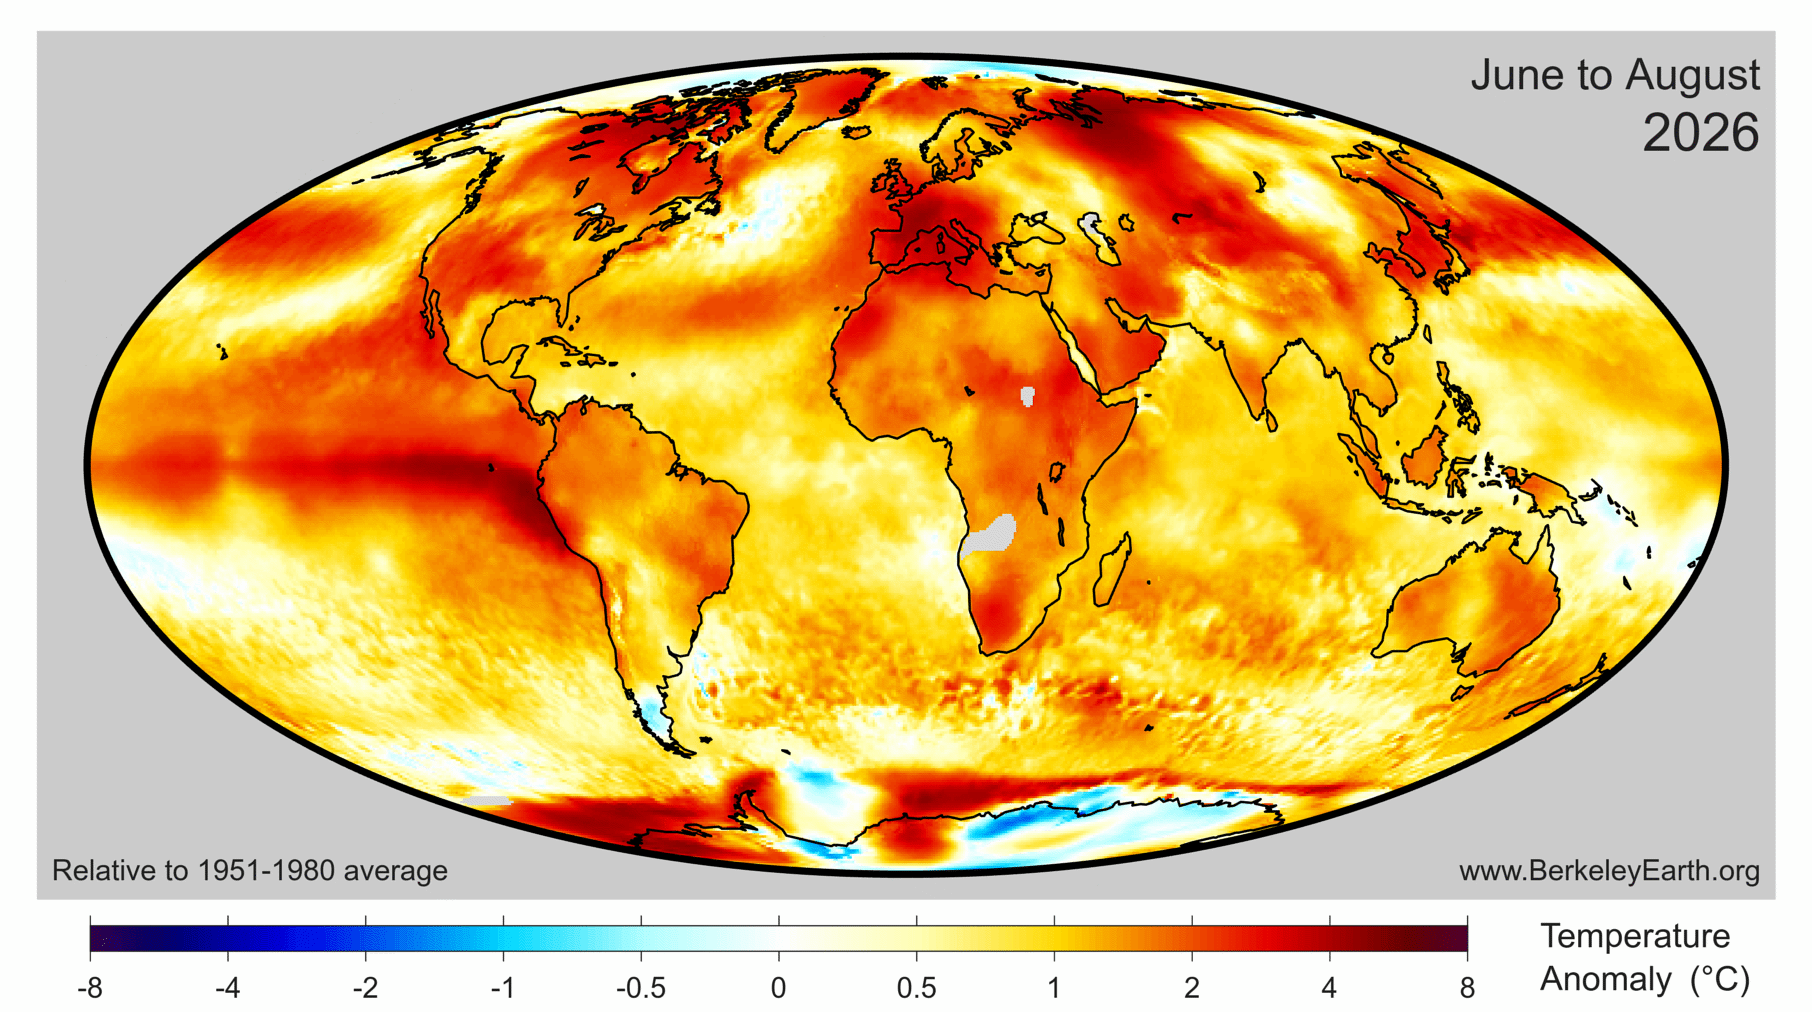
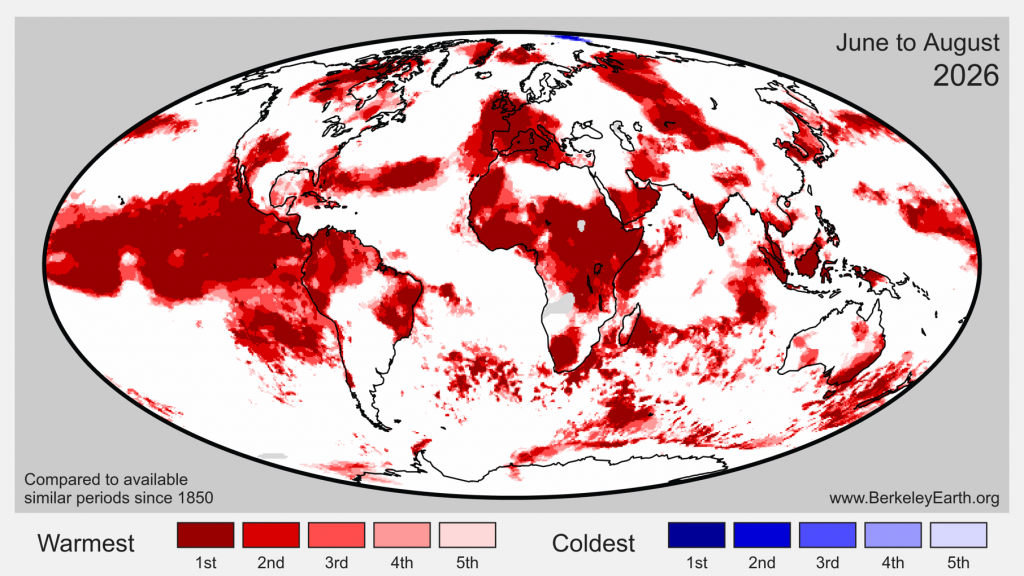
Across the season, 10.5% of Earth’s surface saw its warmest June to August on record and 82% was warmer than average, while only 3.6% was cooler than average. The pattern of record warmth was broadly similar to that of August alone, though more of it fell on land: 12.9% of land area set a seasonal record, against 9.26% of the ocean.
We estimate that 69 countries set records for their June to August average temperature, and continent-wide seasonal records were set for Africa and North America. The seasonal list is not the same as the monthly one — a country can set a seasonal record without setting a monthly one, and the reverse: Andorra, Austria, Belgium, Benin, Brunei, Burkina Faso, Burundi, Cambodia, Central African Republic, Chad, Colombia, Costa Rica, Cuba, the Democratic Republic of the Congo, Djibouti, Ecuador, El Salvador, Equatorial Guinea, Eritrea, Ethiopia, France, the Gambia, Ghana, Guinea, Guinea-Bissau, Honduras, Indonesia, Ireland, Italy, Ivory Coast, Jamaica, Liberia, Luxembourg, Malaysia, Mali, Malta, Mauritania, Mauritius, Morocco, the Netherlands, New Zealand, Nicaragua, Niger, Nigeria, Oman, Panama, Peru, Rwanda, Senegal, Sierra Leone, Singapore, South Africa, Spain, Sri Lanka, Switzerland, the Bahamas, Togo, Trinidad and Tobago, Tunisia, Uganda, the United Arab Emirates, the United Kingdom, Tanzania, the United States of America, Venezuela, Vietnam, Western Sahara, Yemen, and Zambia.
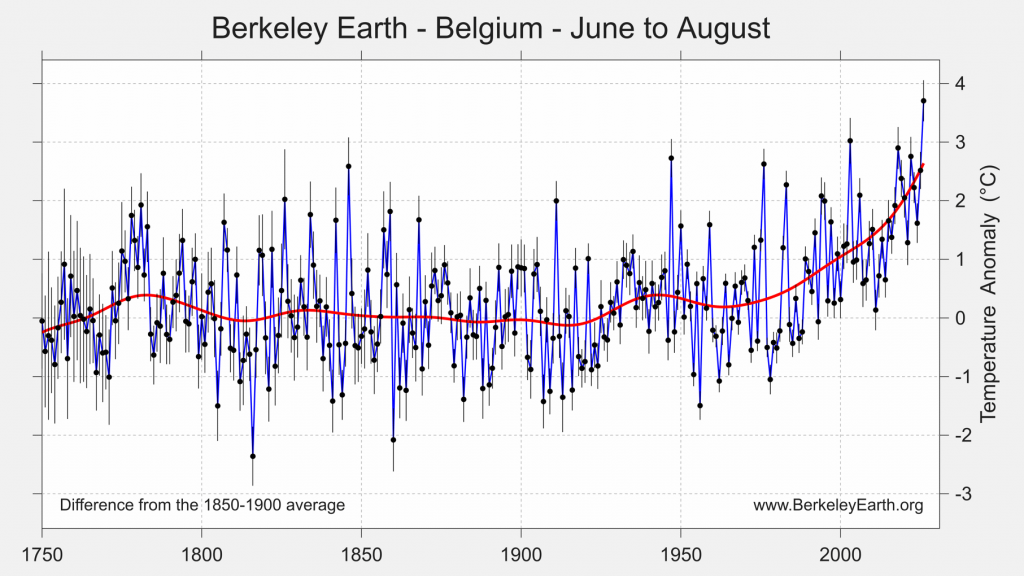
The most striking pattern in that list is Western Europe. France, Spain, Italy, the United Kingdom, Ireland, the Netherlands, Belgium, Luxembourg, Switzerland, Austria and Andorra all recorded their warmest June to August on record, in series that for several of these countries extend back to the eighteenth century. Germany and Portugal fell just short, each ranking 2nd. Taken together this was an exceptional European summer, and a notably broader signal than the monthly records for August alone, where only Italy and Malta appear.
Exceptional Seasonal Records
The same pattern holds for the season. Of the 69 countries setting a June to August record, 15 exceeded their previous best by more than 0.5 °C, led by: Eritrea by 0.88 °C, Djibouti by 0.85 °C, Malta by 0.80 °C, Western Sahara by 0.79 °C, and Belgium by 0.68 °C.
The Horn of Africa and the central Mediterranean appear again, but the seasonal list also brings in Western Sahara and Mauritania, and two European countries — Belgium and Andorra — that do not appear among the largest monthly margins. Eritrea set the largest seasonal margin at 0.88 °C, having also ranked third among the August monthly margins.
The Nepal–Tibet Glacier Collapse
On the morning of 26 August, part of a glacier and underlying rockface on Langtang Lirung in Nepal broke away and fell some 1,200 meters into the valley below, gathering rock and sediment as it descended. The resulting debris flow travelled roughly 100 kilometers down the river valleys shared by Nepal and Tibet. More than 1,450 people were killed and around 5,800 remain missing more than a month later; Nepali authorities have estimated the economic cost at $4.7 billion. The collapse released enough energy to generate a seismic signal equivalent to a magnitude 5.2 earthquake.
Whether this disaster can be attributed to climate change is a question that deserves care. What can be said with certainty is that the mountain on which it happened has been warming for decades, and that the present disaster occurred during one of the hottest weeks in one of the hottest years on record for this site and elevation.
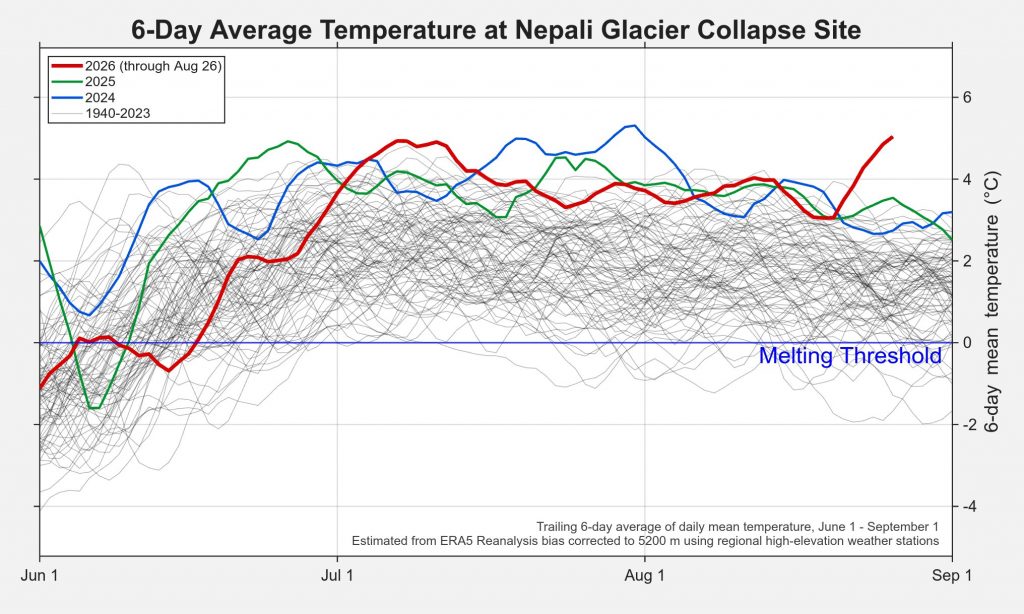
At the 5200 m elevation at which the landslide occurred, the summer air temperatures had warmed from only just above freezing in the mid-20th century to having long periods of melting every summer.
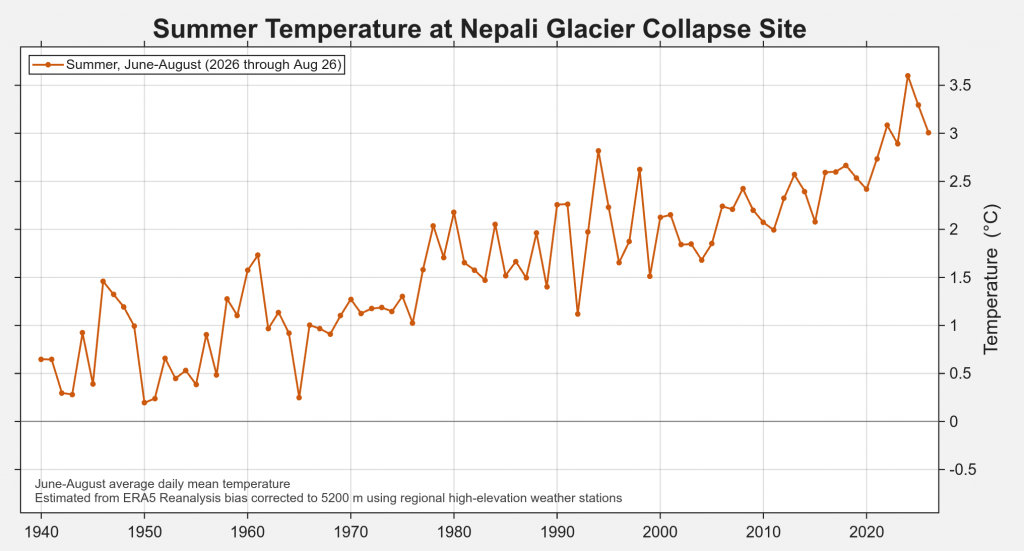
That warming led to a dramatic increase in melting potential at this location, which has surged in recent years.
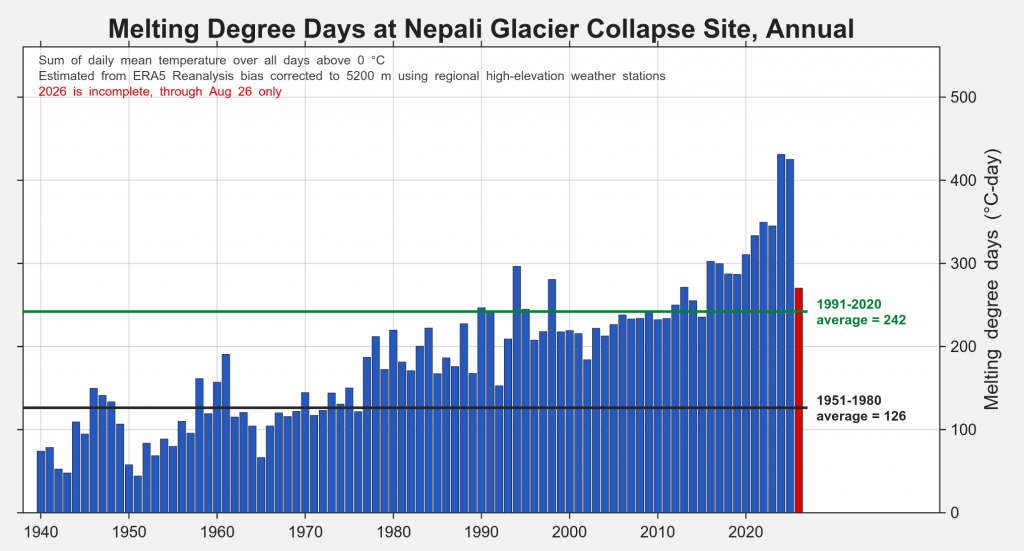
At these elevations, permafrost often acts like a glue to seal cracks and stabilize the underlying rock. As a result, permafrost thawing can weaken the rock. Similarly, meltwater intrusion and shifting glacial loads are known risk factors for triggering fracturing in underlying rock. Such features have been observed at other sites where ice-rock avalanches have occurred.
However, the climate evidence remains circumstantial. We know that the permafrost thawing and glacial melting associated with local warming can increase the risks of slope failure, but it remains unproven whether that actually occurred in the specific case of the Nepali disaster. More definitive conclusions will likely have to await further on-site study of the collapsed region.
Looking at the totality of the circumstances, our assessment is that global warming likely contributed to the Nepali disaster, though more definitive evidence is needed to be conclusive.
ENSO Conditions
The El Niño that emerged in the spring has continued to intensify through the Northern Hemisphere summer. The August Niño 3.4 index averaged close to +2.6 °C, slightly below what models had projected after a plateau lasting much of the month, before resuming its climb in early September following a series of westerly wind bursts. Daily values have now reached record high levels exceeding any previous year since at least 1940. Such record highs are occurring months before the typical El Niño peak.
Adjusting for the ongoing changes in the global mean ocean temperature, the warming in the Central Pacific Niño3.4 region appears less extreme and more similar to other very strong El Niño events. With that adjustment, the present conditions are still record warm for this time of year, but not an all-time record.
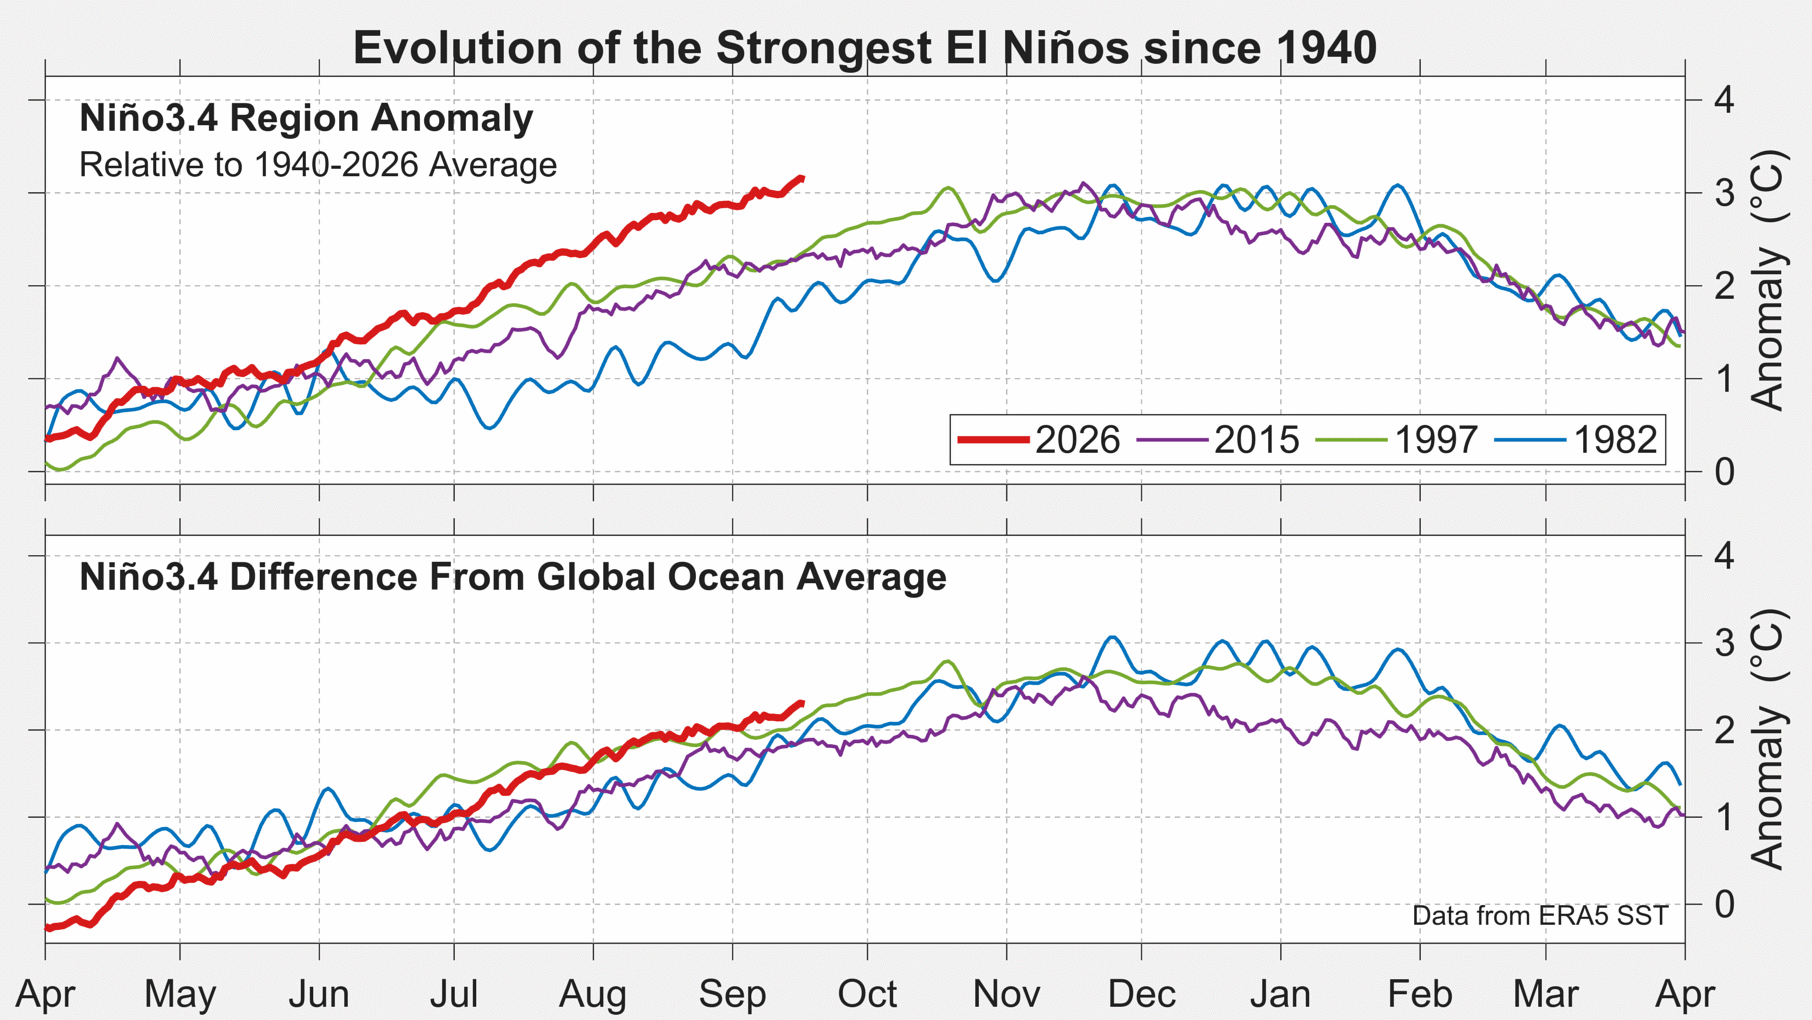
Even after adjusting for the more than +1 °C increase in the mean temperature of the ocean, the monthly average in August is nearly +2 °C, which is the threshold for a very strong (or “super”) El Niño. Temperatures are expected to continue to climb higher until peaking between November and January.
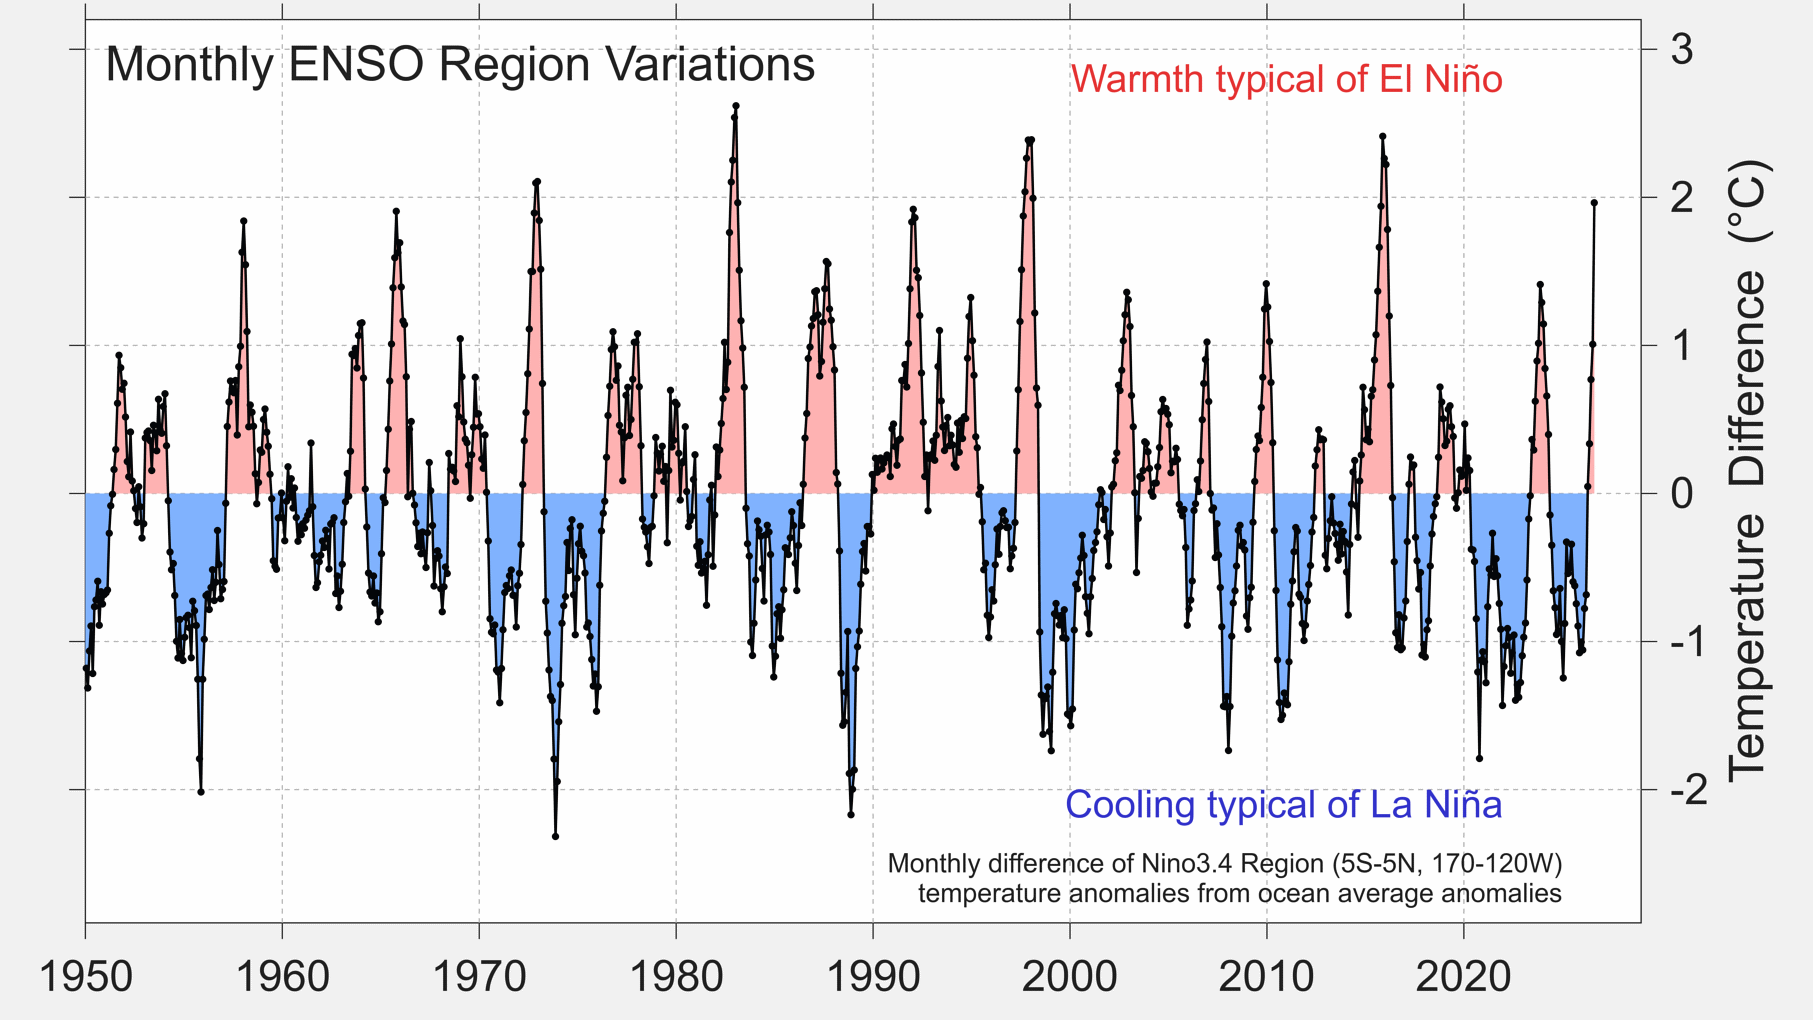
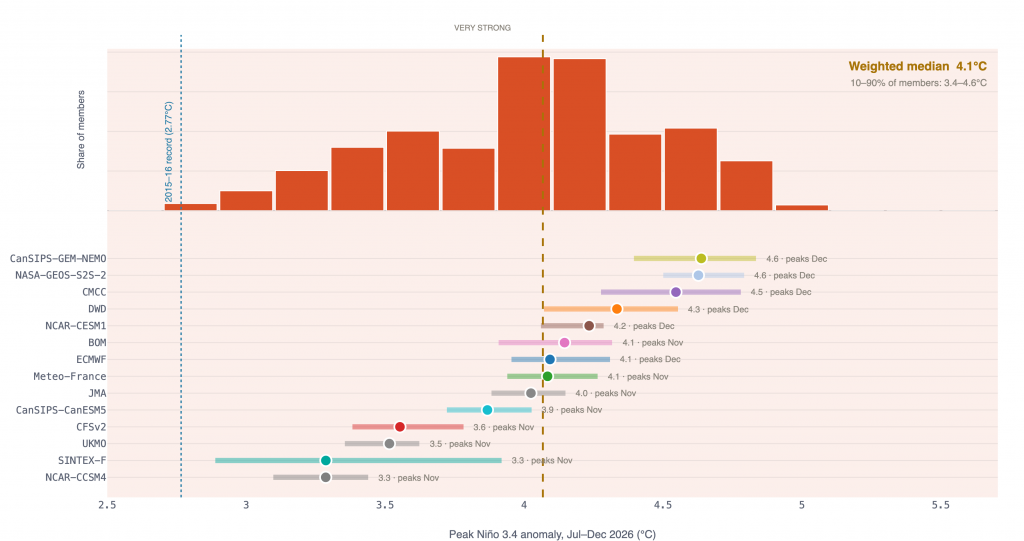
Forecasters now regard a record-strength event as close to certain. With the September runs of the dynamical models complete, every model in the ensemble projects a record event on the conventional Oceanic Niño Index, and roughly a 98% chance of a record on the relative Oceanic Niño Index, which adjusts for the background warming of the tropical oceans. The event is expected to peak between November and January.
The median forecast across 14 seasonal forecasting model suggest that this El Niño may peak at just over +4 °C above normal in the Central Pacific, which would be more than a whole degree C larger than the previous record.
Seasonal forecasting models and past very strong El Niño events provide some guidance on the impacts to expect, shown on the chart below. In addition to boosting global mean temperatures the extreme El Niño is expected to have far reaching effects, particularly by altering atmospheric circulation patterns and changing the distribution of rainfall. Past very strong El Niño events have exposed some regions to heavy rains or flooding, while leaving others with drying and drought conditions.
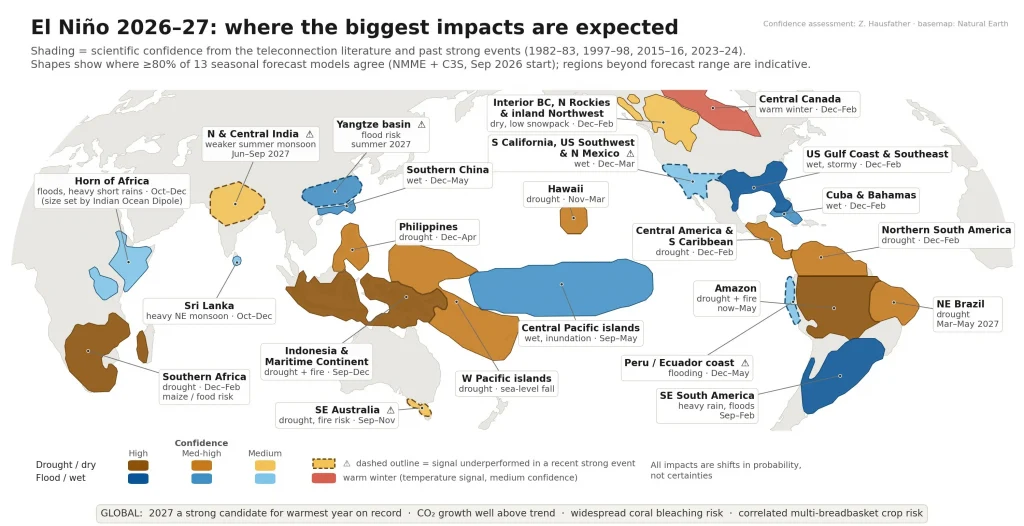
Because the global-average temperature response typically lags the peak in the central Pacific by several months, much of this event’s warming influence is expected to carry into 2027. For more information, see NOAA’s Climate Prediction Center report\ and our discussion at The Climate Brink.
2026 Outlook
With eight months of data in hand, a record annual average for 2026 now looks probable. We calculate roughly a 93% chance that 2026 will become the warmest year on record, up from about 69% in the July update and 12% in June — a rapid shift driven by the strengthening El Niño and the exceptional ocean warmth of recent months. The most likely alternative is a 2nd-place finish, at about 7%. We estimate the 2026 annual average is all but certain to exceed 1.5 °C (2.7 °F) above the 1850–1900 average, with a likely annual range of roughly 1.536–1.642 °C. As always, because El Niño’s global impact lags its Pacific peak, a further substantial warming influence is expected in 2027.
| Estimated probability of 2026 annual final ranking | Likelihood |
|---|---|
| Warmest year on record (1st) | ~93% |
| 2nd warmest | ~7% |
| 3rd warmest or lower | <1% |
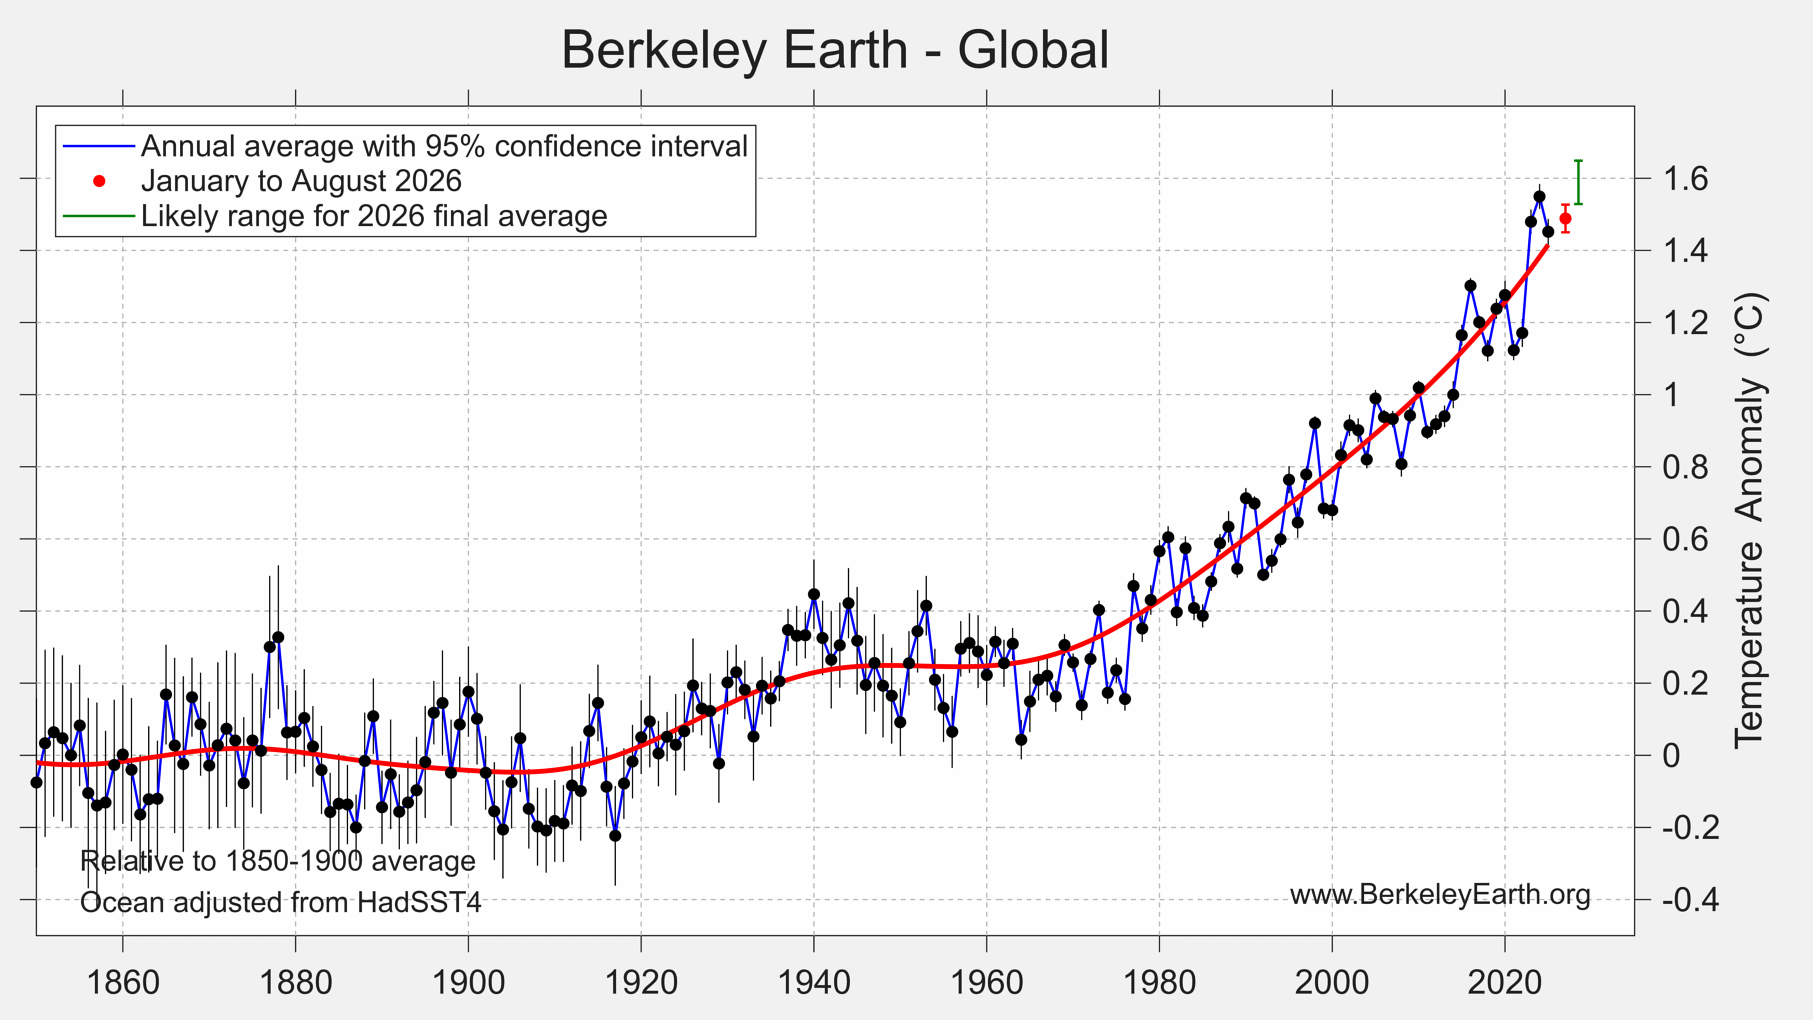
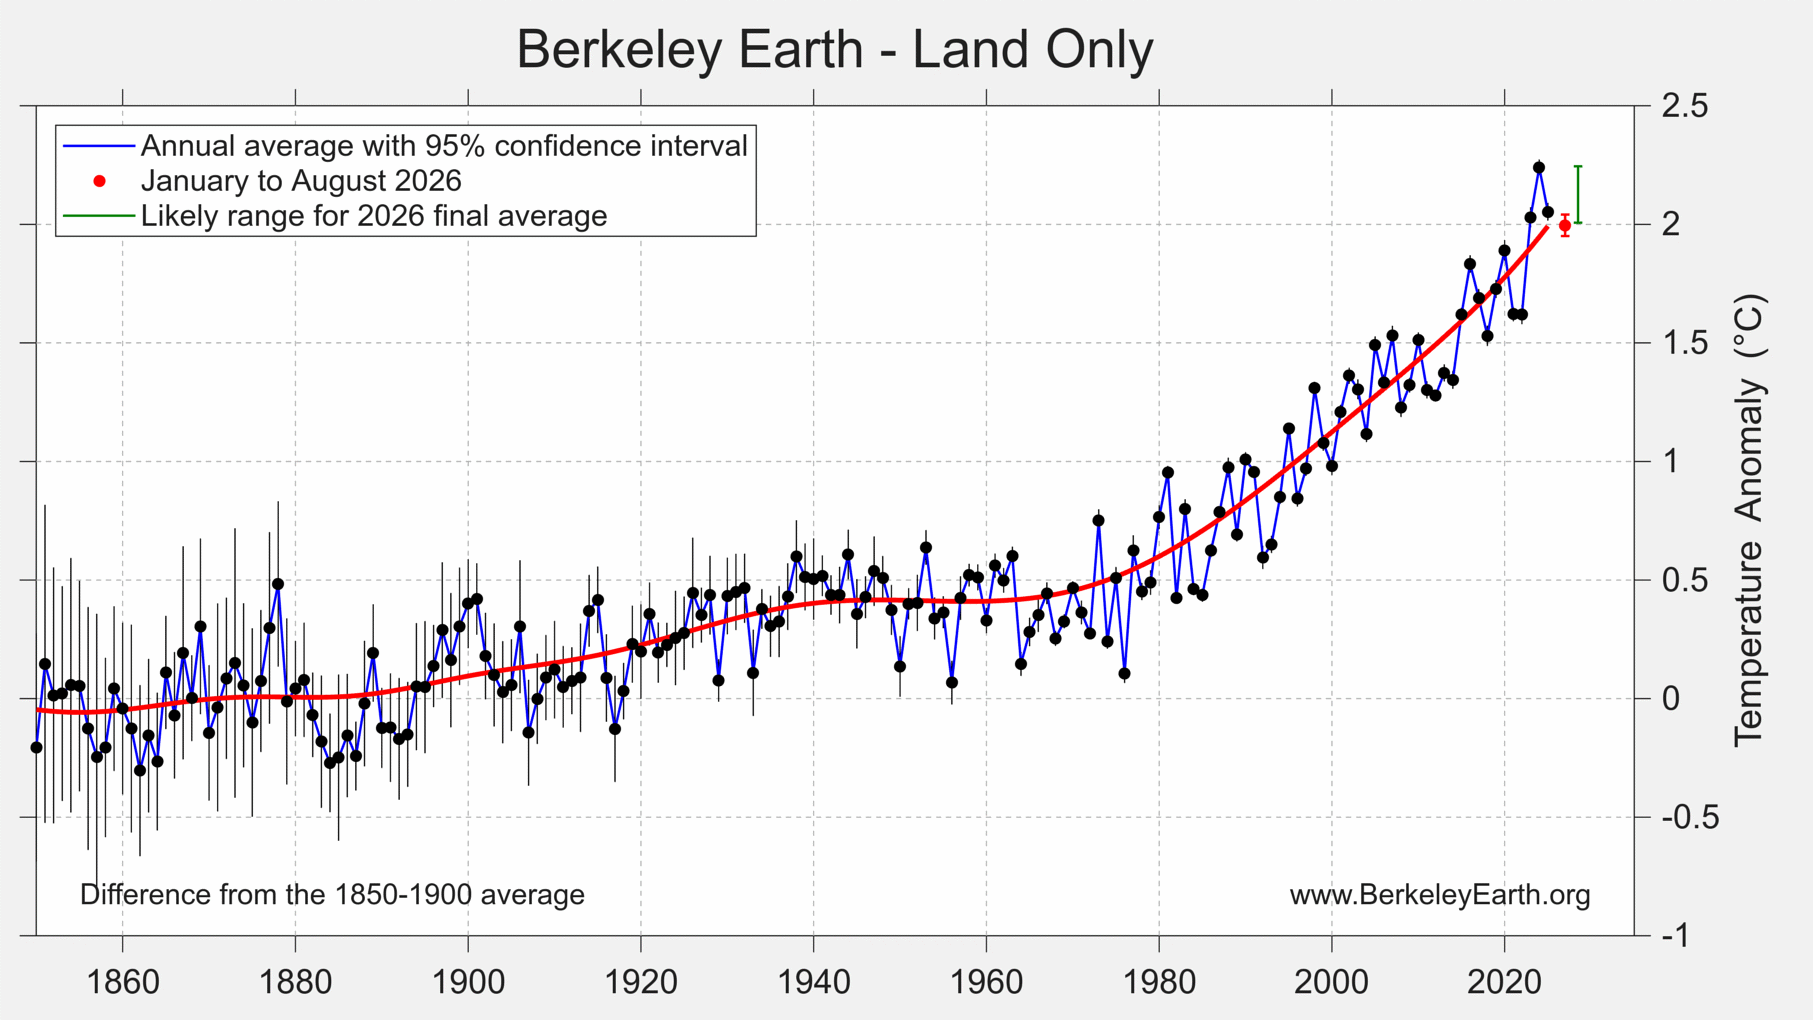
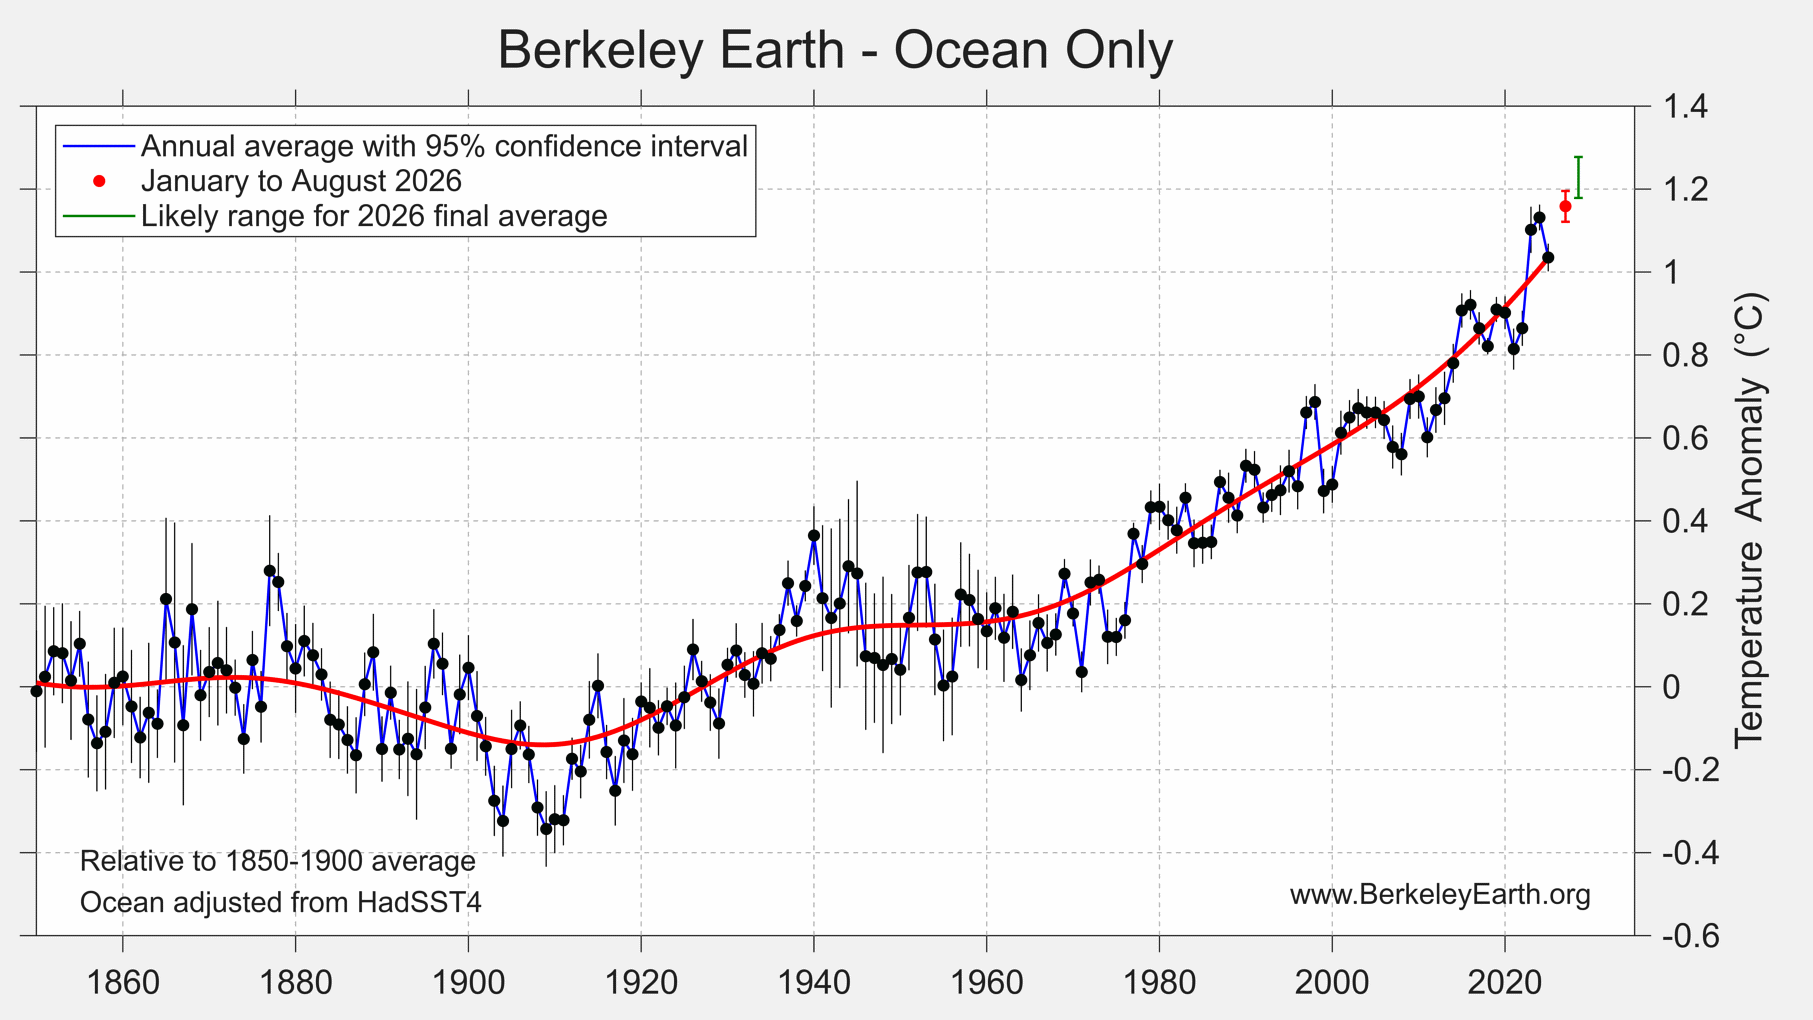
The divergence between ocean and land that we noted last month has grown sharper. For the oceans, a record annual average in 2026 is now effectively certain. On land the picture is quite different: we estimate only about a 2.5% chance of a record annual average, with a 2nd-place finish behind 2024 the most likely outcome at roughly 87%. The cool start to 2026 over land has left a deficit that the expected El Niño warming does not appear sufficient to close within the calendar year.
Methodology and Data
This analysis uses the Berkeley Earth high-resolution land temperature field combined with a reinterpolated version of the UK Met Office Hadley Centre’s HadSST4 sea surface temperature data. The land component draws on 22,477,539 monthly-average temperature observations from 53,416 weather stations; the ocean component draws on 506,431,237 HadSST4 measurements collected by ships and buoys. The combined field is produced at 0.25° × 0.25° resolution. Where sea ice is present, temperature anomalies are extrapolated from land-surface air temperatures rather than from the water beneath the ice.
HadSST4 is frequently delayed by one or more months relative to surface weather station data. Where the most recent months are not yet covered by HadSST4, the ocean field is extended using ERA5 sea surface temperatures, bias-corrected against HadSST4 over their common period from 1980 onward. The correction is computed separately for each calendar month and each grid cell, and an additional uncertainty term derived from the residual scatter between the two datasets is carried through into the reported uncertainties. For this report, the HadSST4 component was last updated on 13-Aug-2026, so August 2026 ocean temperatures rest on the bias-corrected ERA5 extension rather than on ship and buoy observations for the month itself. These values are revised as HadSST4 catches up.
Uncertainties quoted throughout are 95% confidence intervals. They arise from the incomplete spatial coverage of historical weather observations, from noise in measurement devices, and from biases introduced by systematic changes in measurement technologies and methods. Uncertainty is largest in the nineteenth century and smallest in recent decades, which is why comparisons against the 1850–1900 pre-industrial baseline carry a wider range than comparisons against 1951–1980.
This report reflects observations recorded into the global archives as of the analysis date (land component 11-Sep-2026 19:47:26; ocean component 13-Aug-2026 16:15:21), with 7,010 stations having reported for August itself by that point. Reporting for the most recent month is always incomplete, and additional observations for this period will continue to arrive and be incorporated into later updates. Such revisions are typically small and are unlikely to alter the qualitative conclusions presented here, though they may change rankings where periods are separated by less than the stated uncertainty.
Updated data files are posted at the Berkeley Earth data page and are refreshed monthly. The global monthly and annual land-and-ocean series used here are available directly as Land_and_Ocean_complete.txt and Land_and_Ocean_summary.txt. Gridded fields, regional averages and station records are available from the same page.
The same underlying data can also be explored through Berkeley Earth Synthesis, which provides an interactive alternative access point, including historical and projected conditions for individual cities and regions.
Copyright
This report and the figures it contains may be reused under the terms of the Creative Commons BY-NC 4.0 copyright license for any non-commercial purpose. News media may use these materials for reporting purposes with attribution to Berkeley Earth. For commercial licensing, please contact admin@berkeleyearth.org.