The following is a summary of global temperature conditions in Berkeley Earth’s analysis of March 2024.
- Globally, March 2024 was nominally the warmest March since records began in 1850.
- The previous record for warmest March was broken by only a very small margin (0.01 °C), within uncertainties this means March 2024 essentially tied with March 2016.
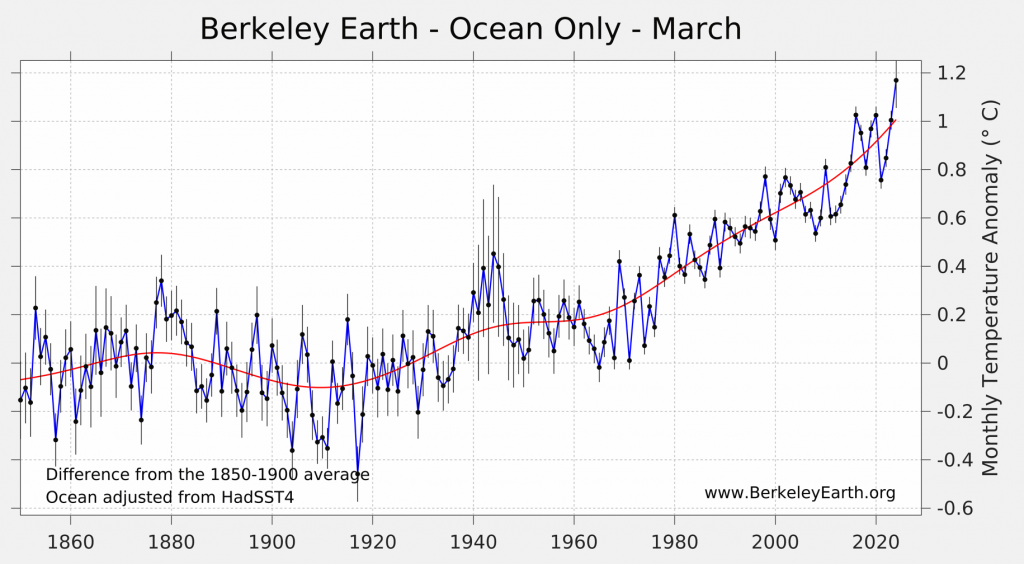
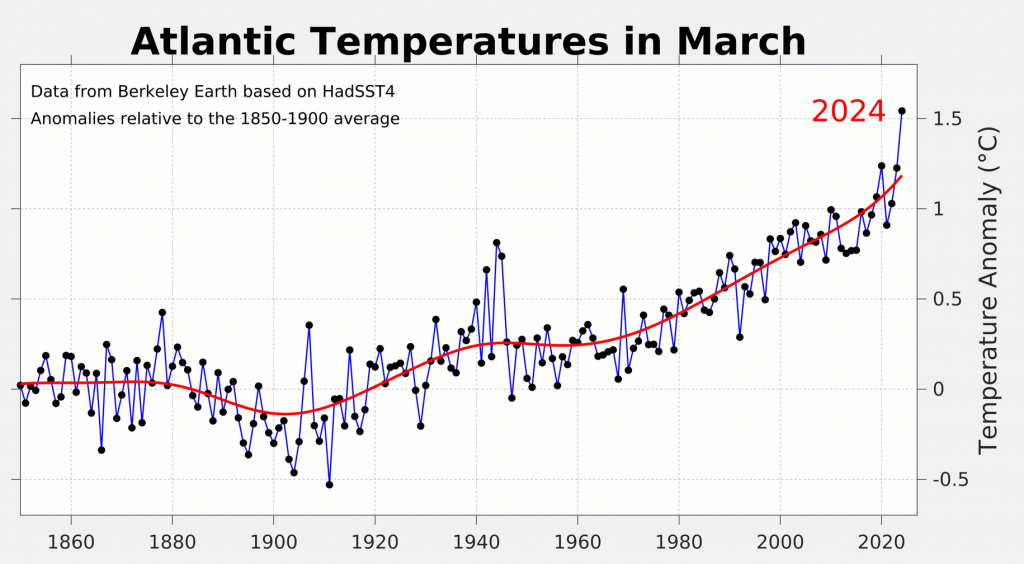
- The ocean-average also set new records for the warmest March.
- The land-average was the 3rd warmest observed, behind 2016 and 2023.
- Particularly warm conditions occurred in parts of North America, Asia, South America, Africa, and large areas of the Atlantic.
- No regions exhibited unusually cold monthly averages in March.
- 43 countries set new national monthly-average records for February.
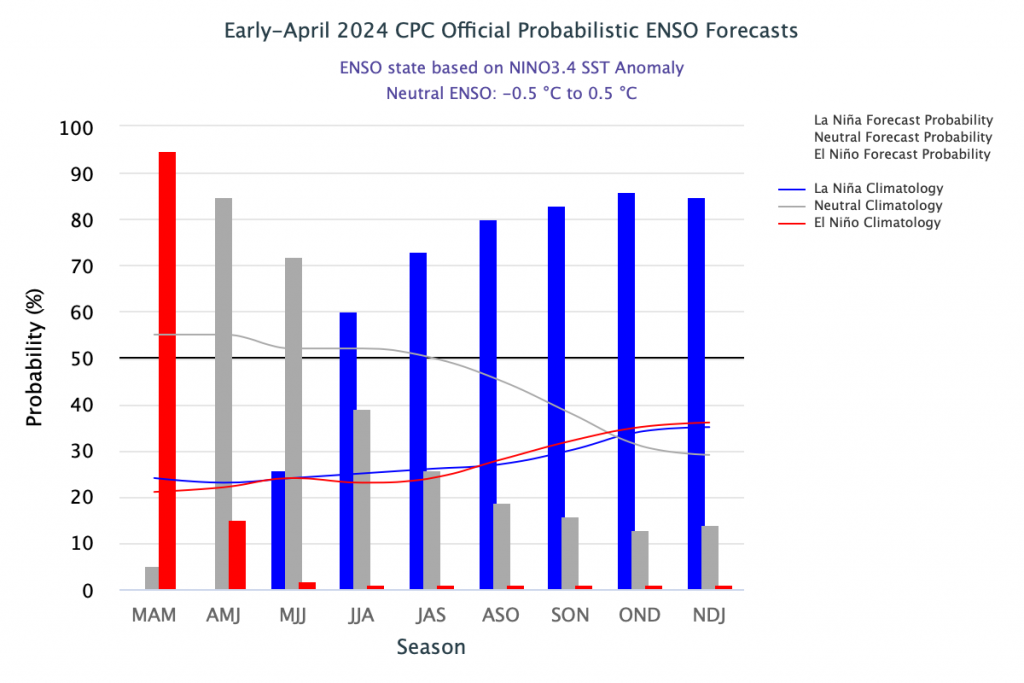
- El Niño has weakened to a moderate category, and is likely to end by mid-2024.
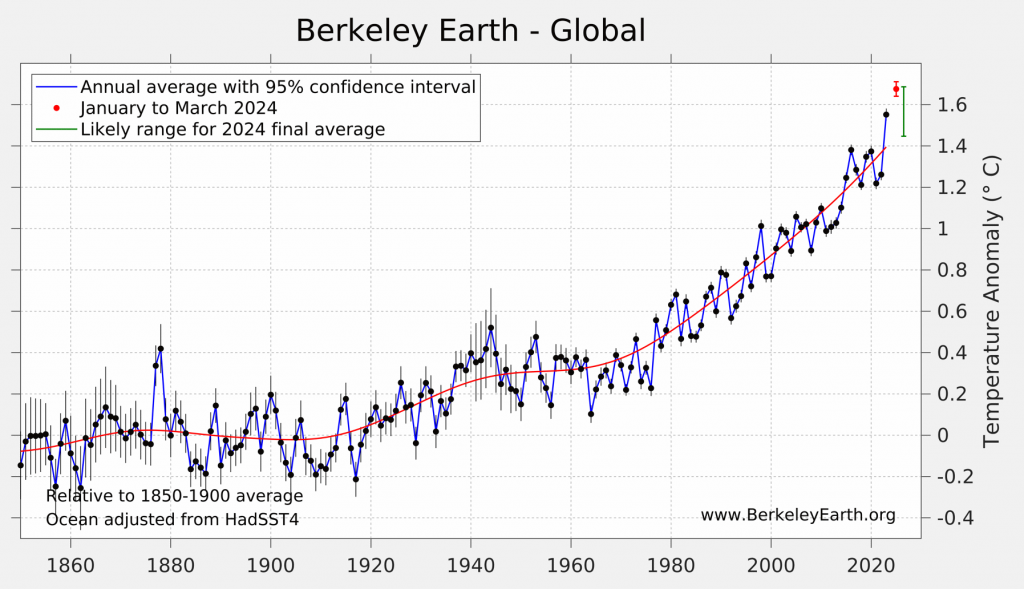
- 2024 is very likely to be either the warmest or second warmest year on record.
Global Summary
Globally, March 2024 was nominally the warmest March since directly measured instrumental records began in 1850, but broke the previous record from March 2016 by only a tiny margin. This March exceeded the previous record by 0.01 °C (0.01 °F), a very small margin well under margin of uncertainty. As a result, March 2024 and March 2016 are essentially tied for the warmest March.
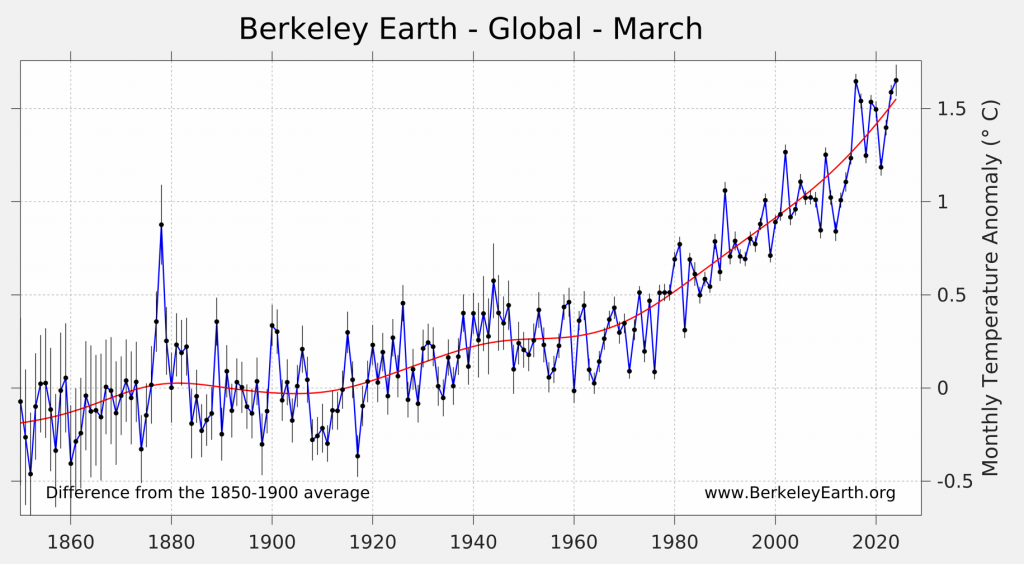
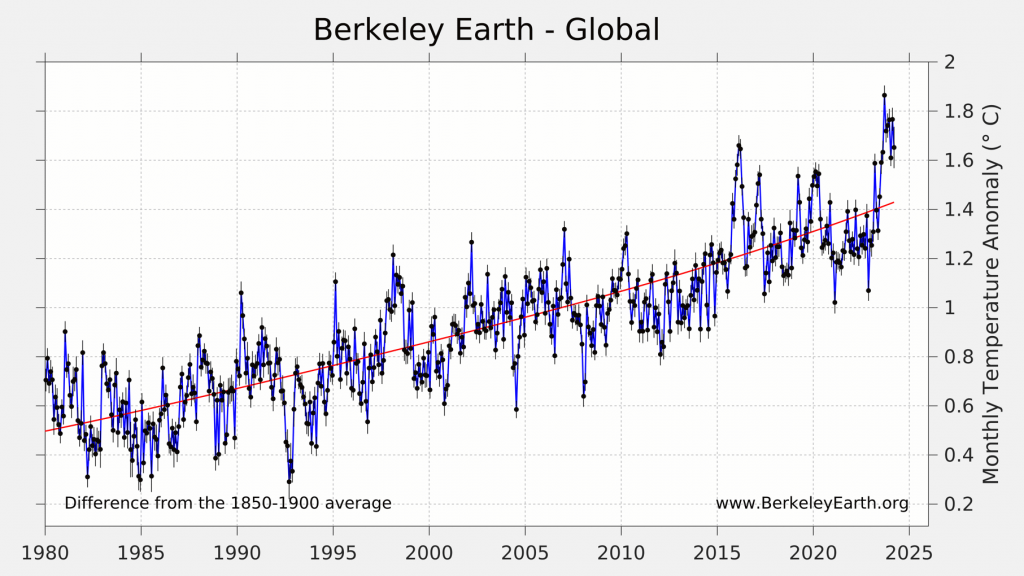
The global mean temperature in March 2024 was 1.65 ± 0.11 °C (2.97 ± 0.19 °F) above the 1850 to 1900 average. However, it is somewhat cooler than some of the other recent months.
March 2024 continues the run started in July 2023 of each individual month being at least 1.5 °C warmer than the 1850 to 1900 average.
One of the Paris Agreement ambitions has been to limit global warming to no more than 1.5 °C (2.7 °F) above the preindustrial baseline. That goal is defined in reference to the average climate over many years, so a few individual months or a single year above 1.5 °C do not automatically mean that the target has been exceeded. However, isolated anomalies above 1.5 °C are a sign that the Earth is getting close to that limit. It is likely that global warming will cause the long-term average to exceed 1.5 °C during the 2030s unless significant reductions in greenhouse gas emissions are achieved soon.
The last ten months have been extraordinary in terms of global average temperatures, with new monthly records being set every month and often by large margins. However, March adds to that run only by the slimmest of margins.
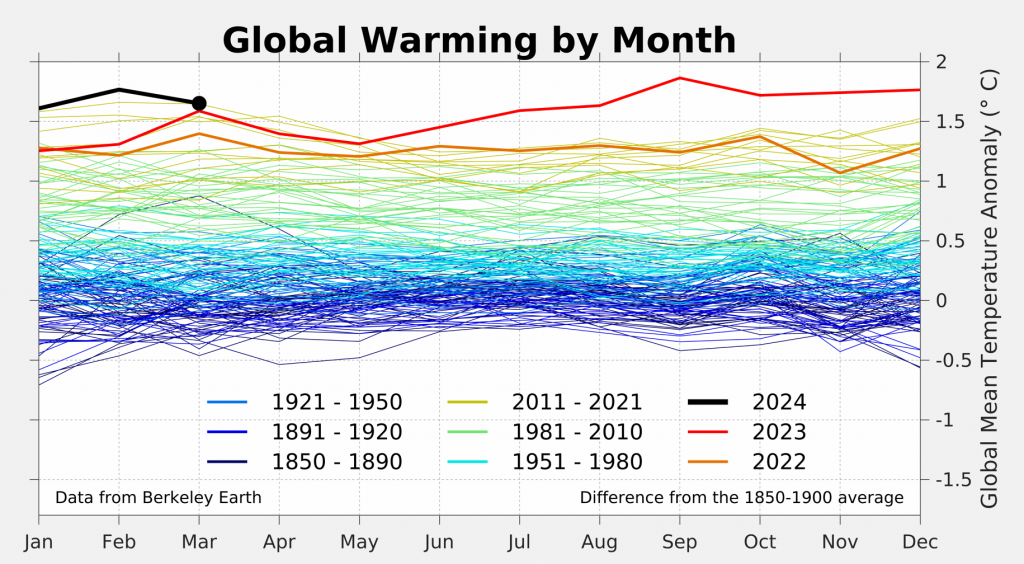
The global mean temperature anomaly in March 2024 noticeably dipped relative to February 2024, but is similar to January 2024. This remains well above the long-term trend line.
Spatial Variation
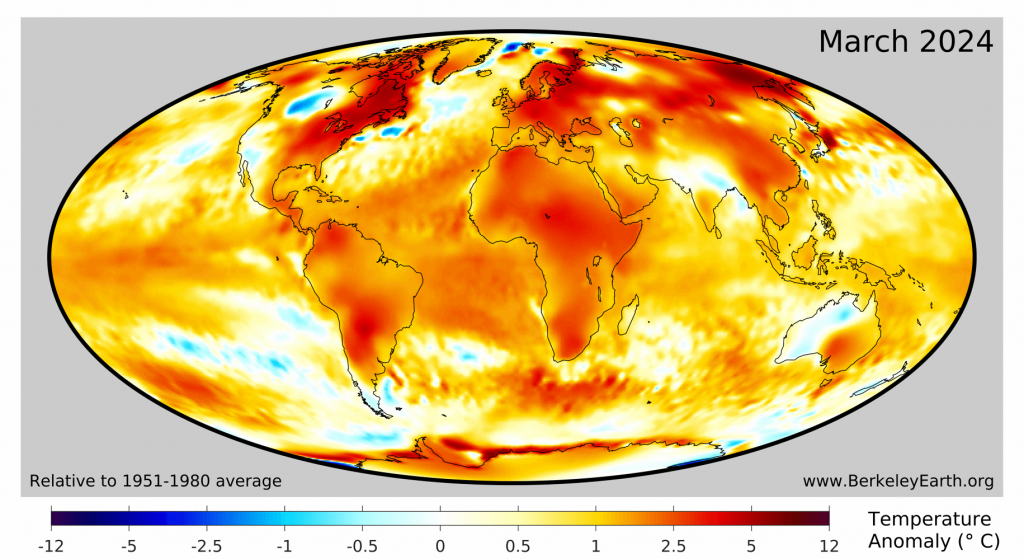
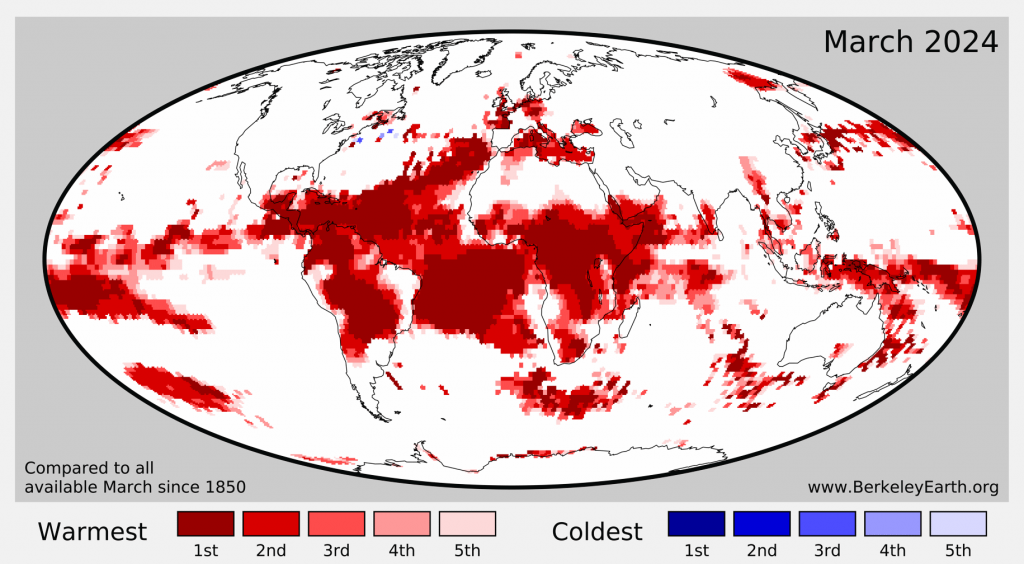
March 2024 continues the ongoing pattern of widespread warmth, with a few important exceptions. Particularly warm conditions were present in parts of North America, Asia, South America, Africa, and large areas of the Atlantic. No regions of unusually cold monthly averages were observed in March.
We estimate that 11.1% of the Earth’s surface experienced their locally warmest March average (including 11.6% of land areas), and 85% of the Earth’s surface was significantly warm when compared to their local average during the period 1951 to 1980. By contrast, none of the Earth’s surface had their locally coldest March.
The Equatorial Pacific in March has weakened from strong to moderate El Niño conditions. The El Niño condition was officially declared by NOAA in early June 2023 and is expected to dissipate around mid-2024.
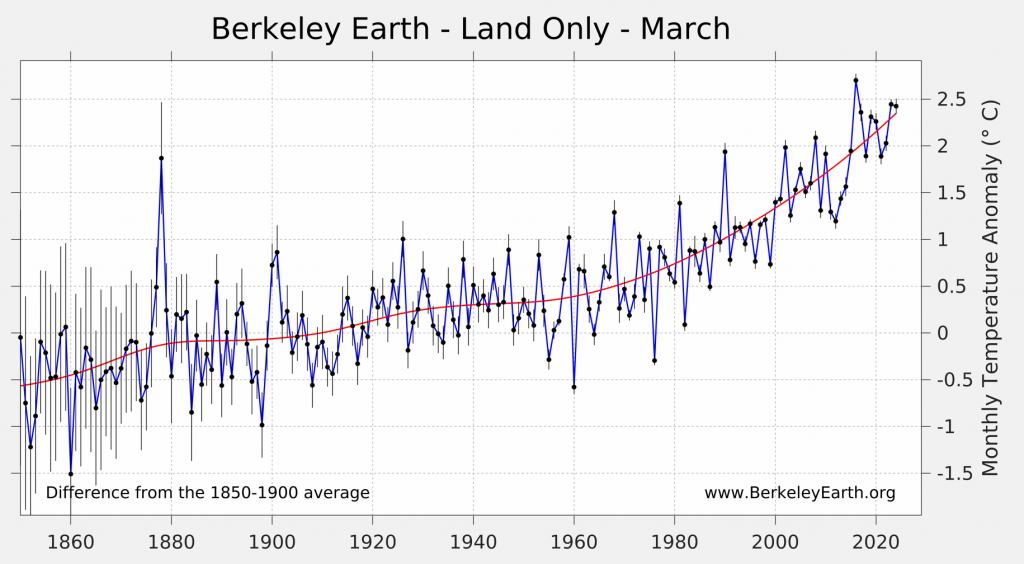
Over land regions, 2024 was the third warmest March ever observed, though essentially tied with March 2023. It was significantly cooler than March 2016, but well above most other years. The land average was 2.42 ± 0.16 °C (4.36 ± 0.28 °F) above the 1850 to 1900 average.
In total, we estimate that 43 countries, mostly in the tropics, had their warmest national-average March on record, these were:
Belize, Benin, Bolivia, Brazil, Burundi, Cameroon, Central African Republic, Colombia, Costa Rica, Democratic Republic of the Congo, Djibouti, Dominican Republic, Ecuador, El Salvador, Equatorial Guinea, Gabon, Germany, Guatemala, Guinea, Haiti, Honduras, Jamaica, Kiribati, Lesotho, Netherlands, Nicaragua, Nigeria, Palau, Panama, Paraguay, Republic of the Congo, Rwanda, Samoa, Seychelles, Sierra Leone, Solomon Islands, South Africa, South Sudan, Togo, Uganda, Venezuela, Zambia, and Zimbabwe
In addition, both Africa and South America set continent-wide record averages for March.
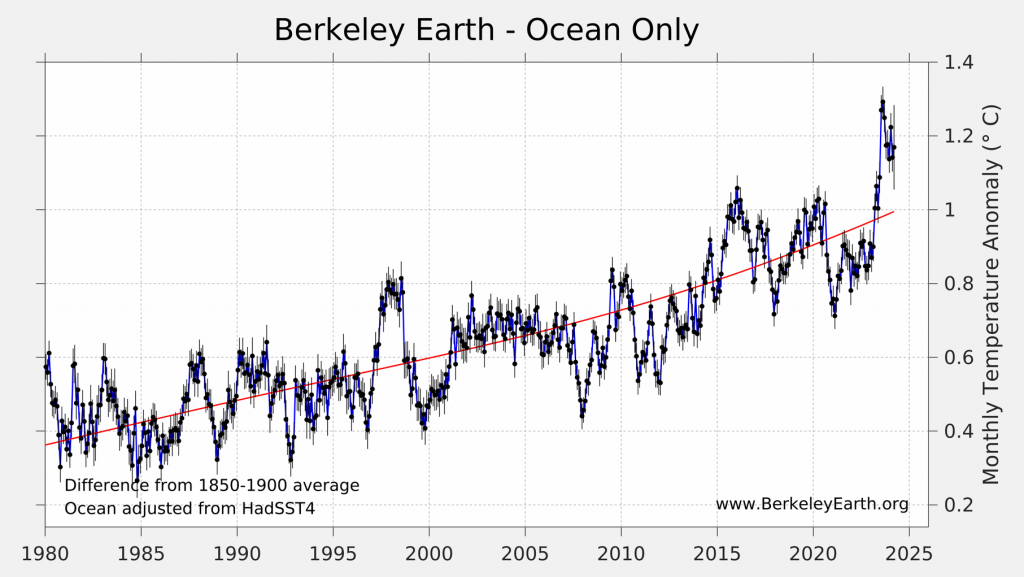
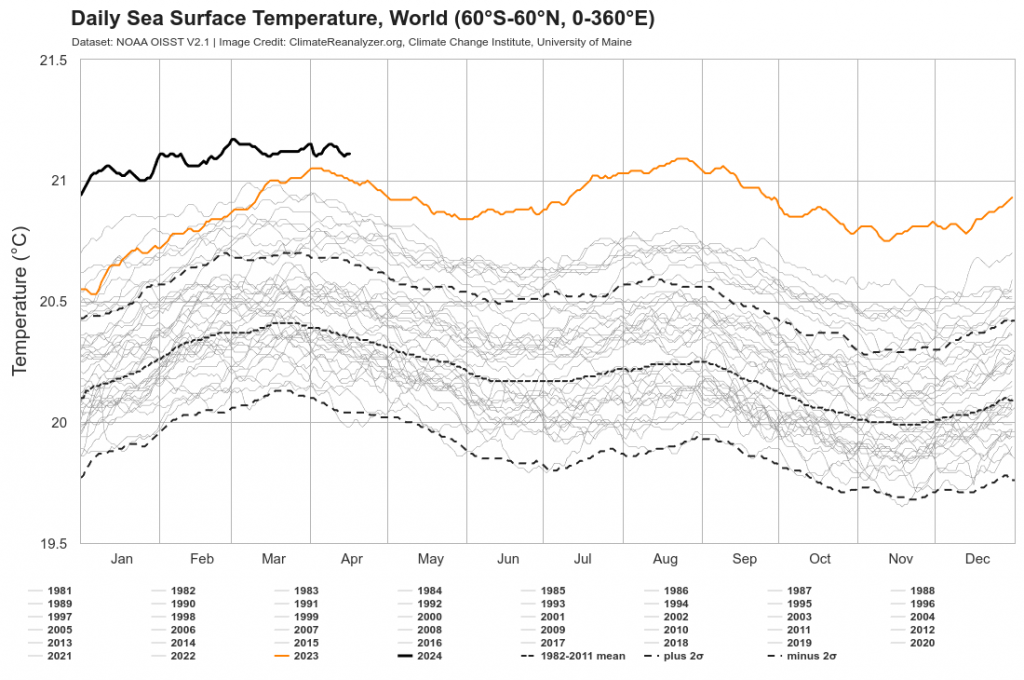
March 2024 was the warmest March in the ocean average, recorded as 1.17 ± 0.13 °C (2.18 ± 0.20 °F) above the 1850 to 1900 average. This beats the previous record for March by a large margin, and continues a year-long trend of record setting ocean temperatures.
The ocean temperature anomaly for March is similar to other recent months in 2024, but cooler than in July, August, and September 2023.
According to NOAA’s OISST, global ocean average temperatures have now set a daily temperature record during every consecutive day for more than a year. This is due to the combination of El Niño and extremely unusual warmth in the Atlantic. This streak will likely end no later than the middle of 2024 as El Niño dissipates, bringing ocean temperatures below the highs of 2023.
Causes of Recent Warmth
The record warmth over the last few months has been due primarily to the ongoing El Niño condition in the Pacific, which is a form of natural variability associated with short-term swings in global temperature. This short-term change occurs alongside a background of longer-term man-made and other natural changes mostly also favoring warming during the present time.
Firstly, man-made global warming has been raising the Earth’s temperature by about 0.19 °C/decade (0.34 °F/decade). This is a direct consequence of the accumulation of additional greenhouse gases in the atmosphere, especially carbon dioxide. This is the primary factor responsible for long-term warming.
However, this global warming is a gradual process. It does not explain short-term spikes and fluctuations in Earth’s average temperature. The main reason for such spikes is internal variability in the distribution of heat and circulation of the oceans and atmosphere. The largest and most well-known form of short-term internal variability is the El Niño / La Niña cycle originating in the Pacific. During the El Niño phase, global average temperatures tend to be somewhat higher. As a result, record highs for global average temperature tend to be set during El Niño years. Last year, a new El Niño officially began in June after a multiple year period of La Niña. The rapid transition from a moderately strong La Niña to the current El Niño played a large role in the warming of 2023.
In addition to the natural El Niño variability, it is likely that other variability also contributed to recent high temperatures. One area of special interest is the Atlantic Ocean. The Northern Atlantic was persistently warm during the second half of 2023 and remains warm in March, with large regions continuing to set records. In recent months, significant warmth has expanded in the Southern Atlantic as well. If these changes were entirely natural, the warming spike in the North Atlantic would be rare. However, in a previous discussion, we noted that warm anomalies in the Atlantic are likely to be combination of natural variability and man-made regional warming due to new marine shipping regulations that abruptly reduced maritime sulfur aerosol pollution by ~85%.
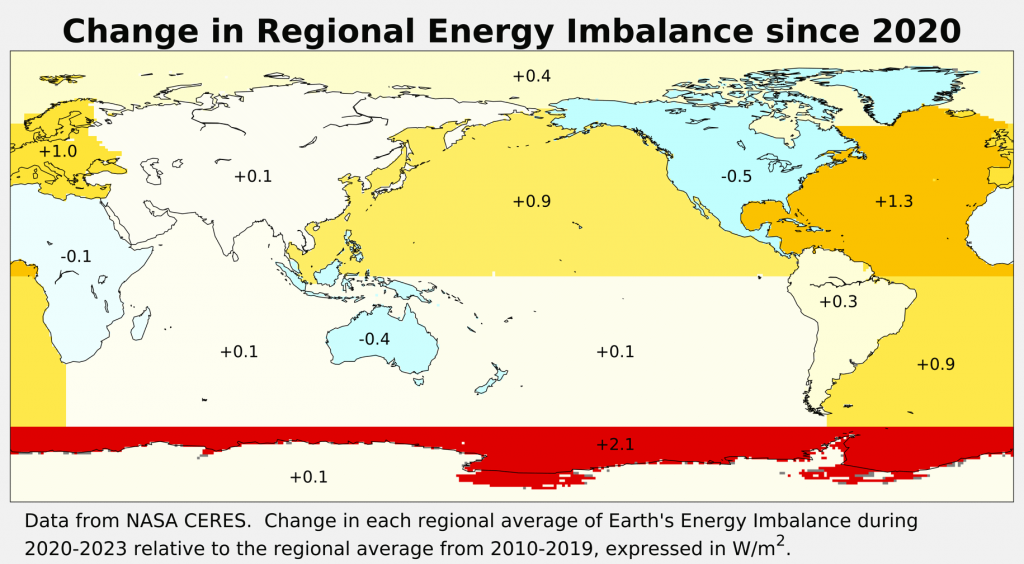
The following map shows satellite measurements of the changes in the regional energy imbalance since 2020, when the change in international shipping regulations sharply reduced the abundance of marine sulfur air pollution. Energy imbalance is the difference between absorbed solar radiation and outgoing thermal radiation, and helps to identify regional warming (or cooling) that is associated with regional changes in the radiative energy budget.
We note the presence of prominent anomalies in the North Atlantic and North Pacific, the two regions with the greatest volume of maritime shipping, and hence most likely to have their climate impacted by the new shipping regulations. These changes are broadly consistent with the effect we would expect to see as a result of the reduction in aerosol emissions, though with only 4 years of data since the change in emissions regulations, natural variability may also play a role in the observed changes.
The Southern Ocean also shows a very large energy balance anomaly during the last 4 years. The change in the Southern Ocean is related to recent record lows in Antarctic sea ice, and unrelated to aerosol pollution.
The combination of global warming and El Niño are the primary factors responsible for the present high global average temperature. However, other factors may also be playing a role. In particular, the evolution of oceanic heatwaves in the Atlantic and other areas is likely to play a large role in determining the outlook for 2024.
El Niño Outlook
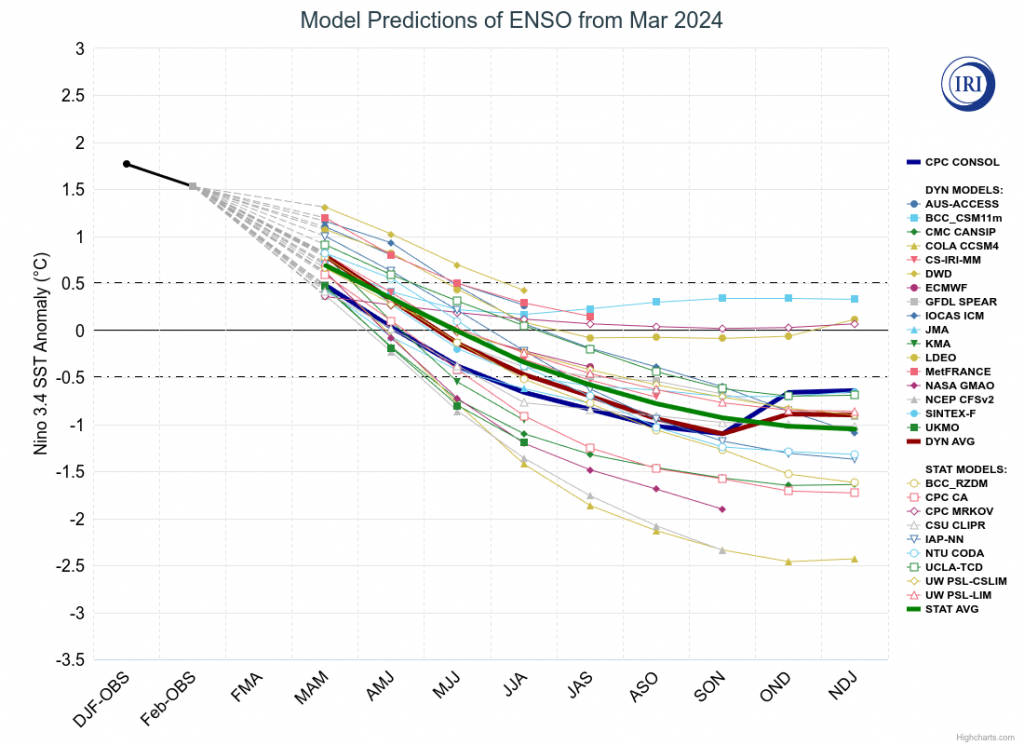
March 2024 saw a significant weakening of the current El Niño event. The current CPC/IRI analysis suggests that El Niño conditions will dissipate around Northern Hemisphere Summer in 2024. The current El Niño has weakened to a moderate intensity (after being roughly the 3rd strongest of the last 30 years) and is likely to continue dissipating over the next several months.
The current El Niño is likely to moderately boost global average temperatures during 2024. Due to the lag between the development of El Niño and its full impact being felt on global temperatures, it is plausible that the current El Niño will have a greater impact on global temperatures in 2024 than it did in 2023. If a La Niña event develops in late 2024, as now appears likely, this will generate moderately cooler conditions late in 2024. The interplay between the current El Niño, the possibility of a late 2024 La Niña, and unusual conditions in other regions (e.g. warmth in the Atlantic) will contribute to whether 2024 is or is not ultimately warmer than 2023.
Rest of 2024
2024 will very likely be one of the two warmest years since instrumental measurements began. Whether it is the warmest year on record will depend on whether it can maintain its current warmth long enough to exceed the record annual average set in 2023. It is typically true that the second year after an El Niño emerges is warmer than the first, though that is not guaranteed.
The first three months of 2024 started with large anomalies, though this is expected to cool somewhat during the latter part of 2024.
The statistical approach that we use, looking at conditions in recent months, now believes that 2024 has a 59% chance of being warmer than 2023, slightly better than a coin flip. The ultimate outcome will depend on the evolution of the current El Niño, the possible switch to La Niña late in 2024, and variation in other regions. However, it is very unlikely that 2024 will be any colder than the second warmest year overall.
Estimated Probability of 2024 Annual Average final rankings:
- 1st – 59%
- 2nd – 41%
- 3rd or lower – <1%
This forecast probability of record warmth is largely unchanged from the 62% chance estimated last month.
We also consider there to be a 80% chance that 2024 will have an annual-average temperature anomaly more than 1.5 °C (2.7 °F) above our 1850-1900 average. The annual average in 2023 slightly exceeded the 1.5 °C (2.7 °F) threshold in our dataset, and this is likely to occur again in 2024.
Though the IPCC has set a goal to limit global warming to no more than 1.5 °C above the pre-industrial, it must be noted that this goal refers to the long-term average temperature. A few months, or a couple years, warmer than 1.5 °C does not automatically mean that the goal has been exceeded. However, breaching 1.5 °C does serve to emphasize how little time remains to meet this target. Unless sharp reductions in man-made greenhouse gas emissions occur soon, the long-term average is likely to pass 1.5 °C during the 2030s.

