
The following is a summary of global temperature conditions in Berkeley Earth’s analysis of September 2026.
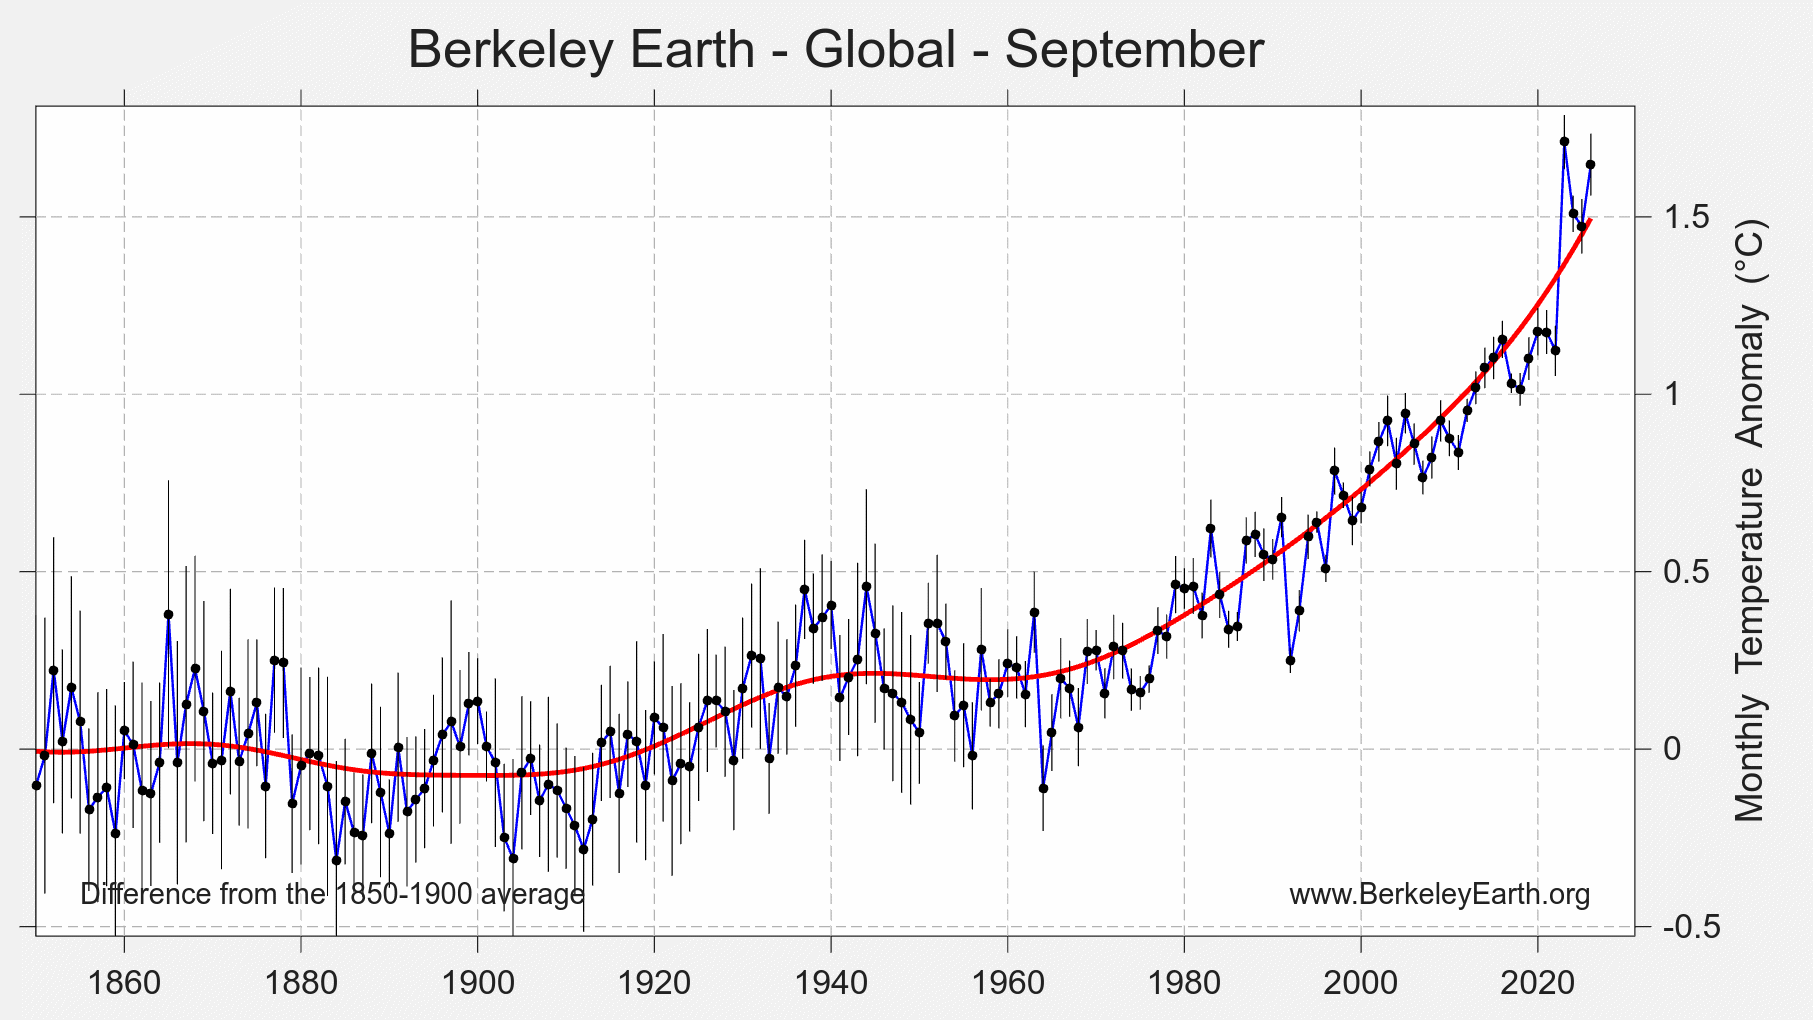
- September 2026 was nominally the 2nd warmest September on record, with a global average of 1.65 ± 0.11 °C (2.96 ± 0.19 °F) above the 1850–1900 average, behind only September 2023.
- Land temperatures averaged 2.17 ± 0.16 °C (3.90 ± 0.29 °F) above the 1850–1900 average, the 2nd warmest September for terrestrial regions.
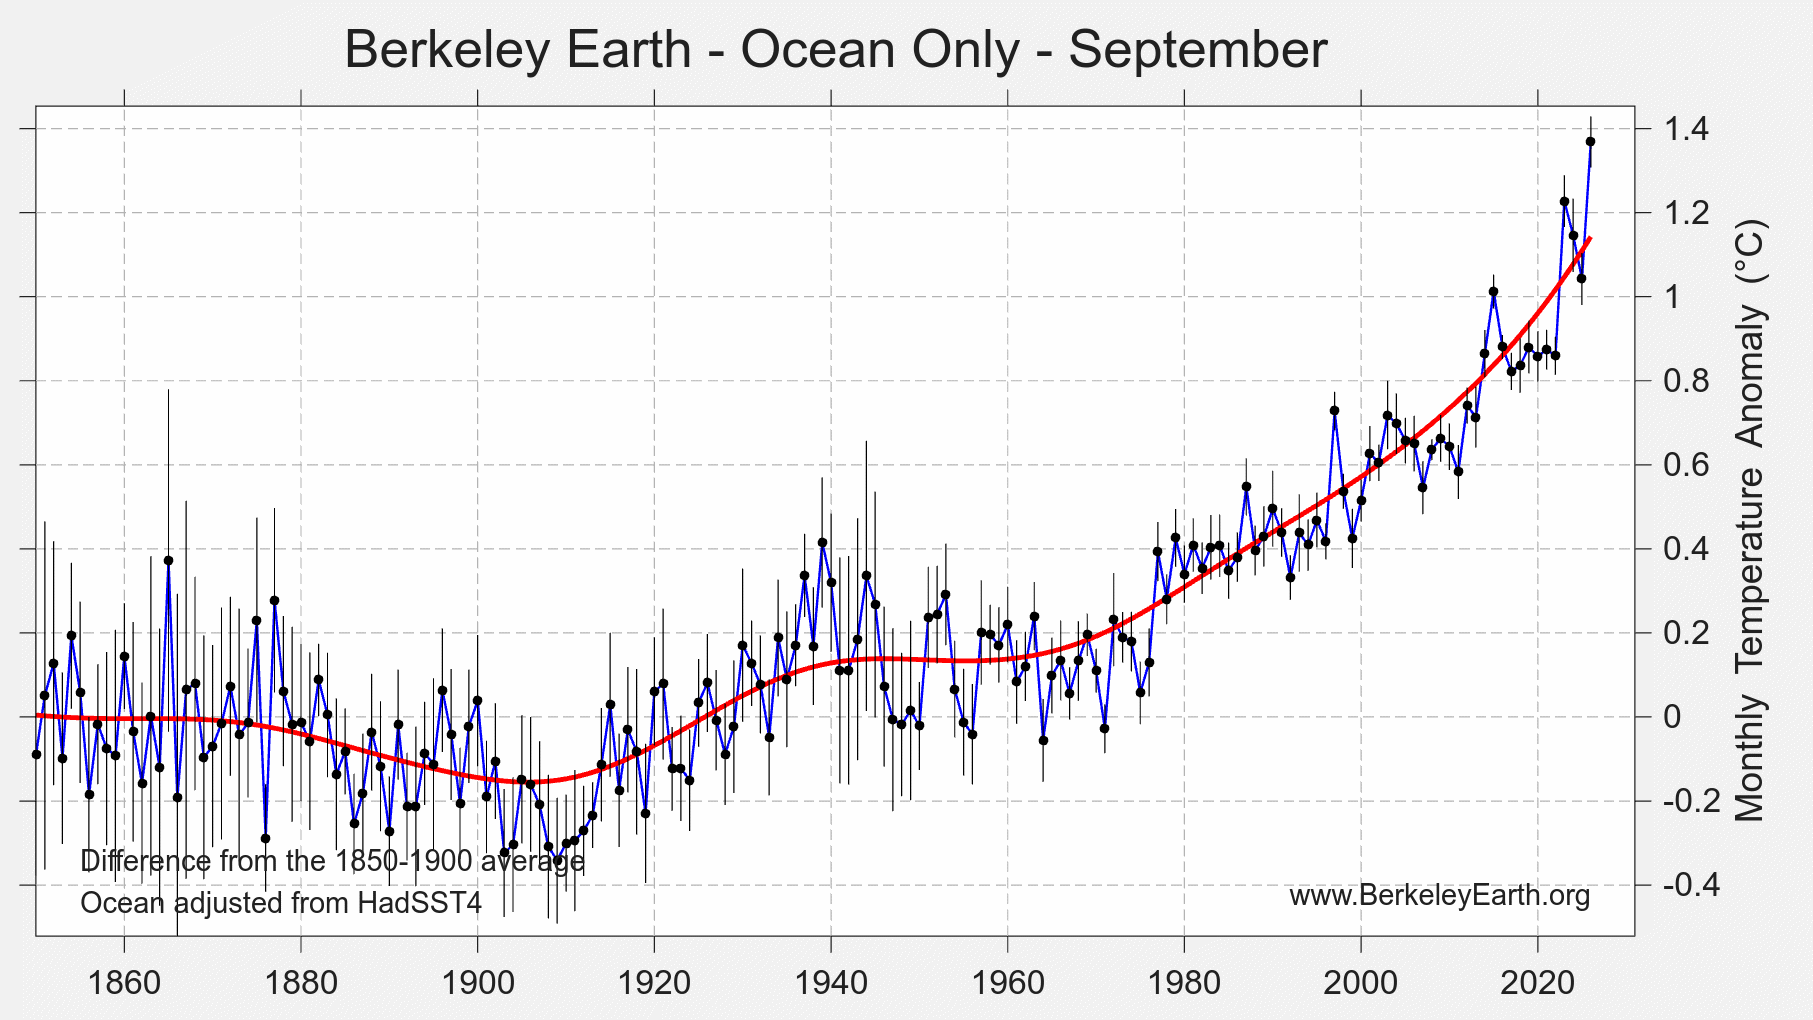
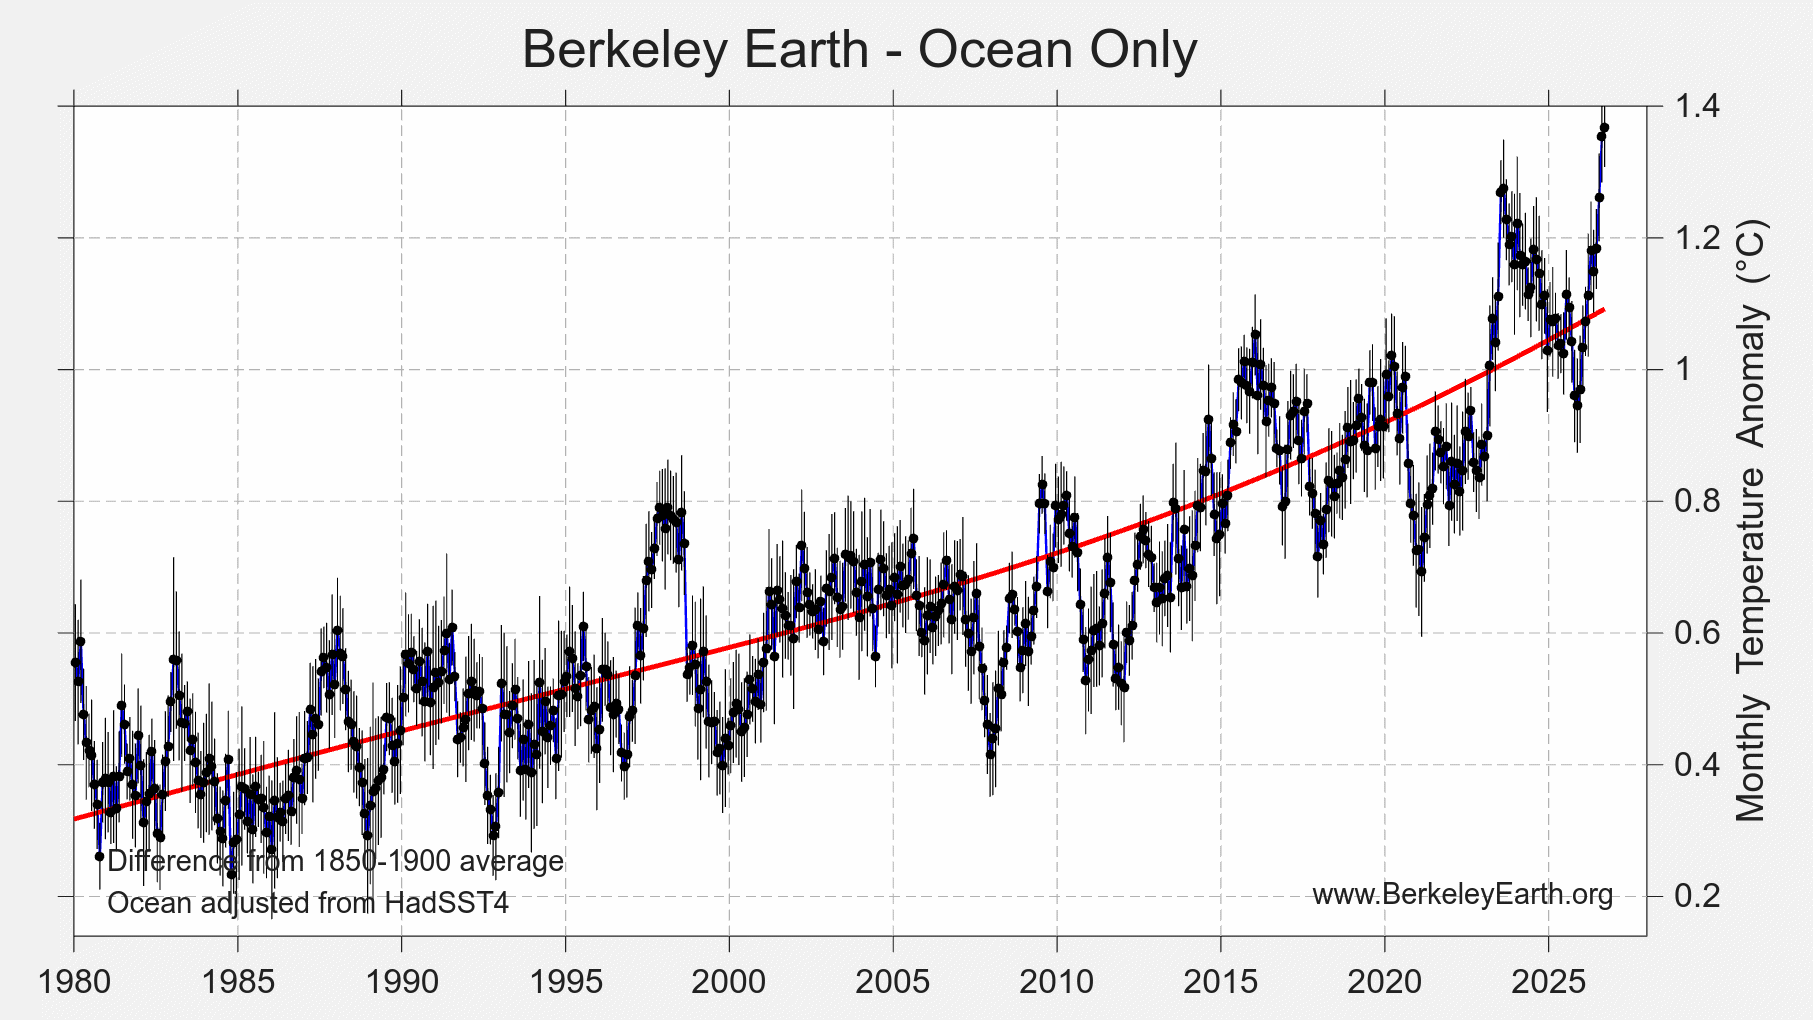
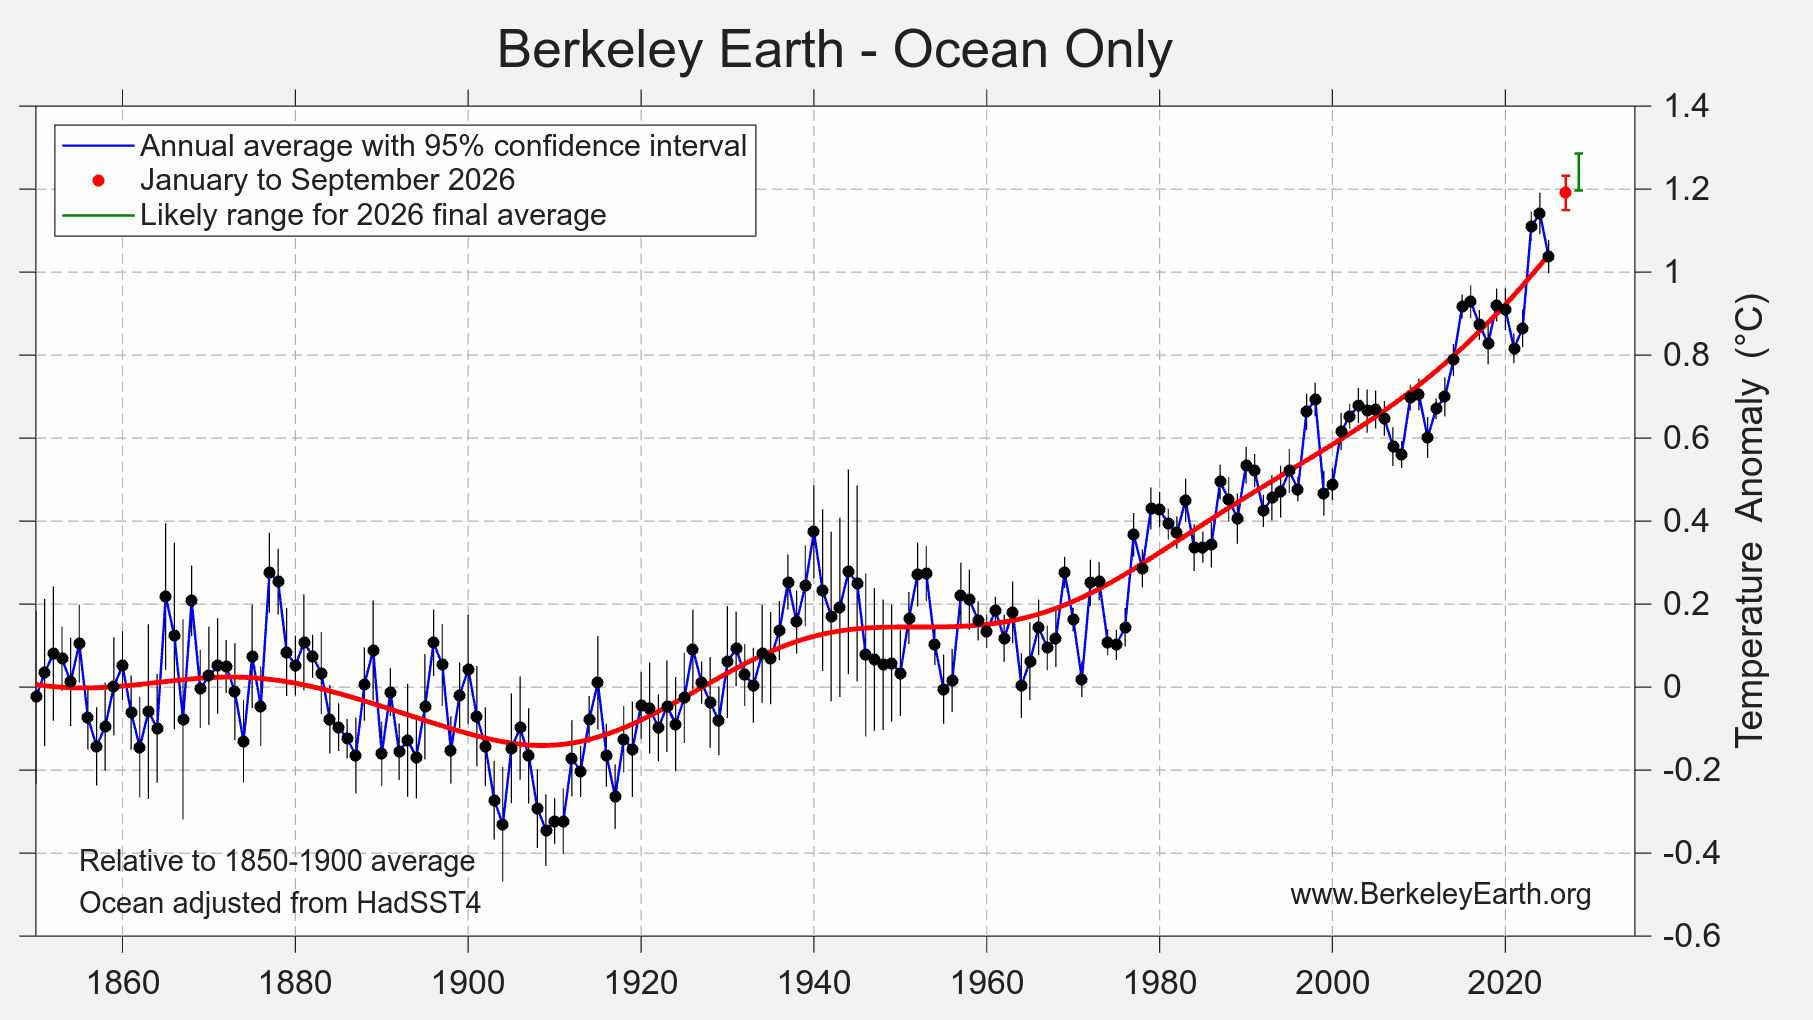
- Ocean temperatures were 1.368 ± 0.068 °C (2.46 ± 0.12 °F) above the 1850–1900 average, a clear record for September and nominally the warmest month of any kind in the ocean record.
- El Niño has reached record strength on the conventional Niño 3.4 index, and its peak is still expected later this year.
- Roughly 11.5% of Earth’s surface experienced its warmest September on record, and 53 countries set national September records.
- Spain, Portugal, Andorra and Italy set national September records, extending an exceptional late summer in southwestern Europe.
- 2026 now has roughly a 96% chance of becoming the warmest year on record, up from about 93% a month ago.
Global Summary
According to Berkeley Earth’s high-resolution temperature dataset, September 2026 was the 2nd warmest September since records began in 1850, with a monthly global average of 1.65 ± 0.11 °C (2.96 ± 0.19 °F) above the 1850–1900 (pre-industrial) average. It sits about 0.06 °C below September 2023. The anomaly in September 2026 is nominally the third largest of any month, behind only September 2023 and August 2026.
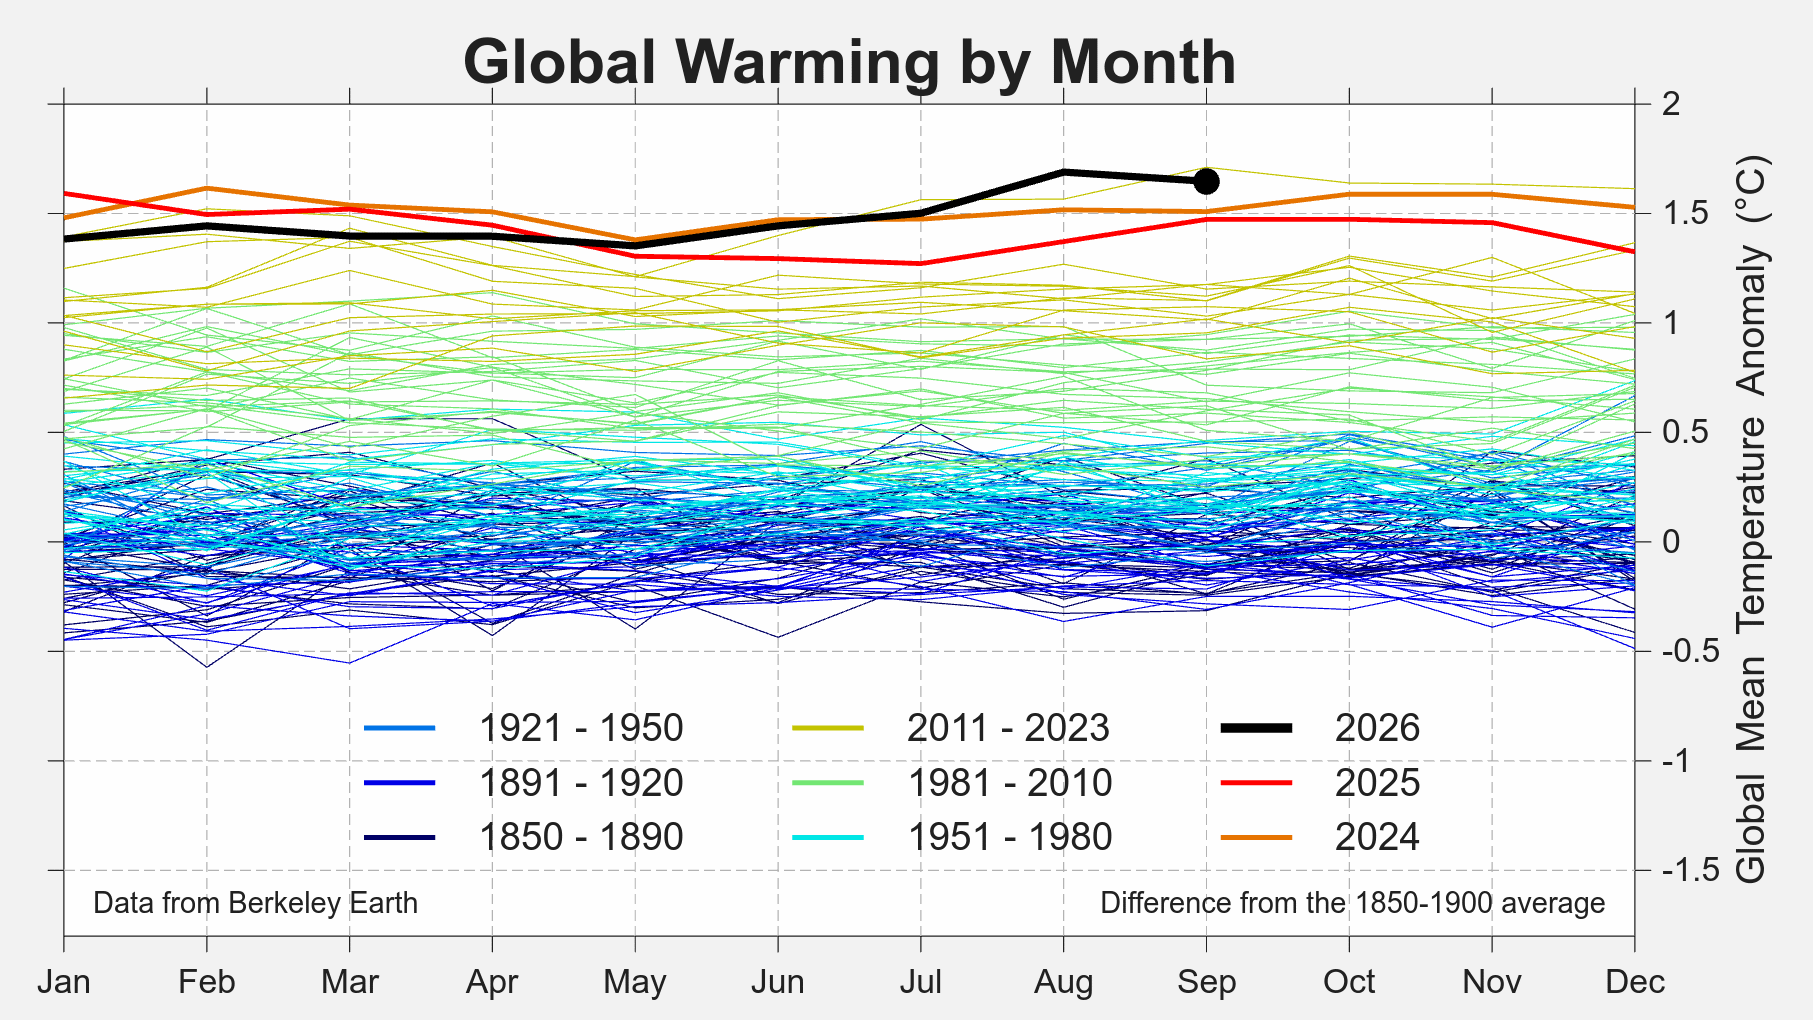
On a month-to-month basis, September was nominally slightly cooler than August 2026 though within the margin or error. It remains sharply warmer than other months in 2026. September 2026 continued the run of months above the 1.5 °C mark that began in July, as the warming influence of El Niño has grown.
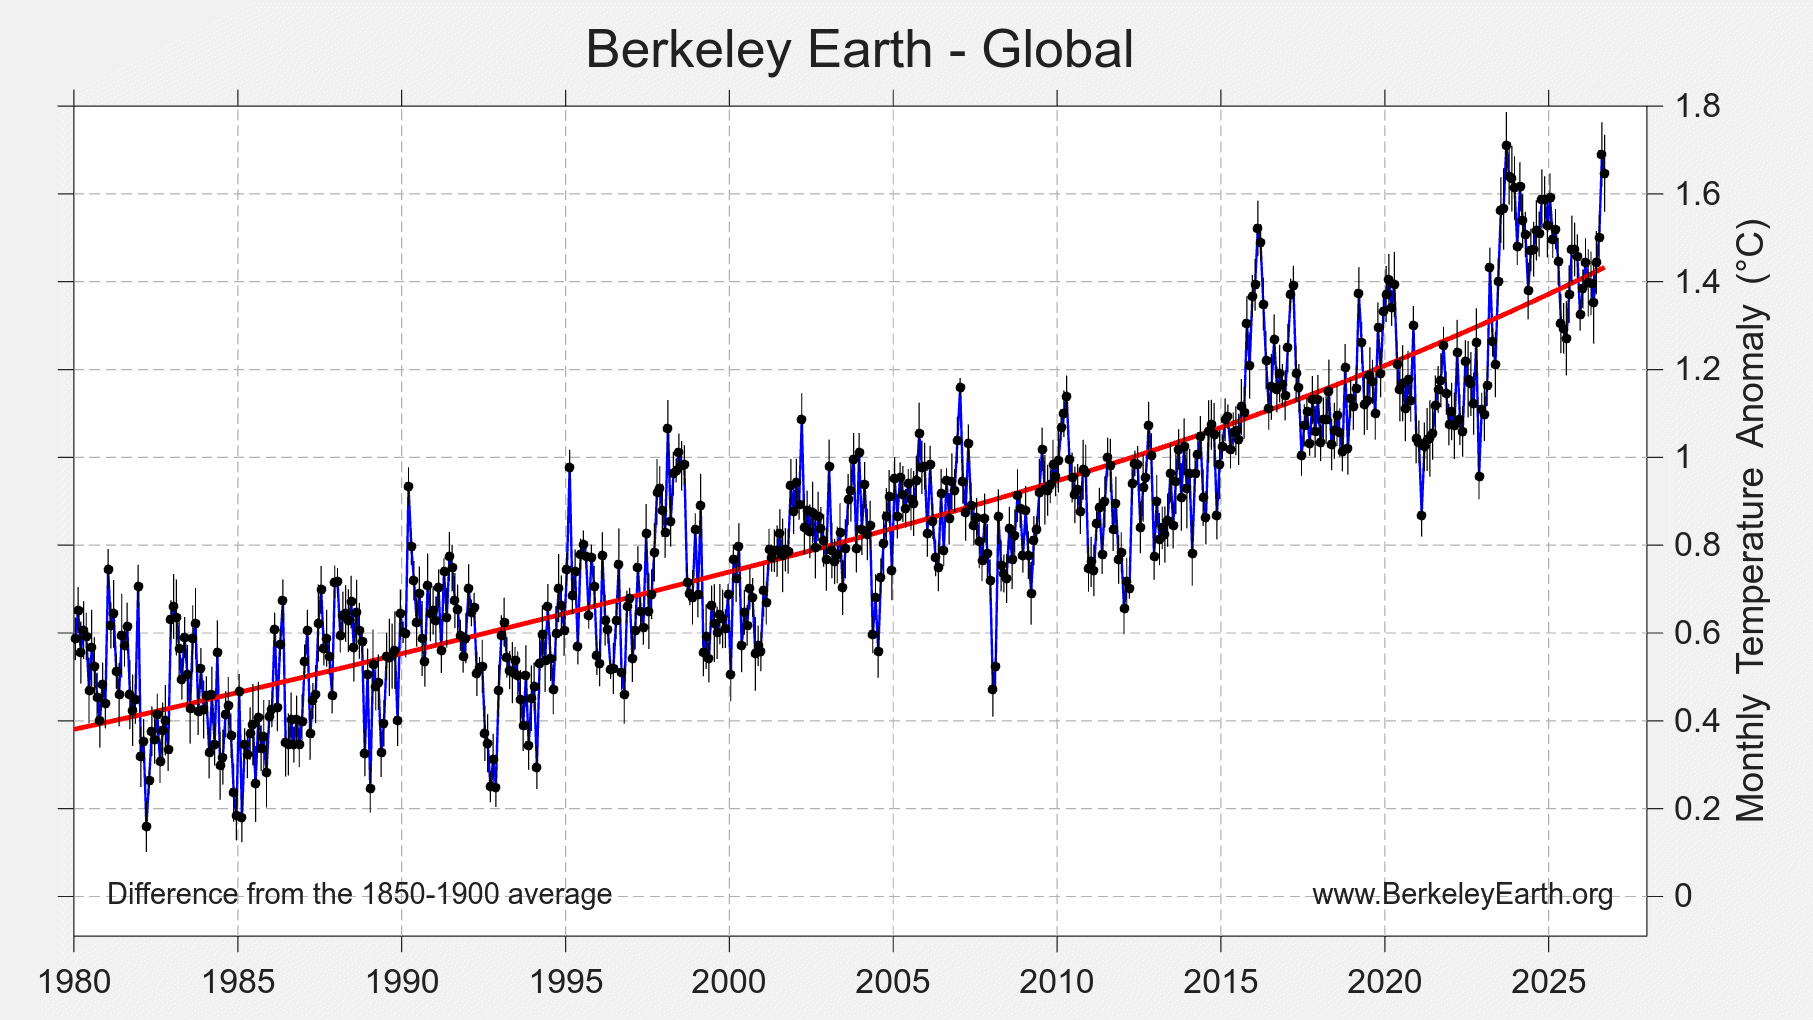
Only one month of 2026 has set a record warm month (August 2026) with most months entering as the 2nd to 5th warmest. Depsite that, we have now pushed close to all-time record high temperature anomalies. Record and near-record warmth is expected to continue through the end of the year due to the short-term influence of a record-breaking El Niño.
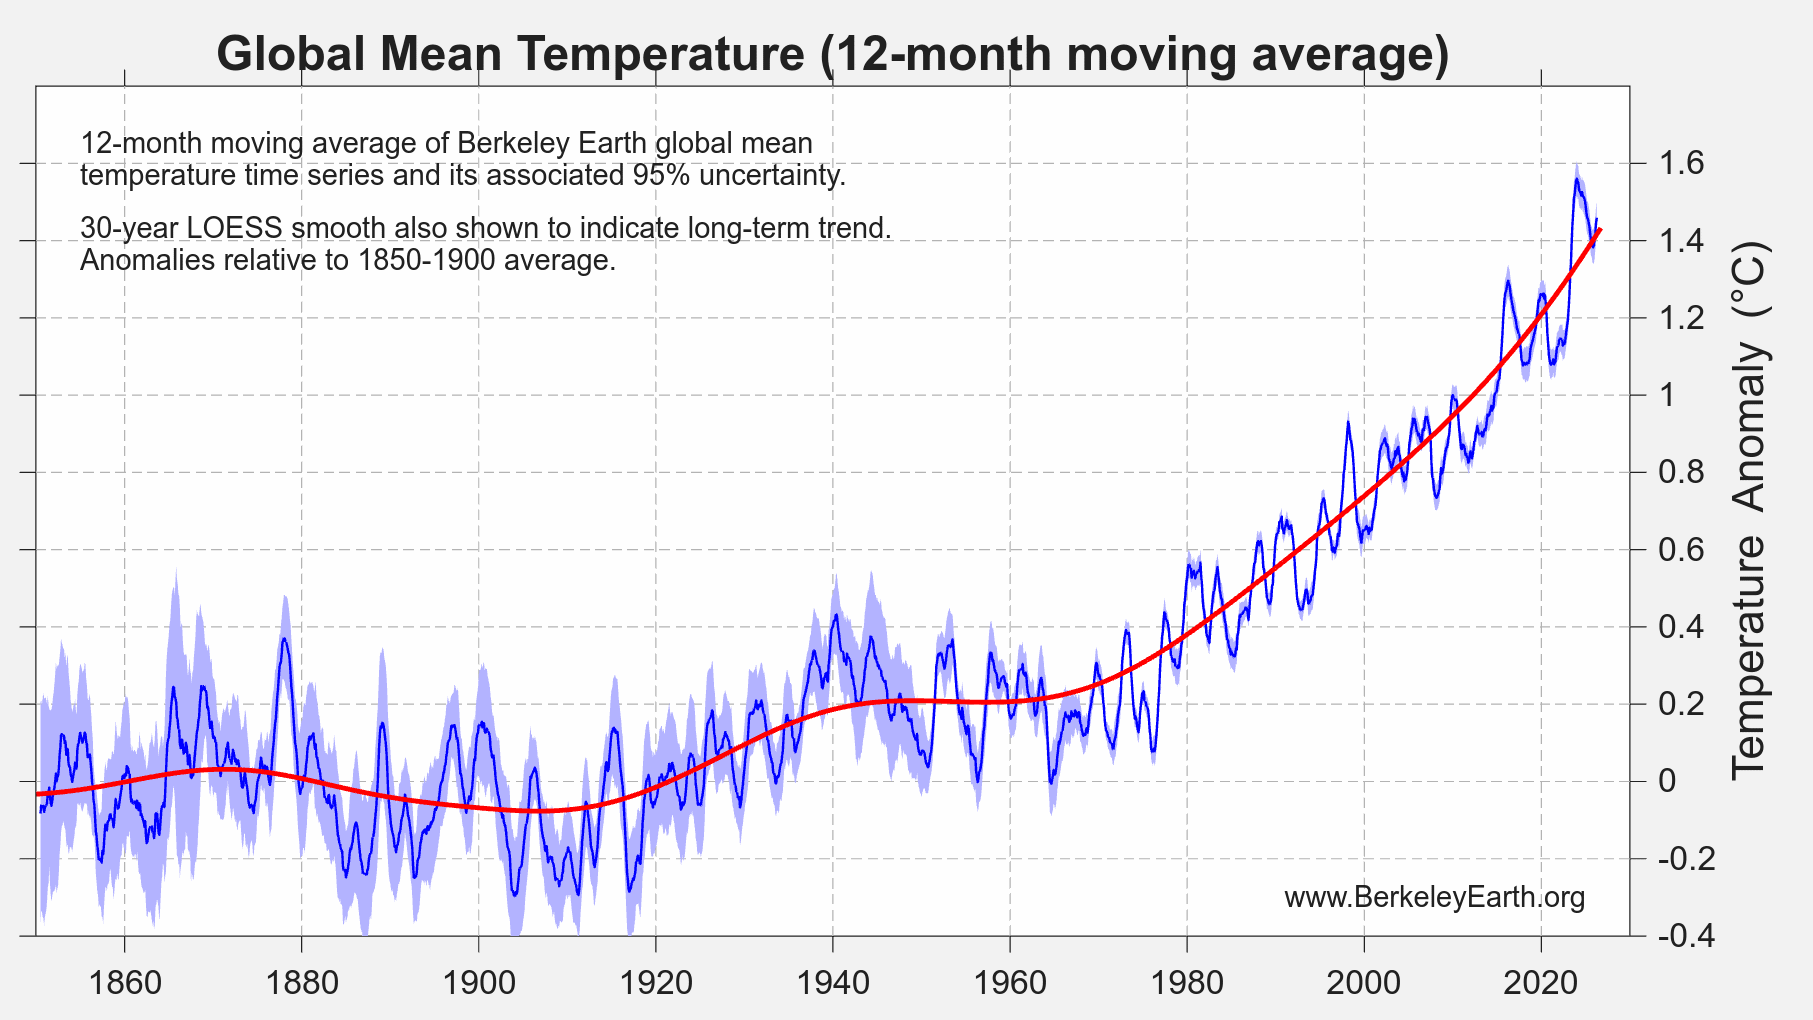
Over the most recent 12 months (October 2025 to September 2026), the global average was 1.458 ± 0.074 °C (2.62 ± 0.13 °F) above the 1850–1900 average, making it the 2nd warmest such 12-month period on record. It is behind the period ending in September 2024 and effectively tied with the period ending in September 2025, which it exceeds by only 0.003 °C. Because El Niño’s influence on the global mean lags its peak in the Pacific, this measure is expected to keep rising into 2027.
Spatial Variation
In September 2026, warmer-than-average temperatures covered most of the globe. The warmth was most pronounced across the central and eastern equatorial Pacific, where El Niño appears as a broad warm band stretching east to the coast of South America, and across the high Arctic, including the Canadian Arctic Archipelago. Large positive anomalies also covered western and central Europe and the western Mediterranean, the western North Atlantic off North America, Australia, and much of northern and central Asia. Some of the largest anomalies anywhere were over West Antarctica. The most prominent cool anomaly was elsewhere on Antarctica, centered on the Weddell Sea sector and stretching along parts of the East Antarctic coast, with smaller cool areas over the Greenland ice sheet, along the west coast of the United States, and at the southern tip of South America.
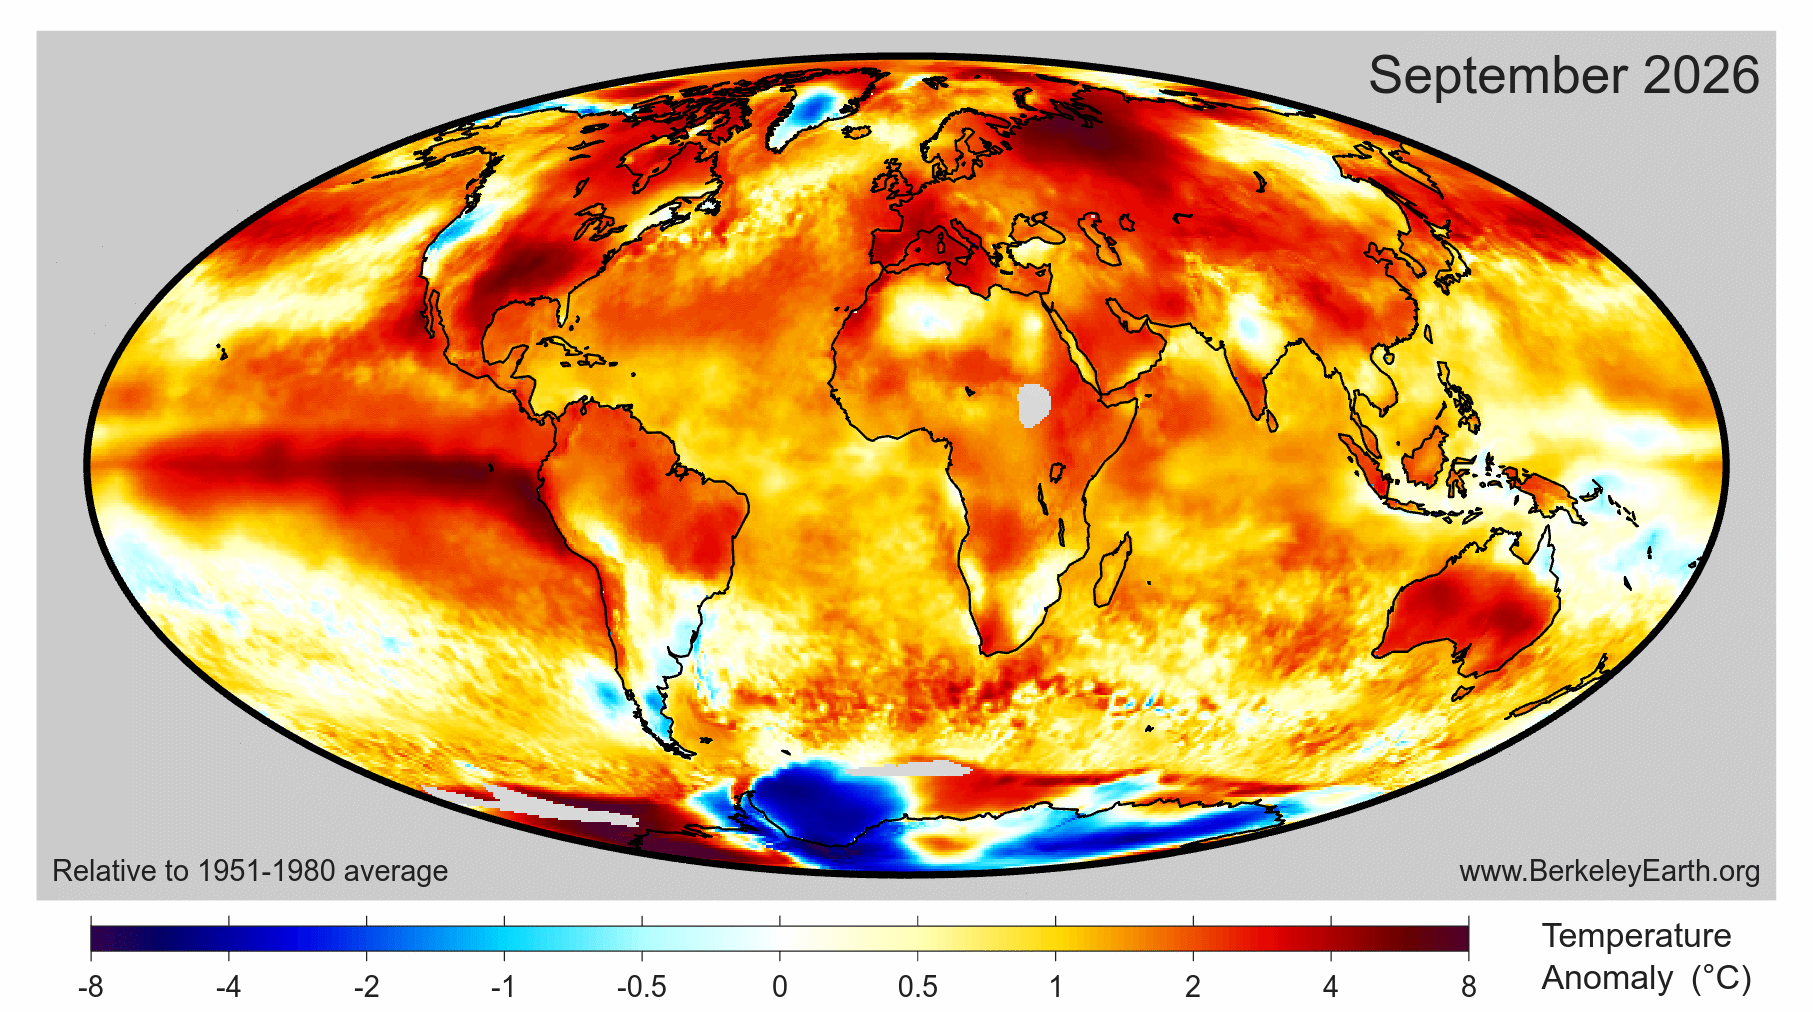
Roughly 11.5% of Earth’s surface experienced its locally warmest September on record (about 9.3% of land and 12.7% of ocean surfaces), and 80.3% of the surface was warmer than average. The largest contiguous region of record warmth occurred in the Eastern tropical Pacific, where a record-breaking El Niño event is underway. Record warmth also covered parts of the tropical and western North Atlantic including the Gulf of Mexico and the Caribbean, Iberia and the western Mediterranean, northwest Africa, the Sahel and the Horn of Africa, the Arabian Peninsula and the Persian Gulf, much of the Indian Ocean, maritime Southeast Asia, and parts of northern Russia and Kazakhstan. Record and near-record warmth in tropical South America, Africa, and Southeast Asia are common features during large El Niño events.
Record and near-record cold for September occurred in a small area of Antarctica bordering the Weddell Sea.
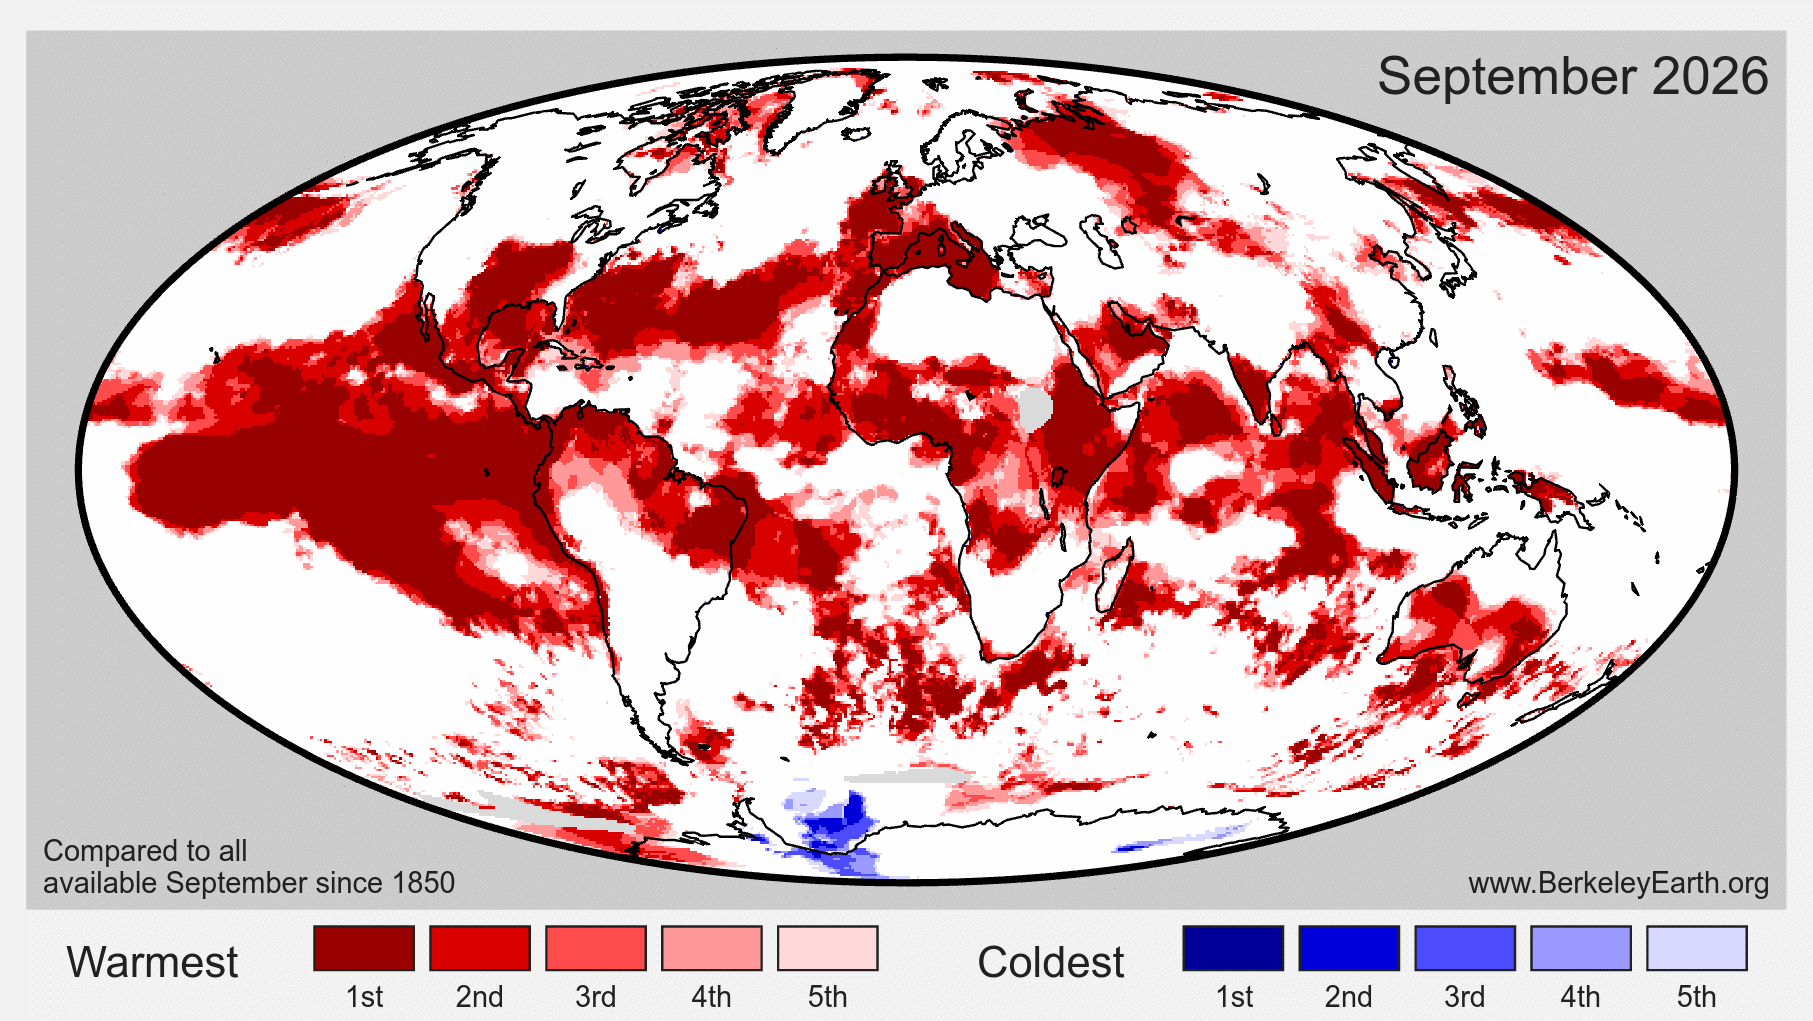
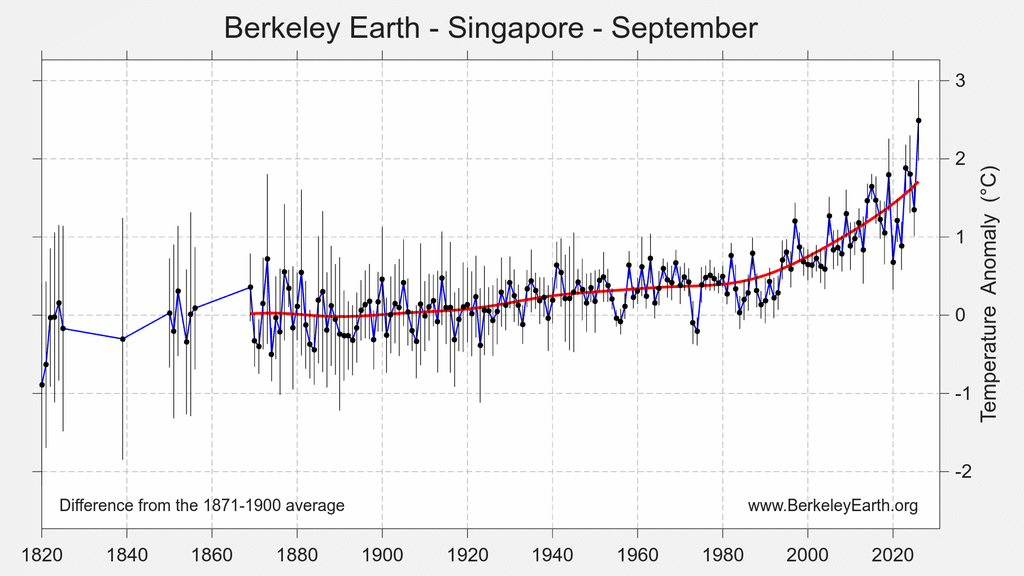
We further estimate that 53 countries set monthly records for September natioanl-average temperature: Andorra, Angola, Bahrain, Barbados, Benin, Brunei, Burkina Faso, Cabo Verde, Cameroon, Central African Republic, Chad, Chile, Colombia, Costa Rica, Djibouti, Ecuador, Equatorial Guinea, Eritrea, Ethiopia, Federated States of Micronesia, Gabon, the Gambia, Grenada, Guinea, Indonesia, Italy, Ivory Coast, Jamaica, Kazakhstan, Kenya, Malaysia, Mali, Morocco, Myanmar, Niger, Nigeria, Panama, the Philippines, Portugal, Qatar, Saint Lucia, Saint Vincent and the Grenadines, Seychelles, Singapore, Spain, Suriname, São Tomé and Príncipe, Trinidad and Tobago, Uganda, the United Arab Emirates, the United States of America, Venezuela, and Western Sahara.
In addition, continent-wide September average records were set for Africa and Asia. Europe and Australia each had their 2nd warmest September.
The national records cluster by region: southwestern Europe and the adjacent coast of Africa (Spain, Portugal, Andorra, Morocco and Western Sahara); the Persian Gulf (the United Arab Emirates, Qatar and Bahrain); the Horn of Africa and East Africa (Ethiopia, Eritrea, Djibouti, Kenya and Uganda); West and Central Africa; maritime Southeast Asia (Singapore, Malaysia, Indonesia, Brunei and the Philippines); and the Caribbean and northern South America.
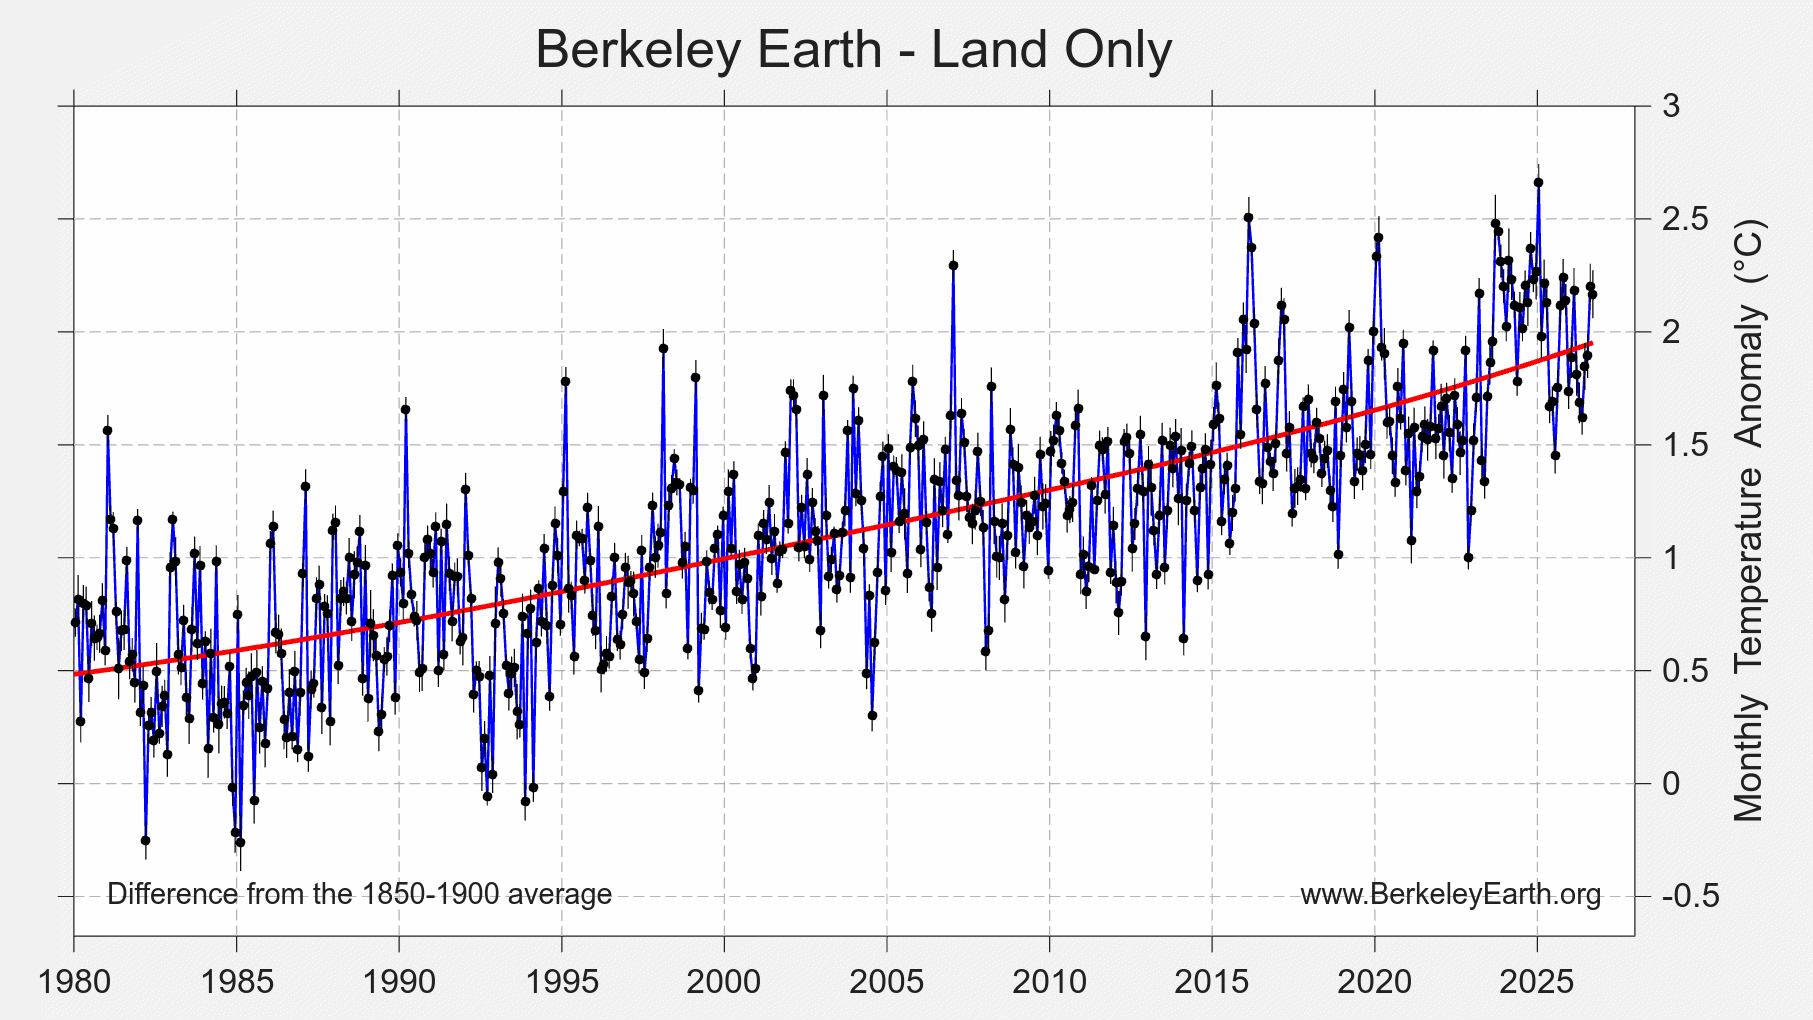
Over land regions, September 2026 was the 2nd warmest September since 1850, with a terrestrial average of 2.17 ± 0.16 °C (3.90 ± 0.29 °F) above the 1850–1900 average. It is clearly behind September 2023, by about 0.31 °C, but effectively tied with September 2024 and September 2025.
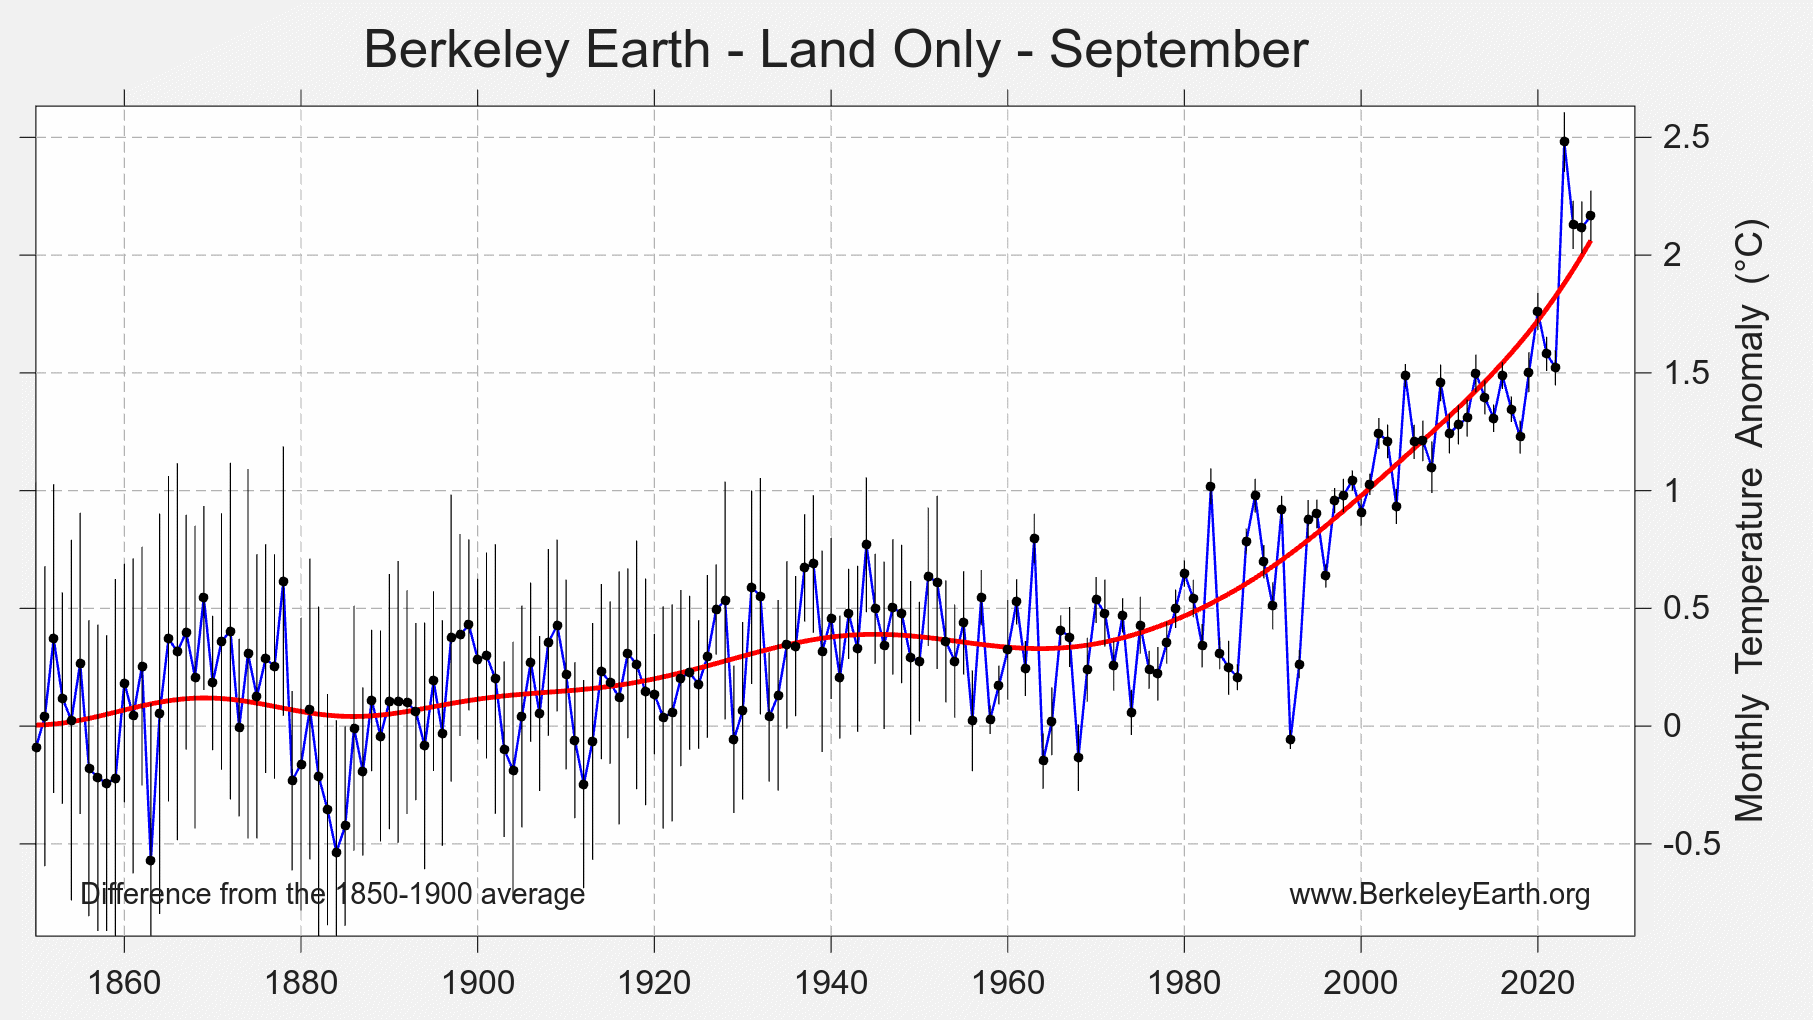
On a month-to-month basis, September 2026 over land was similar to August 2026, while both months remain clearly warmer than land averages earlier in the year.
The oceans were again where September was most remarkable. Average ocean temperatures in September 2026 were 1.368 ± 0.068 °C (2.46 ± 0.12 °F) above the 1850–1900 average, the warmest September on record for ocean surfaces. The margin over September 2023, about 0.14 °C, is twice the uncertainty, so this is a sharp and unambiguous record. Extending beyond just Septembers, this is nominally the warmest ocean month of any kind, slightly overtaking the record set just last monht.
Exceptional National Records
Of the 53 countries setting a new September record, eight did so by more than 0.5 °C, an unusually large step for a national monthly average, which more often advances by a few hundredths or tenths of a degree. They were Western Sahara by 0.74 °C, Ethiopia by 0.71 °C, the United Arab Emirates by 0.64 °C, Singapore by 0.61 °C, Andorra by 0.60 °C, Qatar by 0.56 °C, Bahrain by 0.53 °C, and Burkina Faso by 0.52 °C. However, some of these, like Western Sahara, Ethiopia, and UAE, come with relative high margins of uncertainty due to relatively sparse measurement networks.
Three of the eight border the Persian Gulf. The rest extend the month’s broader pattern: the Horn of Africa, West Africa, maritime Southeast Asia, and the far southwest of Europe together with the Atlantic coast of Africa just south of it.
Southwestern Europe’s Late-Season Heat
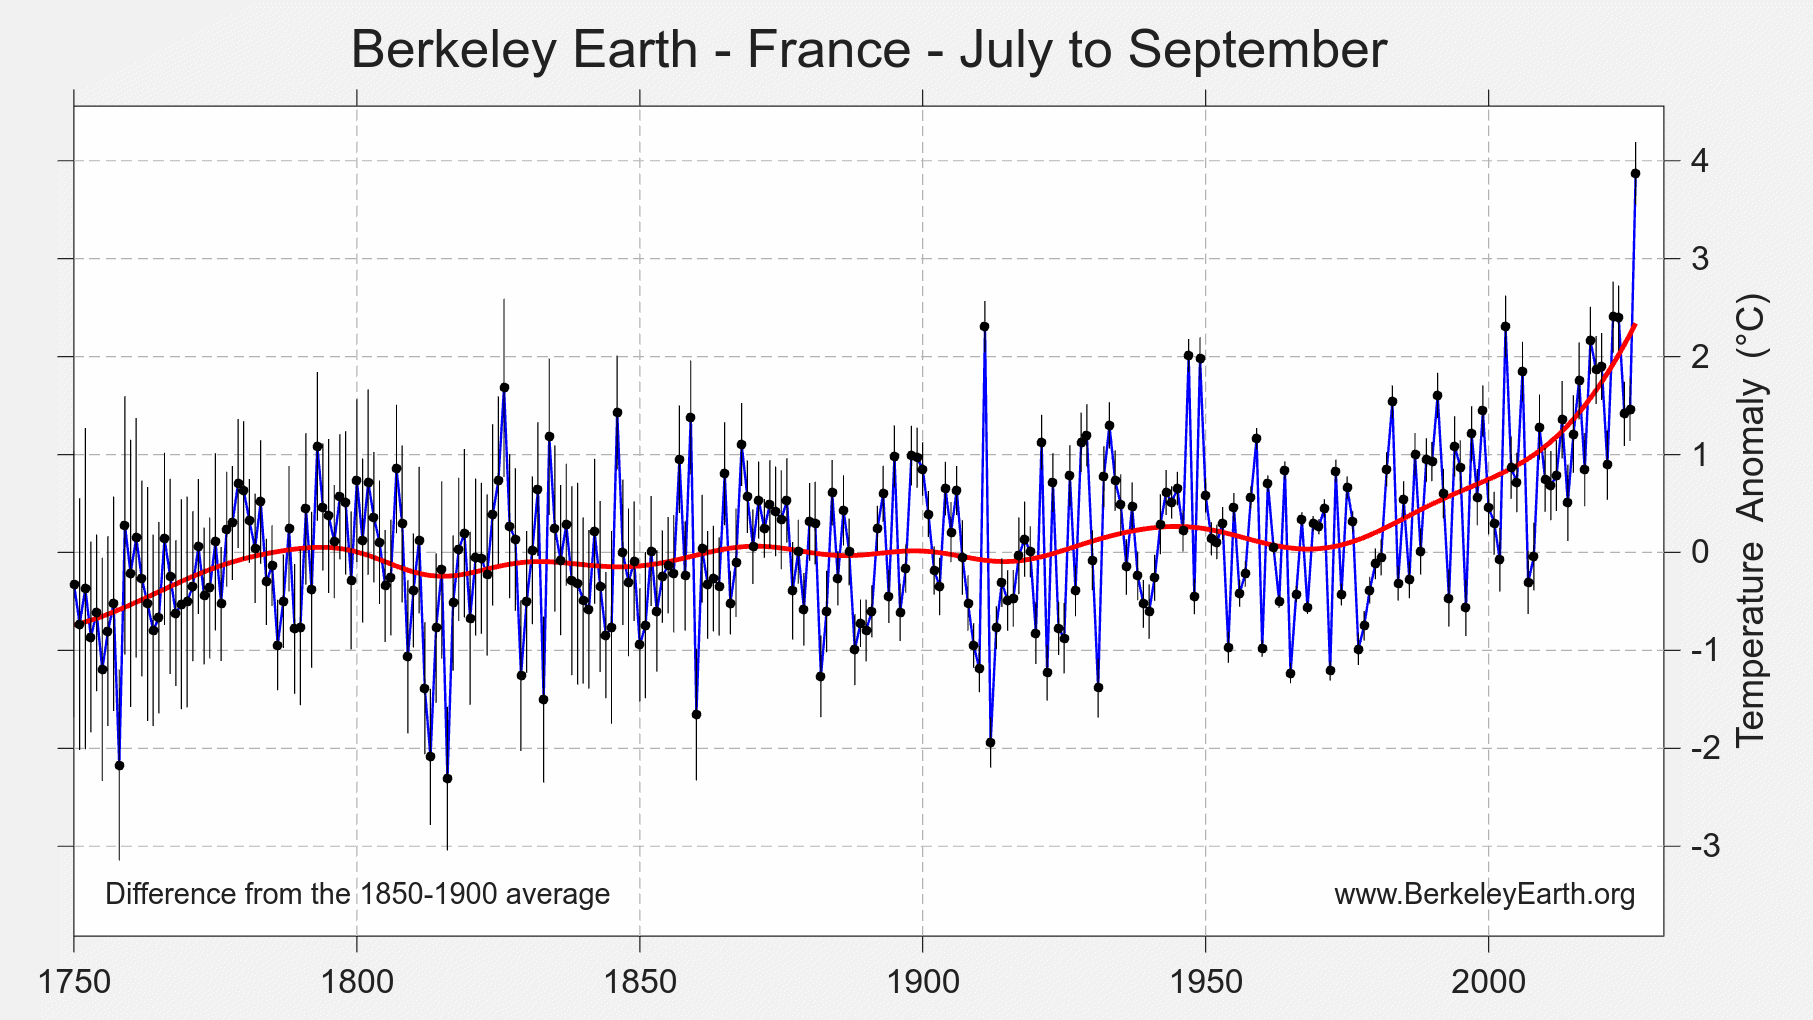
The warmth that made this a record summer across much of western Europe carried into September in the southwest. In our analysis, Spain, Portugal, Andorra and Italy each set national records for September average temperature, by 0.48 °C, 0.42 °C, 0.60 °C and 0.12 °C respectively, and France had its 2nd warmest September in a record extending back to the 18th century. Across the Strait of Gibraltar, Morocco and Western Sahara also set September records.
Over July to September as a whole, the signal is stronger still. France beat its previous warmest July to September by 1.47 °C, Andorra by 1.39 °C, Switzerland by 1.13 °C and Italy by 1.08 °C. Liechtenstein, Spain, Malta, Luxembourg and San Marino also set records by more than 0.5 °C, and Portugal, Belgium and the United Kingdom set records by smaller margins. These are among the longest records anywhere: for France, Italy and Switzerland the comparison reaches back into the eighteenth century.
On the ground, a reading of 45.7 °C (114 °F) at El Granado in Andalusia on 3 September equalled Spain’s national September record, set at Montoro in 2016, and the Spanish weather agency AEMET issued red heat alerts in September for the first time since such warnings began in 2007. The heat came with drought: Météo-France reports that September 2026 was the third driest September in France since measurements began in 1958, with an average rainfall deficit of 70%, and that drought of a severity seen about once in 10 years covered nearly the whole country.
ENSO Conditions
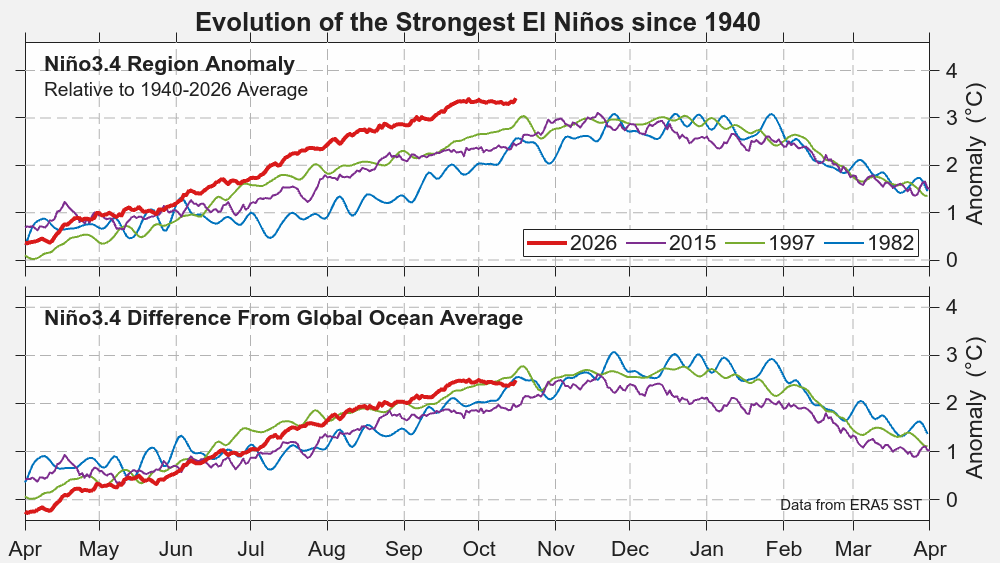
El Niño has now reached record strength on the conventional indices. The September monthly Niño 3.4 Index was about 2.9 °C, a record, beating the 2.75 °C reached in 2015 and in 1877, and daily values had climbed to 3.4 °C by early October. On the relative Oceanic Niño Index, which adjusts for the background warming of the tropical oceans, the event stood at 3.0 °C, close to but not yet at a record.
While this El Niño is undoubtedly among the strongest ever observed, how one understands is evolution is somewhat sensitive to the data set and baseline used. If one uses the raw temperatures in the Pacific, it has already eclipsed the peak temperatures reached during any past El Niño event. However, if one adjusts for the average warming of the global ocean, its trajectory is more similar to other very strong El Niño events. From a dynamical perspective, we believe this is the more reasonable framing. This El Niño is a very strong event whose characterics and evolution are likely similar to other very strong events by boosted in absolute terms by a warming ocean. However, the fact that the ocean is warmer today than in the past still has the potential to amplify the impacts to an intensity not seen in previous events.
The October runs of the dynamical models put the peak at about 4 °C on the Oceanic Niño Index, more likely in December than November. NOAA’s Climate Prediction Center maintains its El Niño Advisory and expects a strong to very strong event to persist through January–March 2027.
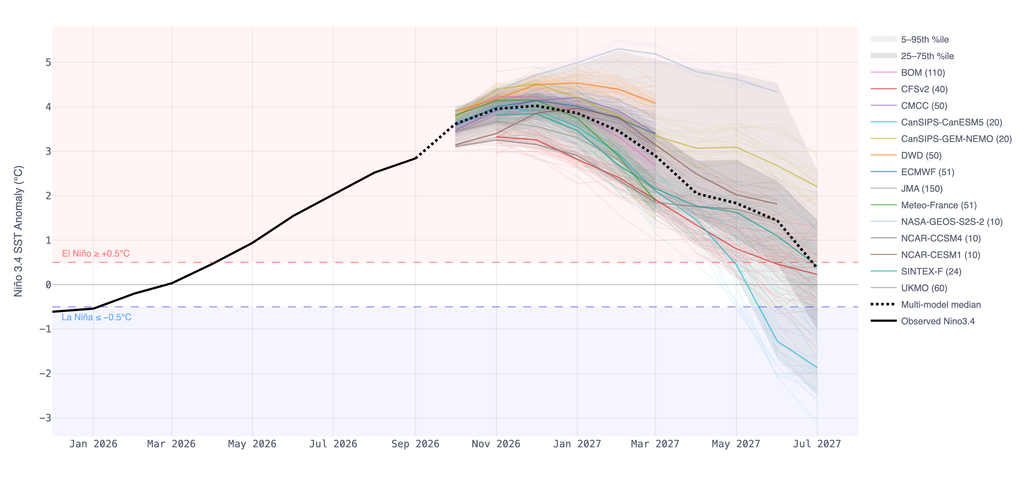
Because the global-average temperature response typically lags the peak in the central Pacific by several months, much of this event’s warming influence is expected to carry into 2027. For more information, see NOAA’s Climate Prediction Center report and our discussion at The Climate Brink.
2026 Outlook
With nine months of data in hand, we calculate roughly a 96% chance that 2026 will narrowly exceed 2024 to become the warmest year on record, up from about 93% in the August update. The only plausible alternative is a 2nd-place finish, at about 4%. We estimate the 2026 annual average is all but certain to exceed 1.5 °C (2.7 °F) above the 1850–1900 average, with a likely annual range of roughly 1.50–1.60 °C.
This forecast is remarkable for how much it has escalated over time. At the start of 2026 only a 12% chance was given and this even declined by May. However, the emergence of a record-breaking El Niño event has dramatically shifted the expectations. Despite only one month of 2026 having set a monthly record so far, we anticipate record warm conditions during the rest of 2026 and that this will very likely be sufficient to narrowly push temperatures across the record threshold.
This forecast is contingent on the current extreme El Niño event continuing to develop in a typical fashion similar to other very strong El Niño events. A large deviation from typical behavior, such as an early peak (i.e. October) is the most likely scenario for avoiding record warmth.
| Estimated probability of 2026 annual final ranking | Likelihood |
|---|---|
| Warmest year on record (1st) | ~96% |
| 2nd warmest | ~4% |
| 3rd warmest or lower | <1% |
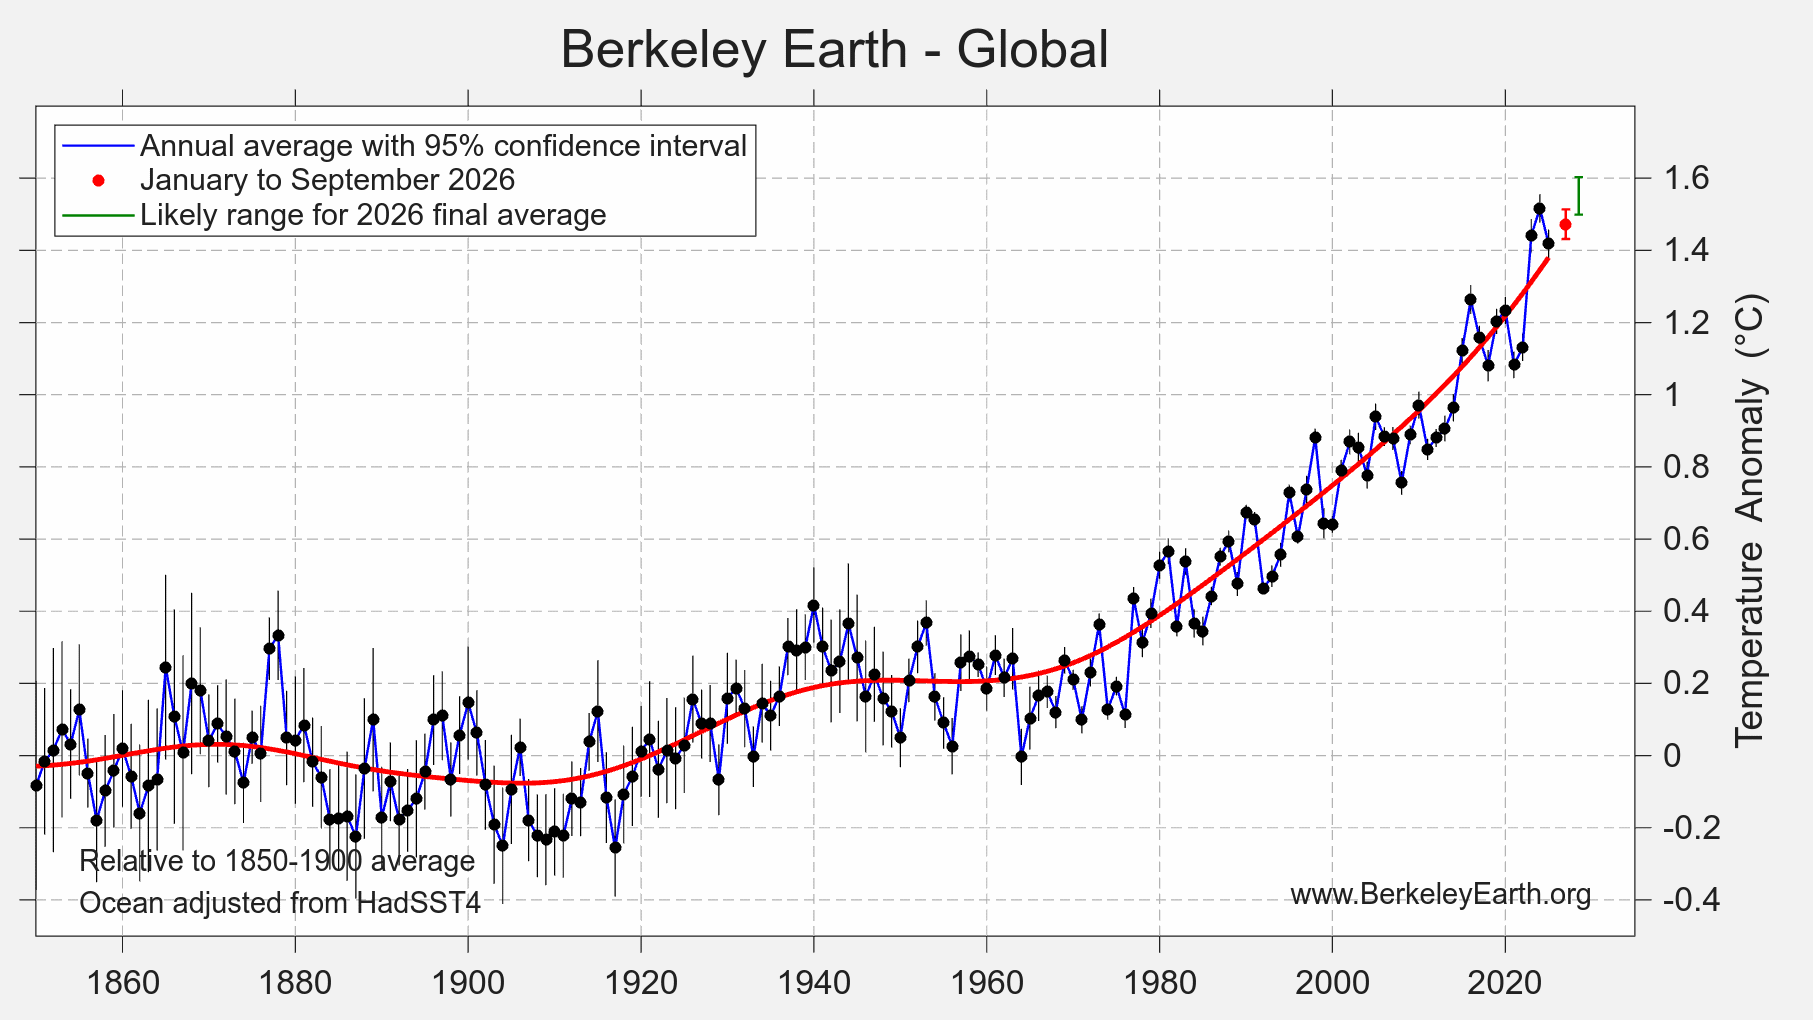
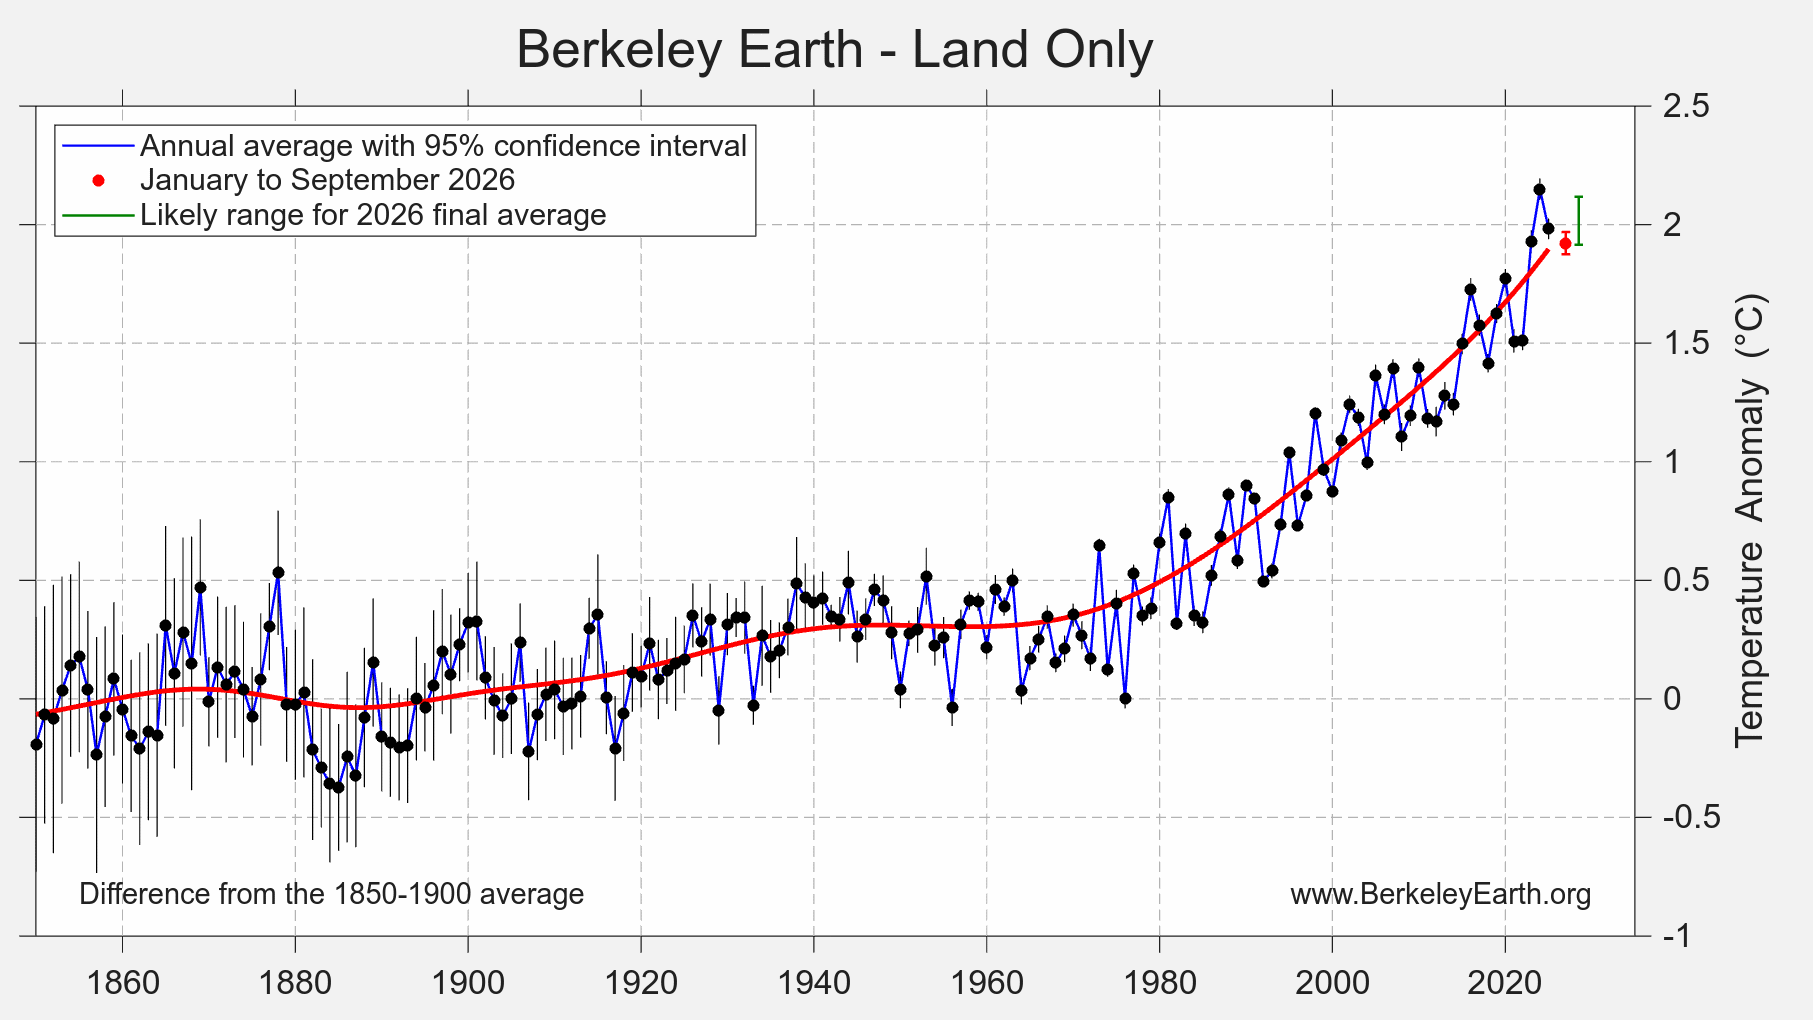
Land and ocean continue to tell different stories. For the oceans, a record annual average in 2026 is effectively certain. On land, a record is now very unlikely, at well under 1%. The most likely outcome is a 2nd-place finish behind 2024, at roughly 76%, with a 3rd-place finish at about 21%.
Updated Station Dataset
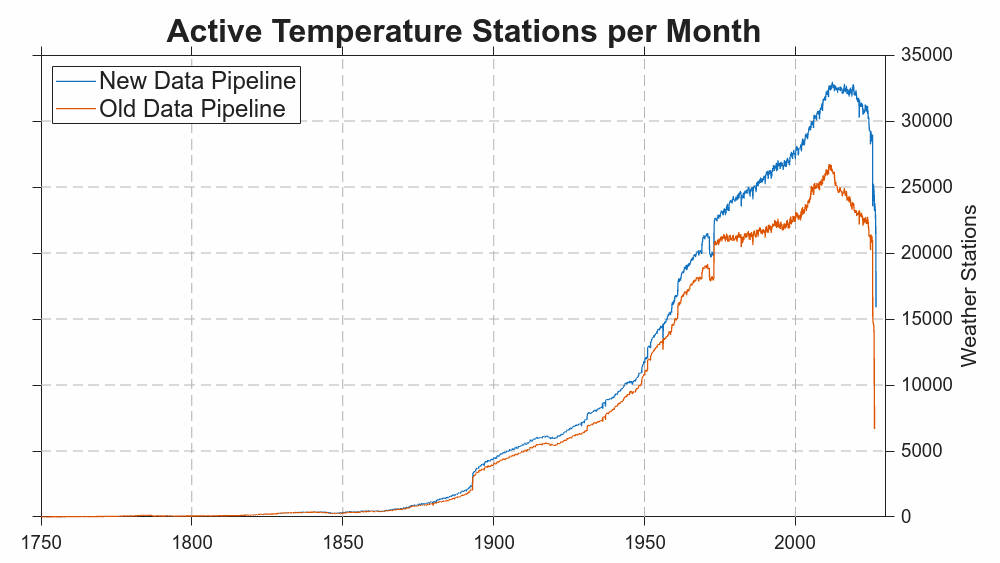
This report marks the introduction of a new weather station Data Pipeline for Berkeley Earth that draws more directly on national weather service data and is less reliant on pre-existing merged weather stations archives. It expand the number of available weather stations from ~58,000 to ~73,000 while using the same quality control, merging and deduplication processes as the previous pipeline.
The previous pipeline drew upon 21 datasets, while the new dataset draws upon 71 data sources. Among the additional data sources are national station datasets reported by the UK, Brazil, France, Germany, Thailand, Canada, Mexico, Chile, Australia, Finland, Sweden, Switzerland, among others. We have also added several current and historical multi-national data collections representing the Arctic, Antarctic, and Africa. Lastly, we have added data from the WIS2 platform operated by the WMO. WIS2 is a international data sharing platform developed by the WMO whose primary aim is to facilitate weather forecasting by providing a near real-time feed of weather stations. Under international data sharing agreements, most countries participate in WIS2, even ones that do not generally provide prompt open access to their archives. Unlike most other sources, WIS2 provides no historical archive, but the data can be matched to existing archives to extend known weather stations.
This combination of sources provides robust global coverage without having to rely on any single data provider, and should make Berkeley Earth more resilient against any possible data source disruptions in the future.
It also adds approximately ~15,000 weather stations whose histories were not previously captured. Most of these are in regions that were already well sampled. For example, France and Japan each add thousands of new stations. Such additional stations are useful for improving local precision and reducing local uncertainties, but don’t materially impact large-scale averages. Most of the additional data now added is similarly of low novelty, though some of the coverage in Antarctica, the Arctic, and Africa may help fill in areas of relative sparseness. In addition, many of the additional stations are often relatively short (e.g. <10 years) limiting their long-term value. Nevertheless the peak number of active weather stations has risen from ~26,000 to ~34,000.
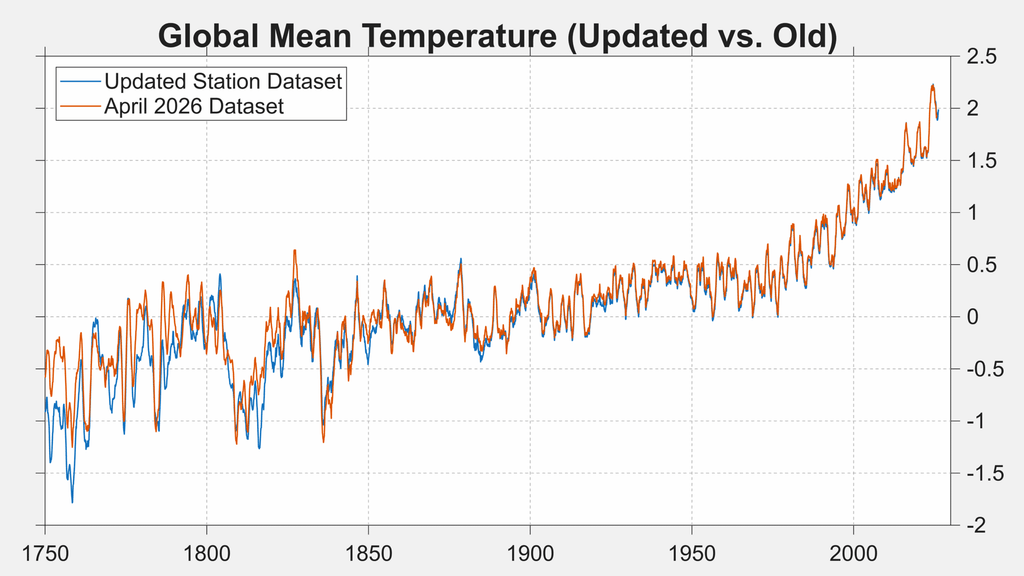
Comparing the new dataset to the old one for the purpose of calculating global mean temperatures we find that the difference is negligible, and less than the published uncertainties for nearly all months.
Methodology and Data
This analysis uses the Berkeley Earth high-resolution land temperature field combined with a reinterpolated version of the UK Met Office Hadley Centre’s HadSST4 sea surface temperature data. The land component draws on 27,995,704 monthly-average temperature observations from 73,286 weather stations; the ocean component draws on 509,070,950 HadSST4 measurements collected by ships and buoys. The combined field is produced at 0.25° × 0.25° resolution. Where sea ice is present, temperature anomalies are extrapolated from land-surface air temperatures rather than from the water beneath the ice.
HadSST4 is frequently delayed by one or more months relative to surface weather station data. Where the most recent months are not yet covered by HadSST4, the ocean field is extended using ERA5 sea surface temperatures, bias-corrected against HadSST4 over their common period from 1980 onward. The correction is computed separately for each calendar month and each grid cell, and an additional uncertainty term derived from the residual scatter between the two datasets is carried through into the reported uncertainties. For this report, the HadSST4 component was updated on 14 October 2026 and includes 1,179,105 ocean observations for September itself, so September 2026 ocean temperatures rest on ship and buoy measurements rather than on the extension. The same update brings August 2026, which rested on the extension in last month’s report, onto HadSST4 observations.
Uncertainties quoted throughout are 95% confidence intervals. They arise from the incomplete spatial coverage of historical weather observations, from noise in measurement devices, and from biases introduced by systematic changes in measurement technologies and methods. Uncertainty is largest in the nineteenth century and smallest in recent decades, which is why comparisons against the 1850–1900 pre-industrial baseline carry a wider range than comparisons against 1951–1980.
This report reflects observations recorded into the global archives as of the analysis date (land component 13 October 2026; ocean component 14 October 2026), with 15,890 stations having reported for September itself by that point. Reporting for the most recent month is always incomplete, and additional observations for this period will continue to arrive and be incorporated into later updates. Such revisions are typically small and are unlikely to alter the qualitative conclusions presented here, though they may change rankings where periods are separated by less than the stated uncertainty.
Updated data files are posted at the Berkeley Earth data page and are refreshed monthly. The global monthly and annual land-and-ocean series used here are available directly as Land_and_Ocean_complete.txt and Land_and_Ocean_summary.txt. Gridded fields, regional averages and station records are available from the same page.
The same underlying data can also be explored through Berkeley Earth Synthesis, which provides an interactive alternative access point, including historical and projected conditions for individual cities and regions.
Copyright
This report and the figures it contains may be reused under the terms of the Creative Commons BY-NC 4.0 copyright license for any non-commercial purpose. News media may use these materials for reporting purposes with attribution to Berkeley Earth. For commercial licensing, please contact admin@berkeleyearth.org.